


 |
市場調查報告書
商品編碼
2071203
需量反應市場機會、成長要素、產業趨勢分析及2026-2035年預測。Demand Response Market Opportunity, Growth Drivers, Industry Trend Analysis, and Forecast 2026 - 2035 |
||||||

據估計,到 2025 年,全球需量反應市場規模將達到 111 億美元,年複合成長率為 9.1%,到 2035 年將達到 266 億美元。
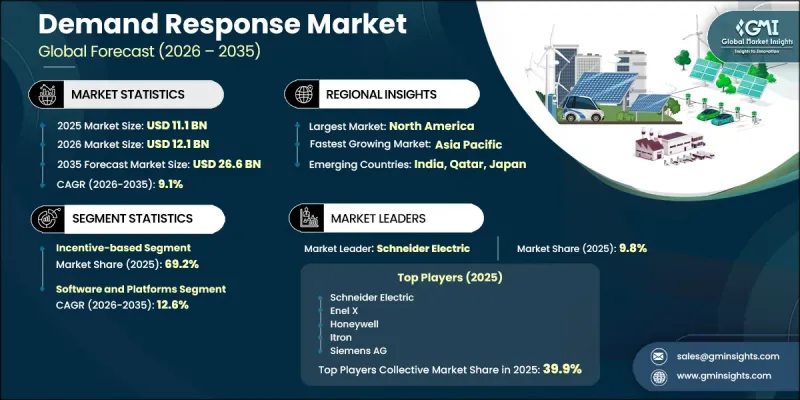
這一成長反映了現代電力系統正在發生的持續變革,能源供應商正致力於在整個電網範圍內實現更高的柔軟性、效率和可靠性。儘管商業和工業用戶仍然是專案參與者中佔比最大的群體,但由於互聯能源管理技術和先進能源聚合解決方案的日益普及,住宅用戶的參與度也在不斷提高。一場意義非凡的產業變革正在進行,物聯網平台和基於人工智慧 (AI) 的最佳化工具正在取代傳統的需求管理方法。因此,需量反應被視為一種策略性電網資源,它不僅可以降低能源成本,還能創造經濟價值。參與需量反應舉措能夠為消費者帶來可衡量的經濟效益,有助於降低電費並創造新的商機。然而,實施需量反應計畫通常需要投資先進的測量系統、自動化控制系統、通訊技術和配套基礎設施,這對於缺乏完善的智慧型能源基礎設施的機構而言,可能是一項巨大的財務挑戰。
| 市場範圍 | |
|---|---|
| 開始年份 | 2025 |
| 預測期 | 2026-2035 |
| 上市時的市場規模 | 111億美元 |
| 預計金額 | 266億美元 |
| 複合年成長率 | 9.1% |
預計到2025年,基於獎勵的需量反應(IBDR)將佔電網總佔有率的69.2%。在這些項目中,參與者透過在電網負載高峰期減少或轉移電力消耗來獲得經濟獎勵。獎勵機制包括直接獎勵、績效獎金或電費折扣。由於擁有強大負載轉移主導的大規模電力消耗的積極參與,該領域持續保持領先地位,使得基於獎勵的需量反應成為現代電網管理策略的關鍵要素。
預計到2025年,價格掛鉤需量反應(PBDR)市佔率將達到30.8%。這一成長主要歸功於住宅和商業用戶群中動態電價模式的日益普及。這些模式鼓勵消費者根據不斷變化的價格訊號調整用電習慣,從而在無需電力公司直接干預的情況下實現更有效率的能源消耗。此外,高階計量基礎設施(AMI)的持續部署也顯著促進了這一領域的發展。 AMI使電力公司能夠實施更複雜的定價結構,並透過即時能源管理功能提升客戶參與。
預計到2025年,歐洲需量反應市場佔有率將達到15%,並在2035年之前以9.8%的複合年成長率成長。該地區持續受益於旨在促進市場參與企業、提升互通性並建立標準化營運框架的各項支持性監管措施。近期訂定的政策舉措,重點關注市場准入、資格要求和數據共用協議,這些舉措正助力為需量反應運營商和能源聚合商打造更加一體化的環境。這些趨勢有望促進需量反應技術在區域電力市場的更廣泛應用,並推動產業長期發展和電網現代化。
目錄
第1章:調查方法和範圍
第2章執行摘要
第3章 行業洞察
- 產業生態系統
- 監理情勢
- 北美洲
- 歐洲
- 亞太地區
- 中東和非洲
- 拉丁美洲
- 影響產業的因素
- 促進因素
- 產業潛在風險與挑戰
- 成長潛力分析
- 波特的分析
- PESTLE分析
- 人工智慧和生成式人工智慧對市場的影響
- 預測性維護和故障檢測
- 電網最佳化和負載預測
- 利用數位雙胞胎進行模擬和測試
- 風險、限制和監管考量
- 新機會和趨勢
- 數位化和物聯網整合
- 進入新興市場
- 整體投資情勢與未來展望
第4章 競爭情勢
- 介紹
- 企業市佔率分析:按地區分類
- 北美洲
- 歐洲
- 亞太地區
- 中東和非洲
- 拉丁美洲
- 主要市場公司的競爭分析
- 競爭定位矩陣
- 主要進展
- 併購
- 夥伴關係和聯盟
- 新產品發布
- 業務拓展計劃及資金籌措
- 按公司規模進行基準測試
- 排名分類標準與選擇標準
- 按銷售額、地區和創新能力分類的層級定位矩陣。
第5章 市場規模及預測:依服務類型分類,2022-2035年
- 獎勵型DR
- 基於價格的需量反應(DR)
第6章 市場規模及預測:依技術分類,2022-2035年
- 先進計量基礎設施(AMI)
- 能源管理系統(EMS)
- 自動需量反應(ADR)
- 智慧恆溫器和暖通空調控制
- 利用物聯網和人工智慧的災難復原平台
- 虛擬電廠(VPP)平台
- 其他
第7章 市場規模及預測:依組件分類,2022-2035年
- 軟體和平台
- 硬體
- 服務
第8章 市場規模及預測:依部署方式分類,2022-2035年
- 基於雲端的
- 現場
- 混合
第9章 市場規模及預測:依通訊方式分類,2022-2035年
- Wired
- 無線的
第10章 市場規模及預測:依應用領域分類,2022-2035年
- 尖峰負載管理
- 電網的可靠性和擴充性
- 最佳化能源成本
- 可再生能源的整合
- 輔助服務和頻率調整
- 其他
第11章 市場規模與預測:依最終用戶分類,2022-2035年
- 產業
- 商業
- 住宅
- 公用事業
第12章 市場規模及預測:依地區分類,2022-2035年
- 北美洲
- 美國
- 加拿大
- 歐洲
- 英國
- 德國
- 法國
- 義大利
- 西班牙
- 俄羅斯
- 亞太地區
- 中國
- 韓國
- 日本
- 印度
- 澳洲
- 東南亞
- 中東和非洲
- 沙烏地阿拉伯
- UAE
- 卡達
- 南非
- 拉丁美洲
- 巴西
- 墨西哥
- 阿根廷
第13章:公司簡介
- ABB
- Centrica Business Solutions
- CPower Energy Management
- Eaton
- Enel X
- EnergyHub
- GE Vernova
- Honeywell
- Itron
- Johnson Controls
- Landis+Gyr
- Leap
- Next Kraftwerke
- OhmConnect
- Oracle Utilities
- Schneider Electric
- Siemens AG
- Tesla Energy
- Uplight
- Voltus Inc.
The Global Demand Response Market was valued at USD 11.1 billion in 2025 and is estimated to grow at a CAGR of 9.1% to reach USD 26.6 billion by 2035.
The growth reflects the ongoing transformation of modern power systems as energy providers seek greater flexibility, efficiency, and reliability across electricity networks. Commercial and industrial consumers continue to represent the largest share of program participation, while residential adoption is gaining momentum due to the wider availability of connected energy management technologies and advanced energy aggregation solutions. A notable industry shift is occurring through the adoption of IoT-enabled platforms and artificial intelligence-based optimization tools, which are replacing traditional demand management approaches. As a result, demand response is increasingly being viewed as a strategic grid resource capable of generating economic value rather than solely reducing energy costs. Participation in demand response initiatives offers measurable financial benefits to consumers, helping reduce electricity expenses while creating additional revenue opportunities. However, implementation often requires investment in advanced metering systems, automated controls, communication technologies, and supporting infrastructure, which can present financial challenges for organizations without established smart energy foundations.
| Market Scope | |
|---|---|
| Start Year | 2025 |
| Forecast Year | 2026-2035 |
| Start Value | $11.1 Billion |
| Forecast Value | $26.6 Billion |
| CAGR | 9.1% |
The incentive-based demand response (IBDR) segment held a 69.2% share in 2025. Under these programs, participants receive financial compensation in exchange for reducing or shifting electricity consumption during periods of grid stress or peak demand. Compensation mechanisms may include direct incentives, performance-based payments, or energy bill benefits. The segment continues to maintain its leading position due to strong participation from large-scale energy consumers capable of delivering substantial load flexibility, making incentive-based demand response an important component of modern grid management strategies.
The price-based demand response (PBDR) segment held a 30.8% share in 2025. Growth is driven by the expanding adoption of dynamic electricity pricing models across residential and commercial customer segments. These programs encourage consumers to modify electricity usage patterns in response to changing price signals, enabling more efficient energy consumption without direct intervention from utilities. The segment benefits significantly from the continued rollout of advanced metering infrastructure, which allows utilities to implement sophisticated pricing structures and improve customer engagement through real-time energy management capabilities.
Europe Demand Response Market accounted for 15% share in 2025 and is forecast to grow at a CAGR of 9.8% through 2035. The region continues to benefit from supportive regulatory developments designed to enhance market participation, improve interoperability, and establish standardized operating frameworks. Recent policy initiatives focused on market accessibility, qualification requirements, and data-sharing protocols are helping create a more integrated environment for demand response providers and energy aggregators. These developments are expected to facilitate broader adoption across regional electricity markets while supporting long-term industry expansion and grid modernization efforts.
Key companies operating in the Global Demand Response Industry include Eaton, Oracle Utilities, ABB, Next Kraftwerke, Honeywell, Schneider Electric, GE Vernova, Enel X, Landis+Gyr, Tesla Energy, Siemens AG, Johnson Controls, Centrica Business Solutions, Uplight, and Itron. Leading participants in the demand response market are adopting a variety of strategies to strengthen their competitive position and expand market share. Companies are investing heavily in advanced software platforms, artificial intelligence capabilities, predictive analytics, and cloud-based energy management solutions to enhance operational efficiency and customer value. Strategic partnerships with utilities, technology providers, and energy service organizations are helping businesses broaden their market reach and accelerate solution deployment. Many firms are also pursuing acquisitions and regional expansion initiatives to strengthen their customer base and diversify service offerings. Investments in smart grid integration, distributed energy resource management, and virtual power plant technologies continue to support innovation across the sector.
Table of Contents
Chapter 1 Methodology & Scope
- 1.1 Research design
- 1.2 Quality commitment
- 1.2.1 GMI AI policy & data integrity commitment
- 1.2.1.1 Source consistency protocol
- 1.2.1 GMI AI policy & data integrity commitment
- 1.3 Research Trail & Confidence Scoring
- 1.3.1 Research Trail Components
- 1.3.2 Scoring Components
- 1.4 Data Collection
- 1.4.1 Partial list of primary sources
- 1.5 Data mining sources
- 1.5.1 Paid sources
- 1.5.1.1 Sources, by region
- 1.5.1 Paid sources
- 1.6 Base estimates and calculations
- 1.6.1 Base year calculation for any one approach
- 1.7 Forecast model
- 1.8 Research transparency addendum
- 1.8.1 Source attribution framework
- 1.8.2 Quality assurance metrics
- 1.8.3 Our commitment to trust
- 1.9 Market definitions
Chapter 2 Executive Summary
- 2.1 Industry synopsis, 2022 - 2035
- 2.2 Business trends
- 2.3 Service type trends
- 2.4 Technology trends
- 2.5 Components trends
- 2.6 Deployment trends
- 2.7 Communication trends
- 2.8 Application trends
- 2.9 End user trends
- 2.10 Region trends
Chapter 3 Industry Insights
- 3.1 Industry ecosystem
- 3.2 Regulatory landscape
- 3.2.1 North America
- 3.2.2 Europe
- 3.2.3 Asia Pacific
- 3.2.4 Middle East & Africa
- 3.2.5 Latin America
- 3.3 Industry impact forces
- 3.3.1 Growth drivers
- 3.3.2 Industry pitfalls & challenges
- 3.4 Growth potential analysis
- 3.5 Porter's analysis
- 3.5.1 Bargaining power of suppliers
- 3.5.2 Bargaining power of buyers
- 3.5.3 Threat of new entrants
- 3.5.4 Threat of substitutes
- 3.6 PESTEL analysis
- 3.6.1 Political factors
- 3.6.2 Economic factors
- 3.6.3 Social factors
- 3.6.4 Technological factors
- 3.6.5 Legal factors
- 3.6.6 Environmental factors
- 3.7 Impact of AI & generative AI on the market
- 3.7.1 Predictive maintenance & fault detection
- 3.7.2 Grid optimization & load forecasting
- 3.7.3 Digital twin simulation & testing
- 3.7.4 Risks, limitations & regulatory considerations
- 3.8 Emerging opportunities & trends
- 3.8.1 Digitalization & IoT integration
- 3.8.2 Emerging market penetration
- 3.9 Overall investment scenario and future outlook
Chapter 4 Competitive landscape, 2026
- 4.1 Introduction
- 4.2 Company market share analysis, by region, 2025
- 4.2.1 North America
- 4.2.2 Europe
- 4.2.3 Asia Pacific
- 4.2.4 Middle East & Africa
- 4.2.5 Latin America
- 4.3 Competitive analysis of major market players
- 4.4 Competitive positioning matrix
- 4.5 Key developments
- 4.5.1 Mergers & acquisitions
- 4.5.2 Partnerships & collaborations
- 4.5.3 New product launches
- 4.5.4 Expansion plans & funding
- 4.6 Company tier benchmarking
- 4.6.1 Tier classification criteria & qualifying thresholds
- 4.6.2 Tier positioning matrix by revenue, geography & innovation
Chapter 5 Market Size and Forecast, By Service type, 2022 - 2035 (USD Billion)
- 5.1 Key trends
- 5.2 Incentive-based DR
- 5.3 Price-based DR
Chapter 6 Market Size and Forecast, By Technology, 2022 - 2035 (USD Billion)
- 6.1 Key trends
- 6.2 Advanced metering infrastructure (AMI)
- 6.3 Energy management systems (EMS)
- 6.4 Automated demand response (ADR)
- 6.5 Smart thermostats & HVAC control
- 6.6 IoT & AI-based DR platforms
- 6.7 Virtual power plant (VPP) platforms
- 6.8 Others
Chapter 7 Market Size and Forecast, By Component, 2022 - 2035 (USD Billion)
- 7.1 Key trends
- 7.2 Software & platforms
- 7.3 Hardware
- 7.4 Services
Chapter 8 Market Size and Forecast, By Deployment, 2022 - 2035 (USD Billion)
- 8.1 Key trends
- 8.2 Cloud-based
- 8.3 On-premises
- 8.4 Hybrid
Chapter 9 Market Size and Forecast, By Communication, 2022 - 2035 (USD Billion)
- 9.1 Key trends
- 9.2 Wired
- 9.3 Wireless
Chapter 10 Market Size and Forecast, By Application, 2022 - 2035 (USD Billion)
- 10.1 Key trends
- 10.2 Peak load management
- 10.3 Grid reliability & scalability
- 10.4 Energy cost optimization
- 10.5 Renewable integration
- 10.6 Ancillary services & frequency reg.
- 10.7 Others
Chapter 11 Market Size and Forecast, By End user, 2022 - 2035 (USD Billion)
- 11.1 Key trends
- 11.2 Industrial
- 11.3 Commercial
- 11.4 Residential
- 11.5 Utilities
Chapter 12 Market Size and Forecast, By Region, 2022 - 2035 (USD Billion)
- 12.1 Key trends
- 12.2 North America
- 12.2.1 U.S.
- 12.2.2 Canada
- 12.3 Europe
- 12.3.1 UK
- 12.3.2 Germany
- 12.3.3 France
- 12.3.4 Italy
- 12.3.5 Spain
- 12.3.6 Russia
- 12.4 Asia Pacific
- 12.4.1 China
- 12.4.2 South Korea
- 12.4.3 Japan
- 12.4.4 India
- 12.4.5 Australia
- 12.4.6 Southeast Asia
- 12.5 Middle East & Africa
- 12.5.1 Saudi Arabia
- 12.5.2 UAE
- 12.5.3 Qatar
- 12.5.4 South Africa
- 12.6 Latin America
- 12.6.1 Brazil
- 12.6.2 Mexico
- 12.6.3 Argentina
Chapter 13 Company Profiles
- 13.1 ABB
- 13.2 Centrica Business Solutions
- 13.3 CPower Energy Management
- 13.4 Eaton
- 13.5 Enel X
- 13.6 EnergyHub
- 13.7 GE Vernova
- 13.8 Honeywell
- 13.9 Itron
- 13.10 Johnson Controls
- 13.11 Landis+Gyr
- 13.12 Leap
- 13.13 Next Kraftwerke
- 13.14 OhmConnect
- 13.15 Oracle Utilities
- 13.16 Schneider Electric
- 13.17 Siemens AG
- 13.18 Tesla Energy
- 13.19 Uplight
- 13.20 Voltus Inc.

 自動需量反應(ADR) 市場規模、佔有率和成長分析(按組件、需量反應類型、應用、最終用戶、程序類型和地區分類):行業預測(2026-2033 年)
 全球需量反應市場規模、佔有率、趨勢和成長分析報告(2026-2034)
 自動需量反應(Auto:DR) 市場預測至 2034 年-按電力公司類型、專案類型、部署模式、技術、最終用戶和地區分類的全球分析需量反應市場預測至2034年—按專案類型、部署模式、技術、最終用戶和地區分類的全球分析
 需量反應管理系統市場:按組件、類型、通訊技術、程序類型、應用和最終用戶分類-2026-2032年全球市場預測需量反應和負載管理解決方案市場預測——按解決方案類型、技術、應用、最終用戶和地區分類的全球分析——2034年
 亞太地區需量反應管理系統:市場佔有率分析、產業趨勢與統計、成長預測(2026-2031 年)自動化需量反應管理系統:市場佔有率分析、產業趨勢與統計、成長預測(2026-2031 年)
 2026年全球分散式能源資源(DER)安全合規市場報告2026年全球需量反應(DR)市場報告