


 |
市場調查報告書
商品編碼
2063422
結果即服務軟體:市場佔有率分析、產業趨勢與統計、成長預測(2026-2031 年)Outcome-as-a-Service Software - Market Share Analysis, Industry Trends & Statistics, Growth Forecasts (2026 - 2031) |
||||||

※ 本網頁內容可能與最新版本有所差異。詳細情況請與我們聯繫。
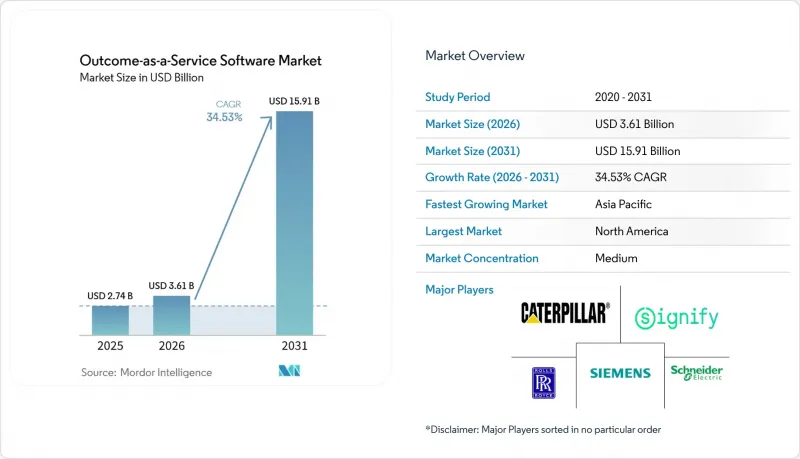
根據 Mordor Intelligence 預測,成果即服務 (Outcome-as-a-Service) 軟體市場將從 2025 年的 27.4 億美元和 2026 年的 36.1 億美元成長到 2031 年的 159.1 億美元,2026 年至 2031 年的複合年成長率為 3%。
本報告按服務類型(諮詢顧問、實施整合及其他)、定價模式(訂閱、績效付費、收益分成、混合模式)、技術(人工智慧和分析平台、物聯網和感測器網路及其他)、應用領域(醫療保健和生命科學及其他)以及地區進行細分。市場預測以美元計價。
全球成果即服務 (OaaS) 軟體市場趨勢與洞察
對按效果付費經營模式的需求日益成長
受夠了按小時計費和零件更換合約的束縛,各公司越來越傾向於採用與運作、處理能力或收入成長掛鉤的收費系統。勞斯萊斯公司的TotalCare專案將引擎費用與飛行小時數掛鉤,預計到2025年,該專案將貢獻該公司超過一半的商業航太業務收益,這表明對於航空公司而言,可預測的營運成本比擁有成本更為重要。米其林基於里程的輪胎合約也採用了類似的機制,預計到2025年,該合約將使60萬輛汽車的燃油成本降低5.9%,停機時間減少8%。倉儲自動化專家Advanced 物流公司根據處理速度向客戶收費,並將獎勵與生產力提升掛鉤。基於績效的定價模式可以提高供應商的終身價值,但強大的遙測技術和清晰的合約條款對於避免爭議至關重要。
加速企業採用人工智慧和進階分析平台
能夠提前 30 至 90 天檢測故障的預測演算法,已將效能保證從單純的投機性賭注轉變為資料驅動的承諾。 C3 AI 的「可靠性」應用程式能夠以 92% 的準確率預測設備故障,使服務供應商無需儲備大量備件即可承諾 98% 的運轉率。 UptimeAI 將在 2025 年前將工業領域的意外停機時間減少 30%,從而能夠制定更嚴格的服務水準標準。 IBM Maximo 將在 2025 年前每天處理超過 10 億條感測器測量數據,為公共產業和重工業領域基於績效的合約提供分析基礎。隨著人工智慧工具包的日趨成熟,供應商將能夠更準確地評估風險,從而加速基於績效的合約的普及。
定義和歸因可衡量結果的難度
當多個供應商影響相同指標時,基於績效的合約往往會失效,導致爭議和付款延遲。一項針對 47 個項目的學術研究發現,38% 的項目未能達到目標,62% 的重新談判是由於歸因問題造成的。 GE Digital 的 Predix 系統推廣受阻,因為客戶難以區分平台帶來的效益和無關的流程調整。在醫療保健領域,美國醫療保險和醫療補助服務中心 (CMS) 在未能將數十億美元的成本與患者療效聯繫起來後,放棄了基於價值的保險試點計畫。在標準化的衡量標準出現之前,供應商可能更傾向於因果關係更清晰的單方合作模式。
細分市場分析
2025年,管理成果服務將佔總收入的44.43%,這反映出客戶對跨複雜資產類別的單一供應商課責的需求。隨著成熟企業利用數十年的營運數據來確保運轉率、效率和合規性,管理成果即服務 (OaaS) 軟體市場正在不斷擴張。Schneider Electric憑藉EcoStruxure Foresight Operation鞏固了其在管理服務領域的地位。該產品於2026年第三季正式發布,透過結合全天候監控和預測性維護,承諾將故障風險降低75%。
隨著部署基礎設施的日趨成熟,買家在不中斷現有工作流程的前提下尋求增量收益,預計到2031年,支援和最佳化服務將以每年34.89%的速度成長。 GE Digital與可再生能源供應商Invenergy簽訂的長期合約就是一個典型的例子,展示了部署後如何透過調整來進一步提升互聯資產的產出。雖然諮詢服務對於不熟悉結果經濟學的公司仍然至關重要,但隨著部署流程日益標準化,實施利潤空間正在縮小。最佳化合約的擴展意味著供應商能夠掌控自身獨特的效能數據,從而獲得高彈性和高利潤的經常性收入,這將提高供應商的轉換成本,並進一步鞏固其在「結果即服務」(Outcome-as-a-Service)軟體市場中的地位。
到2025年,訂閱模式將佔收入的52.78%,因為財務部門更傾向於預算確定性和最小的波動性。這些合約鞏固了「結果即服務」軟體市場的佔有率,使供應商能夠將硬體、軟體和基本支援捆綁到一個固定的月費中。儘管如此,基於績效的合約條款正以35.32%的複合年成長率成長,這主要得益於企業希望獲得與供應商共用利潤的獎勵。米其林的「里程收費」框架(根據里程數設定輪胎價格)表明,基於使用量的指標可以取代前期投資。
目前,混合模式將基礎訂閱與增量調整相結合,以實現可預測的現金流量和結果課責。 Afni 的收益分成協議就是這種折衷方案的典範,根據該協議,服務供應商可獲得已實現成本節約的 20-25%。隨著人工智慧降低結果的波動性,供應商可以在不影響盈利的前提下,對結果組成部分進行更積極的競標,從而提高訂閱續訂率,並擴大「結果即服務」軟體市場的風險分擔效益。
區域分析
北美擁有成熟的法律體制、豐富的分析人才以及公共部門的積極採納,預計到2025年將佔全球收入的34.09%。美國總務管理局(GSA)的「基本契約卓越中心」以及美國醫療保險和醫療補助服務中心(CMS)的「責任醫療計劃」的擴展,正在將以結果為導向的採購制度化,並鼓勵供應商承擔績效風險以換取更高的價格。加拿大正在試行與結果掛鉤的基礎設施特許經營,墨西哥正在將績效指標納入電力產業改革,擴大該地區的商業機會。
亞太地區是經濟成長的主要驅動力,預計2031年將維持35.53%的複合年成長率。中國的「中國製造2025」、印度的「數位印度」計畫以及日本的「社會5.0」政策都在推動智慧基礎建設,而智慧基礎建設本身就需要進行性能基準測試。 IBM的研究表明,該地區的企業對人工智慧投資的回報週期充滿信心,亞洲開發銀行也證實了該地區寬頻普及率的提高,足以支持物聯網遙測技術的應用。然而,目前人工智慧的應用主要集中在大型企業和國有項目,中小企業因缺乏資金和專業知識而落後於其他企業。
在歐洲,獎勵已證實減排排放的永續性立法正在推動「照明即服務」、虛擬電廠和其他以脫碳為中心的服務的普及。然而,管理體制的差異正在減緩跨國擴張。相較之下,南美、中東和非洲仍處於發展階段,基於績效的合約主要限於捐助方資助的基礎設施和跨國公司的部署。如果沒有更強力的執行機制和標準化數據,這些地區在可預見的未來將落後於經合組織成員國。
其他好處:
- Excel格式的市場預測(ME)表
- 3個月的分析師支持
目錄
第1章:引言
- 研究假設和市場定義
- 調查範圍
第2章:調查方法
第3章執行摘要
第4章 市場狀況
- 市場概覽
- 市場促進因素
- 對基於績效的經營模式的需求日益成長
- 加速企業採用人工智慧和進階分析平台
- 各行各業的消費者心態都在向優先考慮營運成本的方向轉變。
- 包含碳減排關鍵績效指標的ESG掛鉤績效合約
- 公共部門強制要求將IT支出與績效指標連結。
- 透過保險實現履約擔保的出現降低了買方的風險。
- 市場限制因素
- 定義和歸因可衡量結果的難度
- 服務供應商面臨的合約和法律風險日益增加
- 人工智慧運算成本的下降正在削弱基於績效定價的單位經濟效益。
- 新興經濟體缺乏標準化的結果數據
- 宏觀經濟因素對市場的影響
- 產業價值鏈分析
- 監理情勢
- 技術展望
- 波特五力分析
第5章 市場規模與成長預測
- 按服務類型
- 諮詢服務
- 實施與整合
- 管理結果服務
- 支援和最佳化
- 定價模式
- 基於訂閱
- 基於績效
- 收益佔有率
- 混合
- 透過技術
- 人工智慧和分析平台
- 物聯網和感測器網路
- 雲端和邊緣基礎設施
- 數位雙胞胎與仿真
- 透過使用
- 醫療保健和生命科學
- 製造業和工業
- BFSI
- 零售與電子商務
- 能源公用事業
- 按地區
- 北美洲
- 美國
- 加拿大
- 墨西哥
- 南美洲
- 巴西
- 阿根廷
- 其他南美國家
- 歐洲
- 英國
- 德國
- 法國
- 義大利
- 西班牙
- 其他歐洲國家
- 亞太地區
- 中國
- 日本
- 印度
- 韓國
- 其他亞太國家
- 中東和非洲
- 中東
- 阿拉伯聯合大公國
- 沙烏地阿拉伯
- 其他中東國家
- 非洲
- 南非
- 埃及
- 其他非洲國家
- 中東
- 北美洲
第6章 競爭情勢
- 市場集中度
- 策略趨勢
- 市佔率分析
- 公司簡介
- Rolls-Royce plc
- Signify NV
- Kaeser Kompressoren SE
- Schneider Electric SE
- Siemens AG
- Caterpillar Inc.
- Alstom SA
- GE Digital LLC
- Deere and Company
- Compagnie Generale des Etablissements Michelin SCA
- Bombardier Inc.
- Tacton Systems AB
- Viridien Group Limited
- Outcome Referrals Inc.
- ServiceMax Inc.
- Darktrace plc
- Omada Health Inc.
- Zipline International Inc.
- Indigo Ag Inc.
- DataRobot Inc.
第7章 市場機會與未來展望
According to Mordor Intelligence, the outcome-as-a-Service software market size is projected to expand from USD 2.74 billion in 2025 and USD 3.61 billion in 2026 to USD 15.91 billion by 2031, registering a CAGR of 34.53% over 2026-2031.
This report is Segmented by Service Type (Advisory and Consulting, Implementation and Integration, and More), Pricing Model (Subscription-Based, Performance-Based, Gainshare, and Hybrid), Technology (AI and Analytics Platforms, Iot and Sensor Networks, and More), Application (Healthcare and Life Sciences, and More), and Geography. The Market Forecasts are Provided in Terms of Value (USD).
Global Outcome-as-a-Service Software Market Trends and Insights
Growing Demand for Pay-per-Outcome Commercial Models
Enterprises exhausted with billable-hour and parts-replacement contracts increasingly insist on fee structures pegged to uptime, throughput, or revenue uplift. Rolls-Royce's TotalCare program generated more than half of the firm's civil aerospace services revenue in 2025 by tying engine fees to flight hours, proving that predictable operating costs outweigh ownership for airlines. Similar mechanics underpin Michelin's pay-per-mile tire deals that delivered 5.9% fuel savings and 8% downtime reduction across 600,000 fleet vehicles in 2025. Warehouse-automation specialist Advanced Intralogistics bills clients on throughput velocity, aligning incentives with productivity gains. Outcome-aligned pricing boosts vendor lifetime value but requires robust telemetry and contractual clarity to avoid disputes.
Accelerated Enterprise Adoption of AI and Advanced Analytics Platforms
Predictive algorithms that flag failures 30-90 days in advance transform performance guarantees from speculative bets into data-driven commitments. C3 AI's Reliability application predicts equipment issues with 92% accuracy, allowing service providers to promise 98% availability without stockpiling spares. UptimeAI cut unplanned industrial downtime by 30% in 2025, enabling tighter service-level thresholds. IBM Maximo processed more than 1 billion sensor readings per day in 2025, serving as the analytical backbone for outcome contracts in utilities and heavy industry. As AI toolkits mature, vendors can price risk more precisely, encouraging broader adoption of performance-tied deals.
Difficulty in Defining and Attributing Measurable Outcomes
Outcome contracts often unravel when several suppliers influence the same metric, leading to disputes that stall payments. An academic study of 47 initiatives found that 38% failed to meet targets, with attribution issues driving 62% of renegotiations. GE Digital's Predix roll-out faltered once clients struggled to isolate platform gains from unrelated process tweaks. In healthcare, the Centers for Medicare and Medicaid Services canceled a value-based insurance pilot after multibillion-dollar costs could not be tied to patient outcomes. Until standardized measurement protocols emerge, vendors will prefer single-party environments where causality is clearer.
Other drivers and restraints analyzed in the detailed report include:
- Shift Toward Opex-Driven Consumption Preferences Across Industries
- ESG-Linked Outcome Contracts Incorporating Carbon-Reduction KPIs
- Heightened Contractual and Legal Exposure for Service Providers
For complete list of drivers and restraints, kindly check the Table Of Contents.
Segment Analysis
Managed outcome services accounted for 44.43% of 2025 revenue, underscoring client appetite for one-vendor accountability across complex asset fleets. The Outcome-as-a-Service software market size for managed offerings is expanding as incumbents leverage decades of operational data to guarantee uptime, efficiency, and compliance. Schneider Electric's EcoStruxure Foresight Operation, commercially released in Q3 2026, bundles 24/7 monitoring with predictive maintenance and promises a 75% reduction in failure risk, cementing the vendor's managed-service positioning.
Support and optimization services are forecast to grow at 34.89% annually to 2031 as installed bases mature, and buyers pursue incremental gains without disrupting current workflows. GE Digital's long-term agreements with renewable operator Invenergy exemplify post-deployment tuning that squeezes extra output from connected assets. Advisory work retains relevance for firms new to outcome economics, while implementation margins narrow as deployment processes standardize. The widening footprint of optimization deals signals sticky, high-margin recurring revenue for suppliers that command proprietary performance data, raising switching costs and deepening vendor entrenchment within the Outcome-as-a-Service software market.
Subscription structures captured 52.78% of revenue in 2025 because finance teams prefer budget certainty and minimal variance. These contracts anchor the Outcome-as-a-Service software market share for vendors that bundle hardware, software, and basic support into a flat monthly fee. That said, performance-based terms are rising at a 35.32% CAGR, propelled by demand for vendor-aligned incentives. Michelin's pay-per-mile framework, which prices tires by distance traveled, illustrates how usage metrics can replace upfront capital outlays.
Hybrid constructs now blend a base subscription with upside or downside adjustments, marrying cash-flow predictability to outcome accountability. Afni's gainshare deals, where the service provider takes 20-25% of verified cost savings, spotlight this compromise. As AI cuts variance in delivered results, vendors can bid aggressively on outcome components without jeopardizing profitability, reinforcing subscription retention while expanding risk-sharing economics across the Outcome-as-a-Service software market.
Geography Analysis
North America combines mature legal frameworks, rich analytics talent, and aggressive public-sector adoption to anchor 34.09% of 2025 revenue. The GSA's Outcome-Based Contracting Center of Excellence and the Centers for Medicare and Medicaid Services' expansion of accountable care programs institutionalize results-driven procurement, encouraging vendors to absorb performance risk in exchange for premium pricing. Canada is piloting performance-tied infrastructure concessions, and Mexico is embedding outcome metrics into power-sector reforms, broadening regional opportunity.
Asia-Pacific is the growth engine, with a 35.53% CAGR projected through 2031. China's Made in China 2025, India's Digital India initiative, and Japan's Society 5.0 policies mandate smart infrastructure that inherently requires outcome benchmarking. Regional enterprises exhibit high confidence in AI payback horizons, as shown by IBM research, and the Asian Development Bank confirms widespread broadband penetration that supports IoT telemetry. Nonetheless, adoption skews toward big enterprises and state-owned projects, while small businesses lag due to limited capital and expertise.
Europe benefits from sustainability statutes that reward verified emissions cuts, propelling light-as-a-service, virtual power plants, and other decarbonization-centric offerings. However, heterogeneous regulatory regimes slow cross-border scaling. In contrast, South America, the Middle East, and Africa remain nascent, with outcome contracts largely confined to donor-funded infrastructure or multinational rollouts. Absent stronger enforcement and standardized data, these regions will trail OECD peers for the foreseeable future.
- Rolls-Royce plc
- Signify N.V.
- Kaeser Kompressoren SE
- Schneider Electric SE
- Siemens AG
- Caterpillar Inc.
- Alstom SA
- GE Digital LLC
- Deere and Company
- Compagnie Generale des Etablissements Michelin SCA
- Bombardier Inc.
- Tacton Systems AB
- Viridien Group Limited
- Outcome Referrals Inc.
- ServiceMax Inc.
- Darktrace plc
- Omada Health Inc.
- Zipline International Inc.
- Indigo Ag Inc.
- DataRobot Inc.
Additional Benefits:
- The market estimate (ME) sheet in Excel format
- 3 months of analyst support
TABLE OF CONTENTS
1 INTRODUCTION
- 1.1 Study Assumptions and Market Definition
- 1.2 Scope of the Study
2 RESEARCH METHODOLOGY
3 EXECUTIVE SUMMARY
4 MARKET LANDSCAPE
- 4.1 Market Overview
- 4.2 Market Drivers
- 4.2.1 Growing Demand for Pay-per-Outcome Commercial Models
- 4.2.2 Accelerated Enterprise Adoption of AI and Advanced Analytics Platforms
- 4.2.3 Shift Toward Opex-Driven Consumption Preferences Across Industries
- 4.2.4 ESG-Linked Outcome Contracts Incorporating Carbon-Reduction KPIs
- 4.2.5 Public-Sector Mandates to Tie IT Spending to Performance Benchmarks
- 4.2.6 Emergence of Insurance-Backed Outcome Guarantees Reducing Buyer Risk
- 4.3 Market Restraints
- 4.3.1 Difficulty in Defining and Attributing Measurable Outcomes
- 4.3.2 Heightened Contractual and Legal Exposure for Service Providers
- 4.3.3 Falling AI Compute Costs Undermining Outcome-Pricing Unit Economics
- 4.3.4 Scarcity of Standardized Outcome Data in Emerging Economies
- 4.4 Impact of Macroeconomic Factors on the Market
- 4.5 Industry Value Chain Analysis
- 4.6 Regulatory Landscape
- 4.7 Technological Outlook
- 4.8 Porter's Five Forces Analysis
- 4.8.1 Bargaining Power of Suppliers
- 4.8.2 Bargaining Power of Buyers
- 4.8.3 Threat of New Entrants
- 4.8.4 Threat of Substitutes
- 4.8.5 Intensity of Competitive Rivalry
5 MARKET SIZE AND GROWTH FORECASTS (VALUE)
- 5.1 By Service Type
- 5.1.1 Advisory and Consulting
- 5.1.2 Implementation and Integration
- 5.1.3 Managed Outcome Services
- 5.1.4 Support and Optimization
- 5.2 By Pricing Model
- 5.2.1 Subscription-Based
- 5.2.2 Performance-Based
- 5.2.3 Gainshare
- 5.2.4 Hybrid
- 5.3 By Technology
- 5.3.1 AI and Analytics Platforms
- 5.3.2 IoT and Sensor Networks
- 5.3.3 Cloud and Edge Infrastructure
- 5.3.4 Digital Twin and Simulation
- 5.4 By Application
- 5.4.1 Healthcare and Life Sciences
- 5.4.2 Manufacturing and Industrial
- 5.4.3 BFSI
- 5.4.4 Retail and E-Commerce
- 5.4.5 Energy and Utilities
- 5.5 By Geography
- 5.5.1 North America
- 5.5.1.1 United States
- 5.5.1.2 Canada
- 5.5.1.3 Mexico
- 5.5.2 South America
- 5.5.2.1 Brazil
- 5.5.2.2 Argentina
- 5.5.2.3 Rest of South America
- 5.5.3 Europe
- 5.5.3.1 United Kingdom
- 5.5.3.2 Germany
- 5.5.3.3 France
- 5.5.3.4 Italy
- 5.5.3.5 Spain
- 5.5.3.6 Rest of Europe
- 5.5.4 Asia-Pacific
- 5.5.4.1 China
- 5.5.4.2 Japan
- 5.5.4.3 India
- 5.5.4.4 South Korea
- 5.5.4.5 Rest of Asia-Pacific
- 5.5.5 Middle East and Africa
- 5.5.5.1 Middle East
- 5.5.5.1.1 United Arab Emirates
- 5.5.5.1.2 Saudi Arabia
- 5.5.5.1.3 Rest of Middle East
- 5.5.5.2 Africa
- 5.5.5.2.1 South Africa
- 5.5.5.2.2 Egypt
- 5.5.5.2.3 Rest of Africa
- 5.5.5.1 Middle East
- 5.5.1 North America
6 COMPETITIVE LANDSCAPE
- 6.1 Market Concentration
- 6.2 Strategic Moves
- 6.3 Market Share Analysis
- 6.4 Company Profiles (includes Global Level Overview, Market Level Overview, Core Segments, Financials as available, Strategic Information, Market Rank/Share, Products and Services, Recent Developments)
- 6.4.1 Rolls-Royce plc
- 6.4.2 Signify N.V.
- 6.4.3 Kaeser Kompressoren SE
- 6.4.4 Schneider Electric SE
- 6.4.5 Siemens AG
- 6.4.6 Caterpillar Inc.
- 6.4.7 Alstom SA
- 6.4.8 GE Digital LLC
- 6.4.9 Deere and Company
- 6.4.10 Compagnie Generale des Etablissements Michelin SCA
- 6.4.11 Bombardier Inc.
- 6.4.12 Tacton Systems AB
- 6.4.13 Viridien Group Limited
- 6.4.14 Outcome Referrals Inc.
- 6.4.15 ServiceMax Inc.
- 6.4.16 Darktrace plc
- 6.4.17 Omada Health Inc.
- 6.4.18 Zipline International Inc.
- 6.4.19 Indigo Ag Inc.
- 6.4.20 DataRobot Inc.
7 MARKET OPPORTUNITIES AND FUTURE OUTLOOK
- 7.1 White-Space and Unmet-Need Assessment

 企業系統整合服務:10家通訊業者的案例研究與分析
 企業軟體市場預測至2034年-按組件、部署模式、組織規模、軟體類型、最終用戶和地區分類的全球分析
 企業軟體市場:依產品、平台、功能、部署模式、企業規模及最終用戶分類-2026-2032年全球市場預測
 企業社交軟體:市場佔有率分析、產業趨勢與統計及成長預測(2026-2031)
 企業軟體市場規模、佔有率和趨勢分析報告:按軟體、部署類型、企業規模、應用、地區和細分市場預測(2026-2033 年)企業社交軟體市場:按組件、部署模式、組織規模和產業分類-2026-2032年全球市場預測
 2026-2030年全球企業軟體市場多企業協作網路市場:產業垂直領域、市場部署模式、公司規模、應用、最終用戶功能、服務類型與技術-全球預測,2026-2032年
 企業軟體市場-全球產業規模、佔有率、趨勢、機會和預測,按部署模式、服務類型、最終用戶產業、地區和競爭格局細分,2021-2031年預測
 企業軟體市場規模、佔有率和成長分析(按部署類型、軟體、最終用途和地區分類)-2026-2033年產業預測