


 |
市場調查報告書
商品編碼
2063382
紡織品:市場佔有率分析、產業趨勢與統計、成長預測(2026-2031)Textile - Market Share Analysis, Industry Trends & Statistics, Growth Forecasts (2026 - 2031) |
||||||
※ 本網頁內容可能與最新版本有所差異。詳細情況請與我們聯繫。
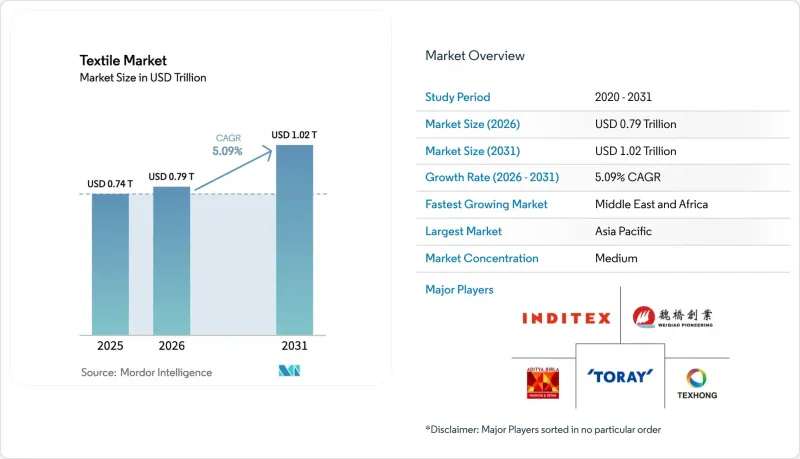
根據 Mordor Intelligence 預測,紡織品市場規模將從 2025 年的 7,400 億美元和 2026 年的 7,900 億美元成長到 2031 年的 1.02 兆美元,2026 年至 2031 年的年複合成長率(CAGR)為 5.09%。
本報告按應用領域(時裝、工業和技術紡織品、家用家用紡織品及其他)、原料(天然纖維(棉、羊毛及其他)、合成纖維(聚酯纖維、尼龍及其他)、其他)、製造程序技術(機織、針織、不織布及其他)和地區(北美、亞太及其他)進行細分。市場預測以美元計價。
全球紡織品市場趨勢與洞察
歐盟的數位產品護照加速了對可追溯性技術的投資
歐盟的「數位產品護照」規定,到2027年,所有在歐盟境內銷售的紡織品都必須包含機器可讀的產地、成分和處置通路資料。預計這將使歐洲紡織品製造商在軟體和硬體方面的總合支出達到14.5億美元。孟加拉和越南的出口商也正在進行類似的升級,以維持其在歐盟市場的准入。這項標準正逐漸成為全球標準。企業軟體供應商之間互通性的差距可能會增加小規模紡紗廠的轉換成本,並導致小規模企業之間的整合。檢驗的成分數據也將有助於開發再生原料市場,並提高回收的經濟效益。隨著先導計畫的成熟,品牌預計供應商審核週期將縮短20%,從而釋放出可用於設計和行銷的營運資金。
《維吾爾族強迫勞動預防法》(UFLPA)正在推動轉向採購經認證的非新疆棉花。
美國對《統一纖維和纖維保護法》(UFLPA)的嚴格執行,導致2022年至2025年間,中國對美國的棉花產品進口量下降了20%。因此,訂單正轉向印度和越南。穩定同位素分析技術正迅速普及,預計2024年實驗室將處理超過1萬個樣品,從而為可靠的原產地證書提供支援。 2024年,印度紡紗企業來自美國的訂單成長了35%,顯示合規要求正在改變全球流通結構。零售商現在將採購價格的2%至4%用於文件成本,這種利潤壓力正在加速數位化溯源技術的應用。合約路線的轉變正在穩定替代產地國家的農村收入,並鞏固對經認證的永續棉花的長期需求。
紅海航線的中斷推高了從亞洲到歐盟貿易航線的運費。
繞過好望角的航線調整導致運輸時間延長了10-14天,每25個標準貨櫃(FEU)的訂單額外成本高達10萬美元。這延長了營運資金周轉週期,迫使企業加快下單速度,削弱了快時尚產業的快速應對力。儘管現貨運費已下調至2025年中期,但貨運代理商仍在價格中加入了風險溢價。近岸外包正在加速發展。土耳其和摩洛哥的工廠能夠在一週內交貨,即使離岸價(FOB)高出10%以上,它們的市佔率也不斷擴大。各大品牌正在重新審視離岸價條款,並探索雙源策略以避免航線風險。
細分市場分析
預計到2025年,時尚服飾將佔紡織業需求的56.06%,凸顯了消費者主導紡織業的地位。然而,工業和技術紡織品正以6.15%的複合年成長率成長,是所有應用領域中成長最快的,這主要得益於汽車、醫療和建築項目對性能標準的更高要求,其重要性超過了美觀因素。受電動車輕量化需求的推動,用於汽車安全氣囊、安全帶和內裝的布料目前享有30%的溢價。醫療一次性用品維持兩位數成長,這得益於人口老化和完善的感染控制標準。由於能源和公共產業領域對阻燃標準的日益嚴格,防護工作服的銷量正在成長;而運動布料的創新者透過整合相變材料,每件服裝的溢價高達10美元。
汽車輕量化技術正在擴大高強度聚酯紗線在紡織業的市場佔有率,而醫院的需求則推動了不織布罩衣和手術鋪巾的生產。由於產品更換週期的成熟,家紡家用紡織品正經歷3%至4%的溫和成長。在運動性能布料這一細分市場,品牌透過利用吸濕排汗和溫度調節功能來維持其高階定價。在永續發展壓力日益增大的背景下,品牌將美觀性與經認證的功能性相結合,鞏固了技術布料作為紡織業結構性成長引擎的地位。
區域分析
預計到2025年,亞太地區將佔全球紡織品產量的54.06%,這主要得益於中國一體化叢集縮短了前置作業時間以及孟加拉較低的人事費用。越南預計將根據《美國紡織品進口限制法案》(UFLPA)獲得來自美國的訂單,預計2025年上半年出口額將年增18%。同時,印度的生產連結獎勵計畫計畫預計將推動紡織品出貨量成長9%,從而增強其作為「中國+1」目的地的吸引力。中東和非洲是成長最快的地區,預計複合年成長率將達到5.80%,這主要得益於埃及與歐盟之間的貿易優惠政策以及沙烏地阿拉伯13.2億美元的聚酯投資,該投資將其石化價值鏈擴展到了紡織品領域。
歐洲的需求量佔全球近五分之一,但碳邊境調節機制(CBAM)推高了高碳排放亞洲產品的進口成本,促使市場轉向高附加價值技術紡織品。德國和義大利的紡織製造商正將研發重點放在醫療和汽車布料上,即使大眾服裝生產設施正在轉移,他們也能維持強勁的利潤率。北美正受益於不織布和功能性纖維的回流浪潮,吸引了美國東南部4億美元的產能擴張項目,該項目優先考慮供應鏈的韌性。以巴西和秘魯為首的南美洲保持著3-4%的穩定成長,但仍受到物流瓶頸和飆升的運輸成本的限制。
土耳其和摩洛哥正利用紅海航線中斷的機會,將貨物送達歐洲物流中心的時間縮短至5-7天。南非紡織品製造商正藉助非洲大陸自由貿易協定(AfCFTA)向奈及利亞和肯亞銷售產品,扭轉了長達十年的進口依賴局面。預計到2031年,能源成本差異和歐盟可追溯性法規的合規性將繼續重塑紡織業的地域格局。
其他好處
- Excel格式的市場預測(ME)表
- 3個月的分析師支持
目錄
第1章:引言
- 研究假設和市場定義
- 調查範圍
第2章:調查方法
第3章執行摘要
第4章 市場狀況
- 市場概覽
- 市場促進因素
- 歐盟數位產品護照正在加速對可追溯性技術的投資。
- 採購方式轉向採購符合《維吾爾族強迫勞動預防法》(UFLPA)規定的經認證的非新疆棉花。
- 將歐洲先導工廠生產的生物基PEF聚酯擴大到商業工廠規模。
- 排碳權貨幣化計畫正在提高再生纖維的盈利。
- 透過人工智慧驅動的按需生產,減少庫存損失並實現小批量生產。
- 對具有抗病原體的室內環境的需求不斷成長,導致對防護性和抗病毒紡織品的需求激增。
- 市場限制因素
- 不斷上漲的可再生能源附加費增加了高耗能紡織廠的電力成本。
- 對微塑膠排放的更嚴格規定增加了合成材料領域的研發支出和合規相關費用。
- 紅海航運路線中斷導致從亞洲到歐盟的紡織品貿易路線運費上漲。
- 對「永恆化學物質」PFAS的禁令迫使高性能整理加工劑的配方進行代價高昂的改變。
- 產業價值鏈分析
- 監理展望
- 技術展望
- 波特五力分析
- 地緣政治對紡織品市場的影響
第5章 市場規模與成長預測
- 透過使用
- 時尚服飾
- 工業和技術用紡織品
- 家用及家用紡織品
- 用於醫療保健領域的紡織品
- 汽車和運輸紡織品
- 其他用途(防護用紡織品、運動紡織品等)
- 按原料
- 天然纖維
- 棉布
- 羊毛
- 絲綢
- 合成纖維
- 聚酯纖維
- 尼龍
- 人造絲/粘膠纖維
- 丙烯酸纖維
- 聚丙烯
- 再生纖維
- 其他原料(特殊高性能纖維(芳香聚醯胺、碳纖維、超高分子量聚乙烯))
- 天然纖維
- 透過製造程序技術
- 織物
- 針織
- 不織布
- 紡絲成網(紡粘/熔噴)
- 乾式水力纏繞
- 濕貨交易
- 針刺機
- 3D編織織物和間隔織物
- 按地區
- 北美洲
- 美國
- 加拿大
- 墨西哥
- 南美洲
- 巴西
- 阿根廷
- 秘魯
- 其他南美國家
- 歐洲
- 英國
- 德國
- 法國
- 義大利
- 西班牙
- 比荷盧經濟聯盟(比利時、荷蘭、盧森堡)
- 北歐國家(丹麥、芬蘭、冰島、挪威、瑞典)
- 其他歐洲國家
- 亞太地區
- 中國
- 印度
- 日本
- 澳洲
- 韓國
- 東協(印尼、泰國、菲律賓、馬來西亞、越南)
- 其他亞太國家
- 中東和非洲
- 沙烏地阿拉伯
- 阿拉伯聯合大公國
- 卡達
- 科威特
- 土耳其
- 埃及
- 南非
- 奈及利亞
- 其他中東和非洲國家
- 北美洲
第6章 競爭情勢
- 市場集中度
- 策略趨勢
- 市佔率分析
- 公司簡介
- Toray Industries Inc.
- Weiqiao Pioneering Group Co. Ltd.
- Texhong Textile Group Ltd.
- Inditex SA
- Aditya Birla Fashion & Retail Ltd.
- Hyosung TNC Corp.
- Far Eastern New Century Corp.
- PVH Corp.
- Nisshinbo Holdings Inc.
- Arvind Ltd.
- Chori Co. Ltd.
- DuPont de Nemours Inc.
- Freudenberg Group
- Berry Global Group Inc.
- Lenzing AG
- Reliance Industries Ltd.(RIL)
- Shandong Ruyi Technology Group
- Low & Bonar PLC
- Kimberly-Clark Corp.
第7章 市場機會與未來展望
According to Mordor Intelligence, the textile market size is projected to expand from USD 0.74 trillion in 2025 and USD 0.79 trillion in 2026 to USD 1.02 trillion by 2031, registering a CAGR of 5.09% between 2026 to 2031.
This report is Segmented by Application (Fashion and Apparel, Industrial/Technical Textiles, Household and Home Textiles and More), Raw Material (Natural Fibers (Cotton, Wool, and More), Synthetic Fibers (Polyester, Nylon, and More), and More), Process/Technology (Woven, Knitted, Non-Woven, and More), and Geography (North America, Asia-Pacific, and More). The Market Forecasts are Provided in Terms of Value (USD).
Global Textile Market Trends and Insights
EU Digital Product Passport Accelerating Traceability Technology Investments
The EU Digital Product Passport requires every textile sold in the bloc to carry machine-readable data on origin, composition, and end-of-life pathways by 2027, spurring USD 1.45 billion in combined software and hardware spend among European mills. Bangladeshi and Vietnamese exporters are mirroring the upgrades to keep EU access, effectively globalizing the standard. Interoperability gaps between enterprise software vendors raise switching costs for small mills and could trigger consolidation among sub-scale operators. Verified composition data also unlocks secondary-raw-material marketplaces, bolstering recycling economics. As pilot projects mature, brands anticipate 20% faster supplier-auditing cycles, freeing working capital for design and marketing.
Uyghur Forced Labor Prevention Act Shifting Sourcing Toward Certified Non-Xinjiang Cotton
Aggressive enforcement of the UFLPA led to a 20% drop in U.S. cotton-apparel imports from China between 2022 and 2025, diverting orders to India and Vietnam. Stable-isotope testing has scaled quickly, with laboratories processing more than 10,000 samples in 2024, underpinning credible provenance claims. Indian spinners handled a 35% hike in U.S. orders during 2024, demonstrating how compliance mandates reshape global flows. Retailers now budget 2% - 4% of landed cost for documentation, a margin drag that accelerates digital-traceability adoption. The re-routing of contracts stabilizes rural incomes in alternative sourcing nations and cements long-run demand for certified sustainable cotton.
Red Sea Shipping Disruptions Inflating Freight Costs for Asia-to-EU Trade Lanes
Rerouting around the Cape of Good Hope adds 10-14 days transit and up to USD 100,000 per 25-FEU order. Working-capital cycles lengthen, forcing earlier order placement and eroding fast-fashion responsiveness. Spot rates eased mid-2025, but forwarders price a persistent risk premium. Near-shoring gains momentum; Turkish and Moroccan mills that deliver within a week pick up share, even at 10%-plus higher FOB prices. Brands re-evaluate free-on-board terms, seeking dual-source strategies to hedge corridor risk.
Other drivers and restraints analyzed in the detailed report include:
- AI-driven on-demand manufacturing reducing inventory waste
- Carbon-Credit Monetization Programs Boosting Recycled-Fiber Profitability
- Escalating Renewable-Energy Surcharges Raising Electricity Costs
For complete list of drivers and restraints, kindly check the Table Of Contents.
Segment Analysis
Fashion & Apparel commanded 56.06% of the 2025 demand, underscoring consumer dominance within the textile industry. Yet Industrial/Technical Textiles are growing at a 6.15% CAGR, the fastest pace across applications, as performance criteria in automotive, medical, and construction projects trump aesthetic drivers. Automotive airbag, seatbelt, and interior-trim fabrics now fetch 30% price premiums, supported by electric-vehicle lightweighting targets. Medical disposables maintain double-digit growth, buoyed by aging populations and entrenched infection-control standards. Protective workwear sales rise on stricter flame-resistance codes in energy and utilities, while sports fabric innovators integrate phase-change materials to command USD 10 premiums per garment.
Automotive lightweighting extends the textile industry share for high-tenacity polyester yarns, and hospital demand anchors volumes in non-woven gowns and drapes. Household & Home textiles grow modestly at 3%-4%, limited by mature replacement cycles. Sports-performance niches exploit moisture management and thermoregulation to sustain premium pricing. As sustainability pressure mounts, brands blend aesthetic appeal with certified functionality, solidifying technical segments as a structural growth engine for the textile industry.
Geography Analysis
Asia-Pacific retained 54.06% of 2025 output, anchored by integrated Chinese clusters that compress lead times and by Bangladesh's low labor costs. Vietnam captured diverted U.S. orders under the UFLPA, posting 18% year-on-year export growth in H1 2025, while India's Production-Linked Incentive scheme drove a 9% climb in textile shipments, reinforcing its China-plus-one appeal. The Middle East & Africa is the fastest-growing region at a 5.80% CAGR, propelled by Egypt's EU trade perks and Saudi Arabia's USD 1.32 billion polyester investments that extend petrochemical value chains into fiber.
Europe, representing almost one-fifth of demand, pivots to high-value technical textiles as the Carbon Border Adjustment Mechanism raises import costs for carbon-heavy Asian products. German and Italian mills channel R&D into medical and automotive fabrics, capturing resilient margins even as mass-market apparel relocates. North America rides a reshoring wave in non-wovens and technical fabrics, with southeastern U.S. states attracting USD 400 million in capacity expansions that prioritize supply-chain resilience. South America, led by Brazil and Peru, posts steady 3%-4% gains but remains hindered by logistics bottlenecks that inflate delivered costs.
Turkey and Morocco benefit from Red Sea shipping disruptions, offering 5-to-7-day delivery windows into European DCs. South African mills leverage the AfCFTA to sell into Nigeria and Kenya, reversing a decade-long import tide. Energy-cost differentials and regulatory alignment with EU traceability rules will continue to re-order the geography of the textile industry through 2031.
- Toray Industries Inc.
- Weiqiao Pioneering Group Co. Ltd.
- Texhong Textile Group Ltd.
- Inditex S.A.
- Aditya Birla Fashion & Retail Ltd.
- Hyosung TNC Corp.
- Far Eastern New Century Corp.
- PVH Corp.
- Nisshinbo Holdings Inc.
- Arvind Ltd.
- Chori Co. Ltd.
- DuPont de Nemours Inc.
- Freudenberg Group
- Berry Global Group Inc.
- Lenzing AG
- Reliance Industries Ltd. (RIL)
- Shandong Ruyi Technology Group
- Low & Bonar PLC
- Kimberly-Clark Corp.
Additional Benefits:
- The market estimate (ME) sheet in Excel format
- 3 months of analyst support
TABLE OF CONTENTS
1 INTRODUCTION
- 1.1 Study Assumptions & Market Definition
- 1.2 Scope of the Study
2 RESEARCH METHODOLOGY
3 EXECUTIVE SUMMARY
4 MARKET LANDSCAPE
- 4.1 Market Overview
- 4.2 Market Drivers
- 4.2.1 EU Digital Product Passport accelerating traceability technology investments
- 4.2.2 Uyghur Forced Labor Prevention Act (UFLPA) shifting sourcing toward certified non-Xinjiang cotton
- 4.2.3 Bio-based PEF polyester scaling from European pilot to commercial plants
- 4.2.4 Carbon-credit monetization programs boosting recycled-fibre profitability
- 4.2.5 AI-driven on-demand manufacturing reducing inventory waste and enabling micro-batch runs
- 4.2.6 Protective & antiviral textiles demand surge for pathogen-resilient indoor environments
- 4.3 Market Restraints
- 4.3.1 Escalating renewable-energy surcharges raising electricity costs for energy-intensive spinning mills
- 4.3.2 Tightening micro-plastic shedding regulations increasing R&D and compliance spend for synthetics
- 4.3.3 Red Sea shipping disruptions inflating freight costs for Asia-to-EU textile trade lanes
- 4.3.4 PFAS "forever-chemicals" bans forcing costly reformulation of performance finishes
- 4.4 Industry Value Chain Analysis
- 4.5 Regulatory Outlook
- 4.6 Technological Outlook
- 4.7 Porter's Five Forces Analysis
- 4.7.1 Bargaining Power of Buyers
- 4.7.2 Bargaining Power of Suppliers
- 4.7.3 Threat of New Entrants
- 4.7.4 Threat of Substitutes
- 4.7.5 Competitive Rivalry
- 4.8 Impact of Geopolitics on Textile Market
5 MARKET SIZE AND GROWTH FORECASTS (VALUE)
- 5.1 By Application
- 5.1.1 Fashion and Apparel
- 5.1.2 Industrial/Technical Textiles
- 5.1.3 Household and Home Textiles
- 5.1.4 Medical and Healthcare Textiles
- 5.1.5 Automotive and Transport Textiles
- 5.1.6 Other Applications (Protective, Sports Textiles, etc.)
- 5.2 By Raw Material
- 5.2.1 Natural Fibers
- 5.2.1.1 Cotton
- 5.2.1.2 Wool
- 5.2.1.3 Silk
- 5.2.2 Synthetic Fibers
- 5.2.2.1 Polyester
- 5.2.2.2 Nylon
- 5.2.2.3 Rayon / Viscose
- 5.2.2.4 Acrylic
- 5.2.2.5 Polypropylene
- 5.2.3 Recycled Fibers
- 5.2.4 Other Raw Materials (Speciality High-Performance Fibers (Aramid, Carbon, UHMWPE))
- 5.2.1 Natural Fibers
- 5.3 By Process / Technology
- 5.3.1 Woven
- 5.3.2 Knitted
- 5.3.3 Non-woven
- 5.3.3.1 Spunlaid (Spunbond / Melt-blown)
- 5.3.3.2 Dry-laid Hydro-entangled
- 5.3.3.3 Wet-Laid
- 5.3.3.4 Needle-punched
- 5.3.4 3-D Weaving and Spacer Fabrics
- 5.4 By Geography
- 5.4.1 North America
- 5.4.1.1 United States
- 5.4.1.2 Canada
- 5.4.1.3 Mexico
- 5.4.2 South America
- 5.4.2.1 Brazil
- 5.4.2.2 Argentina
- 5.4.2.3 Peru
- 5.4.2.4 Rest of South America
- 5.4.3 Europe
- 5.4.3.1 United Kingdom
- 5.4.3.2 Germany
- 5.4.3.3 France
- 5.4.3.4 Italy
- 5.4.3.5 Spain
- 5.4.3.6 BENELUX (Belgium, Netherlands, and Luxembourg)
- 5.4.3.7 NORDICS (Denmark, Finland, Iceland, Norway, and Sweden)
- 5.4.3.8 Rest of Europe
- 5.4.4 Asia-Pacific
- 5.4.4.1 China
- 5.4.4.2 India
- 5.4.4.3 Japan
- 5.4.4.4 Australia
- 5.4.4.5 South Korea
- 5.4.4.6 ASEAN (Indonesia, Thailand, Philippines, Malaysia, Vietnam)
- 5.4.4.7 Rest of Asia-Pacific
- 5.4.5 Middle East and Africa
- 5.4.5.1 Saudi Arabia
- 5.4.5.2 United Arab Emirates
- 5.4.5.3 Qatar
- 5.4.5.4 Kuwait
- 5.4.5.5 Turkey
- 5.4.5.6 Egypt
- 5.4.5.7 South Africa
- 5.4.5.8 Nigeria
- 5.4.5.9 Rest of Middle East and Africa
- 5.4.1 North America
6 COMPETITIVE LANDSCAPE
- 6.1 Market Concentration
- 6.2 Strategic Moves
- 6.3 Market Share Analysis
- 6.4 Company Profiles {(includes Global level Overview, Market level overview, Core Segments, Financials as available, Strategic Information, Products & Services, and Recent Developments)}
- 6.4.1 Toray Industries Inc.
- 6.4.2 Weiqiao Pioneering Group Co. Ltd.
- 6.4.3 Texhong Textile Group Ltd.
- 6.4.4 Inditex S.A.
- 6.4.5 Aditya Birla Fashion & Retail Ltd.
- 6.4.6 Hyosung TNC Corp.
- 6.4.7 Far Eastern New Century Corp.
- 6.4.8 PVH Corp.
- 6.4.9 Nisshinbo Holdings Inc.
- 6.4.10 Arvind Ltd.
- 6.4.11 Chori Co. Ltd.
- 6.4.12 DuPont de Nemours Inc.
- 6.4.13 Freudenberg Group
- 6.4.14 Berry Global Group Inc.
- 6.4.15 Lenzing AG
- 6.4.16 Reliance Industries Ltd. (RIL)
- 6.4.17 Shandong Ruyi Technology Group
- 6.4.18 Low & Bonar PLC
- 6.4.19 Kimberly-Clark Corp.
7 MARKET OPPORTUNITIES and FUTURE OUTLOOK
- 7.1 White-space & Unmet-Need Assessment
 綠色紡織品市場-全球產業規模、佔有率、趨勢、機會、預測:按類型、原料、應用、地區和競爭格局分類,2021-2031年
 防護紡織品市場:按類型、產品類型、最終用途和分銷管道分類 - 2026-2032年全球市場預測動物源性紡織品市場:2026-2032年全球市場按形態、產品類型、通路和應用分類的預測紡織品市場:按材料、應用和分銷管道分類-2026-2032年全球市場預測
 2026-2034年全球服飾市場規模、佔有率、趨勢和成長分析報告紗線、纖維和線材市場:按產品類型、原料、製造流程、撚度、應用、分銷通路和最終用途產業分類-全球預測,2026-2032年
 南美紡織品:市場佔有率分析、產業趨勢與統計、成長預測(2026-2031)
 紡織品市場分析及預測(至2035年):依類型、產品類型、技術、應用、材料類型、最終用戶、製程、組件及採用度分類亞太地區紡織品:市佔率分析、產業趨勢與統計、成長預測(2026-2031)紡織品市場規模、佔有率、成長及全球產業分析:按類型、應用和地區分類,並預測至2026-2034年