


 |
市場調查報告書
商品編碼
2063262
波浪能:市場佔有率分析、產業趨勢與統計、成長預測(2026-2031)Wave Energy - Market Share Analysis, Industry Trends & Statistics, Growth Forecasts (2026 - 2031) |
||||||
※ 本網頁內容可能與最新版本有所差異。詳細情況請與我們聯繫。
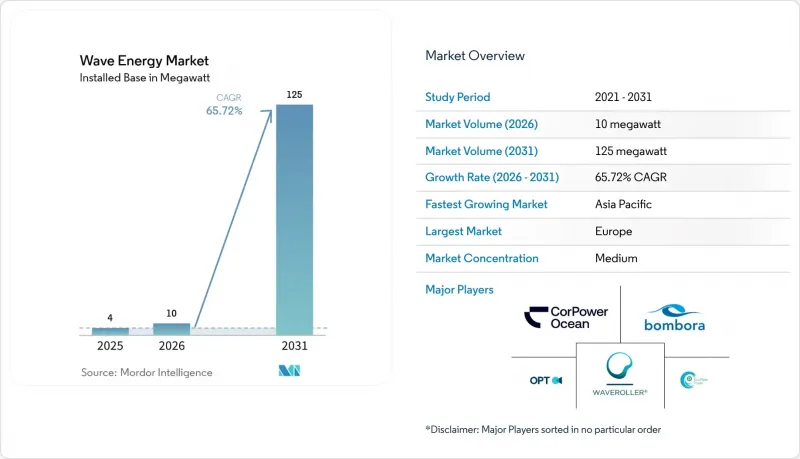
根據 Mordor Intelligence 預測,波浪能市場的裝置容量預計將在 2025 年達到 4 兆瓦,2026 年達到 10 兆瓦,到 2031 年達到 125 兆瓦。
預計從 2026 年到 2031 年,其複合年成長率將達到 65.72%。
本報告按類型(振盪水柱式及其他)、安裝地點(陸上、沿海、淺海、深海域)、應用(發電、海水淡化、環境保護及其他)和地區(北美、歐洲、亞太、南美、中東和非洲)進行分類。市場預測以容量(兆瓦)為單位。
全球波浪能市場趨勢與洞察
擴大歐盟和亞太地區的上網電價補貼(FIT)和差價合約(CfD)政策。
根據歐盟可再生能源指令III,成員國必須確保2025年至2030年間新增可再生能源裝置容量的5%來自創新能源,其中明確提及了波浪能技術。愛爾蘭的海洋能源計畫、「地平線歐洲」計畫的津貼以及台灣首個波浪能差價合約(CfD)正在為早期計畫創造可預測的收入來源,從而降低風險。這些獎勵正在縮短投資回收期,吸引創業投資,並推動波浪能市場從原型階段邁向商業化前叢集。印度和葡萄牙的開發商已經獲得了與早期離岸風電支援計畫類似的長期溢價收購價格。鑑於這些框架的成功,亞太地區的其他國家政府正在製定類似的扶持機制,從而擴大投資機會。
需要利用海洋能生產的基本負載可再生能源來平衡風能和太陽能發電。
目前,波浪能裝置的利用率已達25%至35%,最佳化後的預測顯示,利用率可望達到40%至48%,從而在太陽能和風能發電量較低時平衡電力供應。在夏威夷、加那利群島和金島等島嶼的電網中,波浪能陣列正被部署用於取代柴油發電,而無需依賴大規模電池儲能系統。美國聯邦政府的「波浪能製水獎」(Walves to Water Prize)等項目正在資助離網海水淡化浮標,這些浮標利用直接機械壓力而非電網電力進行發電。偏遠地區的採礦和水產養殖企業正在採用波浪能來降低燃料運輸成本並減少排放罰款。這些基本負載應用加在一起,正在擴大波浪能市場的基本客群,並加速其規模經濟效益的實現。
高額資本支出 (CAPEX) 以及與成熟可再生能源成本 (LCOE) 差距。
預計到2025年,波浪能的平準化電力成本(LCOE)將在388美元/兆瓦時至618美元/兆瓦時之間,是大型太陽能發電成本的3到6倍,這阻礙了私人投資。美國國家再生能源實驗室(NREL)的一項學習曲線研究表明,隨著吉瓦級規模的部署,到2050年成本預計將降至0.07美元/千瓦時至0.13美元/千瓦時。因此,早期採用者將不得不依賴超過351美元/兆瓦時的上網電價補貼或直接資本補貼。在新興市場,人們的支付意願低於0.10美元/千瓦時,這進一步擴大了資金籌措缺口。如果沒有持續的政策支持,在規模經濟效應使成本降至與電力市場價格持平之前,波浪能市場將面臨停滯的風險。
細分市場分析
振動轉換器(主要由點吸收器組成)在2025年佔已裝置容量的59.7%。在標準化模組大規模生產的推動下,該細分市場的波浪能市場規模預計將以93.5%的複合年成長率成長。 HiWave-5等設備中整合的相位控制演算法提高了能量捕捉率,促使投資者認為這項技術已接近商業化。該細分市場可靠性的提高正推動著從生存能力測試向以盈利為導向的部署模式的廣泛轉變。
點吸收器的需求主要源自於其靈活的錨碇方式,使其既適用於防波堤維修項目,也適用於淺水基礎。複合材料包覆層延長了其在強腐蝕性海洋環境中的使用壽命,並將停機時間限制在每年一次的定期檢查。這些改進降低了保險和資金籌措成本,使振動轉換器在波浪能市場中佔據了顯著優勢。
區域分析
歐洲是波浪能市場的核心,預計2025年將佔裝置容量的75.1%。在可再生能源指令III的強力政策支持下,加上「地平線歐洲」計畫2.7378億美元的海洋能源預算,正確保1-10兆瓦的波浪能陣列穩步部署,這些陣列如今已支撐起一條區域供應鏈,並將組件出口到亞太地區。英國、愛爾蘭和葡萄牙正分別透過結合上網電價補貼和試點基礎建設,加速波浪能發展進程。
亞太地區正經歷最快成長,預計到2031年複合年成長率將達到84.4%。這主要得益於印度40吉瓦的理論裝機潛力、台灣20兆瓦的中期目標以及日本新能源產業技術綜合開發機構(NEDO)支持的示範計畫。印尼和馬來西亞領先的本土油氣燃氣公司正在試行共享土地模式,為初期階段提供了關鍵客戶。中國北部灣的空心海堤系統已實現接近市電平價的平準化發電成本,證明了其在人事費用成本低廉的地區具有可行性。
北美、南美和中東正在成為新興的前沿地區。加州參議院第605號法案指定了該州境內37吉瓦的沿海資源,但目前只有PacWave South計畫獲得了全面批准。巴西耗資10億美元的聖卡塔琳娜舉措是政府支持旨在替代進口的資金項目的典型例子。沙烏地阿拉伯的NEOM正在紅海進行原型評估,這是其在2032年部署120吉瓦可再生能源計畫的一部分,這有望為混合能源解決方案開闢一個擁有豐富陽光和波浪能資源的新區域。
其他好處:
- Excel格式的市場預測(ME)表
- 3個月的分析師支持
目錄
第1章:引言
- 研究假設和市場定義
- 調查範圍
第2章:調查方法
第3章執行摘要
第4章 市場狀況
- 市場概覽
- 市場促進因素
- 歐盟和亞太地區擴大上網電價補貼和差額結算方式
- 需要利用海洋能生產的基本負載可再生能源來平衡風能和太陽能發電。
- 透過複合結構和模組化動力輸出裝置降低成本
- 風險基礎設施基金加大對示範陣列的投資
- Power-to-X樞紐(綠氫/氨)整合波浪能設施
- 海上油氣平台的強制性脫碳正在加速共址建設。
- 市場限制因素
- 與成熟的可再生能源相比,資本支出(CAPEX)和度電成本(LCOE)差距較大。
- 接入電網的障礙以及需要多個機構授權
- 與未來深海採礦區爭奪海洋空間利用權
- 遠洋維修船舶和船員短缺
- 供應鏈分析
- 監理情勢
- 技術展望
- 波特五力模型
第5章 市場規模與成長預測
- 按類型
- 振動水柱
- 振動式變矩器
- 溢出轉換器
- 按安裝位置
- 陸上(固定式防波堤)
- 近岸(2公里以內,水深25公尺或以上)
- 近海 -大陸棚(2-20 公里,25-60 公尺)
- 離岸 - 深海(20 公里或更遠,60 公尺或更深)
- 透過使用
- 發電
- 海水淡化
- 環境保護(防波堤、珊瑚礁修復)
- 其他
- 按地區
- 北美洲
- 美國
- 加拿大
- 墨西哥
- 歐洲
- 英國
- 法國
- 西班牙
- 荷蘭
- 丹麥
- 俄羅斯
- 其他歐洲國家
- 亞太地區
- 中國
- 印度
- 日本
- 韓國
- 東南亞國協
- 澳洲和紐西蘭
- 其他亞太國家
- 南美洲
- 巴西
- 阿根廷
- 哥倫比亞
- 其他南美國家
- 中東和非洲
- 阿拉伯聯合大公國
- 沙烏地阿拉伯
- 南非
- 埃及
- 其他中東和非洲國家
- 北美洲
第6章 競爭情勢
- 市場集中度
- 策略趨勢(併購、聯盟、購電協議)
- 市場佔有率分析(主要公司的市場排名和佔有率)
- 公司簡介
- Ocean Power Technologies, Inc.
- Eco Wave Power Ltd.
- Carnegie Clean Energy Ltd.
- CorPower Ocean AB
- AW-Energy Oy
- SINN Power GmbH
- Mocean Energy Ltd.
- Wello Oy
- Wave Swell Energy Ltd.
- Seabased AB
- Resolute Marine Energy, Inc.
- Oscilla Power, Inc.
- Bombora Wave Power Pty Ltd.
- Infinite Power Ltd.
- Havkraft AS
- Floating Power Plant A/S
- Seatricity Ltd.
- AWS Ocean Energy Ltd.
- Wave Dragon ApS
- INGINE Inc.
第7章 市場機會與未來展望
According to Mordor Intelligence, the wave energy market size in terms of installed base is projected to be 4 megawatt in 2025, 10 megawatt in 2026, and reach 125 megawatt by 2031, growing at a CAGR of 65.72% from 2026 to 2031.
This report is Segmented by Type (Oscillating Water Column, Others), Deployment Location (Onshore, Near-Shore, Offshore Shallow Shelf, Offshore Deep Water), Application (Power Generation, Desalination, Environmental Protection, Others), and Geography (North America, Europe, Asia-Pacific, South America, Middle East and Africa). The Market Forecasts are Provided in Terms of Volume (MW).
Global Wave Energy Market Trends and Insights
Feed-in-tariff & Contract-for-difference Schemes Expand in EU & APAC
Member-state targets under the European Renewable Energy Directive III require that 5% of new renewable capacity between 2025 and 2030 come from innovative sources, explicitly naming wave technologies. Ireland's Marine Energy Programme, Horizon Europe grants, and Taiwan's first contract-for-difference agreement for wave power create predictable revenue streams that derisk early projects. These incentives shorten payback periods, attract venture backing, and move the wave energy market from prototype trials to pre-commercial clusters. Developers in India and Portugal are already securing long-term tariffs at premiums that mirror early offshore-wind support schemes. The success of these frameworks is prompting other Asia-Pacific governments to draft similar support mechanisms, enlarging the investable project pipeline.
Demand for Ocean-Sourced Baseload Renewables to Balance Wind and Solar
Wave devices deliver capacity factors of 25-35% today and up to 40-48% in optimized forecasts, smoothing supply during solar and wind lulls. Island grids in Hawaii, the Canary Islands, and King Island deploy wave arrays to displace diesel generation without relying on large battery systems. U.S. federal programs such as the Waves to Water Prize fund off-grid desalination buoys that use direct mechanical pressure rather than grid electricity. Commercial operators of remote mining and aquaculture sites adopt wave energy to cut fuel logistics and lower emissions penalties. Collectively, these baseload applications widen the customer base and accelerate scale economies for the wave energy market.
High CAPEX & LCOE Gap Versus Mature Renewables
Wave energy's 2025 levelized cost of USD 388-618 MWh is three to six times that of utility-scale solar, deterring merchant investments. Learning-curve studies by NREL show costs may drop to USD 0.07-0.13 kWh by 2050, conditional on multi-gigawatt roll-outs. Early adopters, therefore, depend on tariffs exceeding USD 351 MWh or direct capital subsidies. In emerging markets, willingness to pay is below USD 0.10 kWh, widening the financing gap. Without continued policy support, the wave energy market risks stalling before economies of scale can unlock parity.
Other drivers and restraints analyzed in the detailed report include:
- Cost Decline from Composite Structures & Modular PTOs
- Rising Venture & Infrastructure Fund Investments in Demonstrator Arrays
- Grid Interconnection & Multi-Agency Permitting Hurdles
For complete list of drivers and restraints, kindly check the Table Of Contents.
Segment Analysis
Oscillating body converters, mainly point absorbers, captured 59.7% of installed capacity in 2025. The wave energy market size for this segment is on course to grow at a 93.5% CAGR, supported by serial production of standardized modules. Phase-control algorithms in devices such as HiWave-5 have lifted energy-capture ratios, helping investors view the technology as near-commercial. The segment's rising reliability underpins a broader shift from survivability testing to revenue-focused deployments.
Demand for point absorbers is reinforced by their flexible mooring options, making them suitable for both breakwater retrofits and shallow-shelf foundations. Composite cladding extends service lives in corrosive marine environments, limiting downtime to scheduled annual inspections. These improvements lower the cost of insurance and financing, securing a durable lead for oscillating body converters within the wave energy market.
Geography Analysis
Europe anchors the wave energy market with 75.1% of installed capacity in 2025. Robust policy support under Renewable Energy Directive III, plus Horizon Europe's USD 273.78 million marine-energy budget, ensures a steady queue of 1-10 MW arrays, feeding a regional supply chain that now exports components to Asia-Pacific. The United Kingdom, Ireland, and Portugal each combine feed-in premiums with test-site infrastructure, accelerating learning rates.
Asia-Pacific shows the fastest growth, charting an 84.4% CAGR through 2031, powered by India's 40 GW theoretical potential, Taiwan's 20 MW medium-term target, and Japan's NEDO-backed demonstrations. Local oil and gas majors in Indonesia and Malaysia are trialing co-location concepts, providing anchor customers for early arrays. China's Beibu Gulf cavity revetment system reports levelized costs near grid parity, proving feasibility in low-labor-cost markets.
North America, South America, and the Middle East are emerging frontiers. California's Senate Bill 605 flags 37 GW of state coastal resources, yet only PacWave South is fully permitted. Brazil's USD 1 billion Santa Catarina initiative exemplifies sovereign-wealth backing aimed at import substitution. Saudi Arabia's NEOM evaluates Red Sea prototypes within its 120 GW 2032 renewable commitment, potentially opening a new high-insolation yet wave-rich geography to hybrid solutions.
- Ocean Power Technologies, Inc.
- Eco Wave Power Ltd.
- Carnegie Clean Energy Ltd.
- CorPower Ocean AB
- AW-Energy Oy
- SINN Power GmbH
- Mocean Energy Ltd.
- Wello Oy
- Wave Swell Energy Ltd.
- Seabased AB
- Resolute Marine Energy, Inc.
- Oscilla Power, Inc.
- Bombora Wave Power Pty Ltd.
- Infinite Power Ltd.
- Havkraft AS
- Floating Power Plant A/S
- Seatricity Ltd.
- AWS Ocean Energy Ltd.
- Wave Dragon ApS
- INGINE Inc.
Additional Benefits:
- The market estimate (ME) sheet in Excel format
- 3 months of analyst support
TABLE OF CONTENTS
1 Introduction
- 1.1 Study Assumptions & Market Definition
- 1.2 Scope of the Study
2 Research Methodology
3 Executive Summary
4 Market Landscape
- 4.1 Market Overview
- 4.2 Market Drivers
- 4.2.1 Feed-in-tariff & contract-for-difference schemes expand in EU & APAC
- 4.2.2 Demand for ocean-sourced baseload renewables to balance wind/solar
- 4.2.3 Cost decline from composite structures & modular PTOs
- 4.2.4 Rising venture & infrastructure fund investments in demonstrator arrays
- 4.2.5 Power-to-X hubs (green hydrogen/ammonia) integrating wave devices
- 4.2.6 Decarbonisation mandates for offshore O&G platforms driving co-location
- 4.3 Market Restraints
- 4.3.1 High CAPEX & LCOE gap versus mature renewables
- 4.3.2 Grid interconnection & multi-agency permitting hurdles
- 4.3.3 Marine-spatial conflict with future deep-sea mining zones
- 4.3.4 Shortage of specialised far-shore maintenance vessels & crew
- 4.4 Supply-Chain Analysis
- 4.5 Regulatory Landscape
- 4.6 Technological Outlook
- 4.7 Porter's Five Forces
- 4.7.1 Threat of New Entrants
- 4.7.2 Bargaining Power of Buyers
- 4.7.3 Bargaining Power of Suppliers
- 4.7.4 Threat of Substitutes
- 4.7.5 Competitive Rivalry
5 Market Size & Growth Forecasts
- 5.1 By Type
- 5.1.1 Oscillating Water Column
- 5.1.2 Oscillating Body Converters
- 5.1.3 Overtopping Converters
- 5.2 By Deployment Location
- 5.2.1 Onshore (fixed breakwater)
- 5.2.2 Near-shore (Up to 2 km, Over 25 m depth)
- 5.2.3 Offshore - Shallow Shelf (2 to 20 km, 25 to 60 m)
- 5.2.4 Offshore - Deep Water (More than 20 km, More than 60 m)
- 5.3 By Application
- 5.3.1 Power Generation
- 5.3.2 Desalination
- 5.3.3 Environmental Protection (breakwaters, reef restoration)
- 5.3.4 Others
- 5.4 By Geography
- 5.4.1 North America
- 5.4.1.1 United States
- 5.4.1.2 Canada
- 5.4.1.3 Mexico
- 5.4.2 Europe
- 5.4.2.1 United Kingdom
- 5.4.2.2 France
- 5.4.2.3 Spain
- 5.4.2.4 Netherland
- 5.4.2.5 Denmark
- 5.4.2.6 Russia
- 5.4.2.7 Rest of Europe
- 5.4.3 Asia-Pacific
- 5.4.3.1 China
- 5.4.3.2 India
- 5.4.3.3 Japan
- 5.4.3.4 South Korea
- 5.4.3.5 ASEAN Countries
- 5.4.3.6 Australia and New Zealand
- 5.4.3.7 Rest of Asia-Pacific
- 5.4.4 South America
- 5.4.4.1 Brazil
- 5.4.4.2 Argentina
- 5.4.4.3 Colombia
- 5.4.4.4 Rest of South America
- 5.4.5 Middle East and Africa
- 5.4.5.1 United Arab Emirates
- 5.4.5.2 Saudi Arabia
- 5.4.5.3 South Africa
- 5.4.5.4 Egypt
- 5.4.5.5 Rest of Middle East and Africa
- 5.4.1 North America
6 Competitive Landscape
- 6.1 Market Concentration
- 6.2 Strategic Moves (M&A, Partnerships, PPAs)
- 6.3 Market Share Analysis (Market Rank/Share for key companies)
- 6.4 Company Profiles (includes Global level Overview, Market level overview, Core Segments, Financials as available, Strategic Information, Products & Services, and Recent Developments)
- 6.4.1 Ocean Power Technologies, Inc.
- 6.4.2 Eco Wave Power Ltd.
- 6.4.3 Carnegie Clean Energy Ltd.
- 6.4.4 CorPower Ocean AB
- 6.4.5 AW-Energy Oy
- 6.4.6 SINN Power GmbH
- 6.4.7 Mocean Energy Ltd.
- 6.4.8 Wello Oy
- 6.4.9 Wave Swell Energy Ltd.
- 6.4.10 Seabased AB
- 6.4.11 Resolute Marine Energy, Inc.
- 6.4.12 Oscilla Power, Inc.
- 6.4.13 Bombora Wave Power Pty Ltd.
- 6.4.14 Infinite Power Ltd.
- 6.4.15 Havkraft AS
- 6.4.16 Floating Power Plant A/S
- 6.4.17 Seatricity Ltd.
- 6.4.18 AWS Ocean Energy Ltd.
- 6.4.19 Wave Dragon ApS
- 6.4.20 INGINE Inc.
7 Market Opportunities & Future Outlook
- 7.1 White-space & Unmet-need Assessment
 海洋能源:市場佔有率分析、產業趨勢與統計、成長預測(2026-2031)
 波浪能和潮汐能市場-全球產業規模、佔有率、趨勢、機會和預測:按類型、技術、應用、地區和競爭格局分類,2021-2031年漂浮式潮汐能市場-全球產業規模、佔有率、趨勢、機會與預測:按潮汐能轉換器、地區和競爭格局分類,2021-2031年
 波浪能和潮汐能市場預測至2034年—按類型、組件、地區、應用、最終用戶和地理分類的全球分析
 波浪能和潮汐能市場:按技術、組件、安裝類型、最終用途和最終用戶分類-2026-2032年全球市場預測波浪能發電設備市場:依技術、額定功率、安裝類型、運轉模式及最終用戶分類-2026-2032年全球市場預測
 波浪能發電設備市場:依技術、地點、應用和區域分類波浪能發電市場:按類型、產品類型、部署模式、應用和最終用戶分類-2026-2032年全球市場預測海洋波浪和潮汐能市場預測至2034年:按類型、組件、安裝位置、應用、最終用戶和地區分類的全球分析
 2026年全球波浪能與潮汐能市場報告