


 |
市場調查報告書
商品編碼
2063242
海洋能源:市場佔有率分析、產業趨勢與統計、成長預測(2026-2031)Ocean Power - Market Share Analysis, Industry Trends & Statistics, Growth Forecasts (2026 - 2031) |
||||||
※ 本網頁內容可能與最新版本有所差異。詳細情況請與我們聯繫。
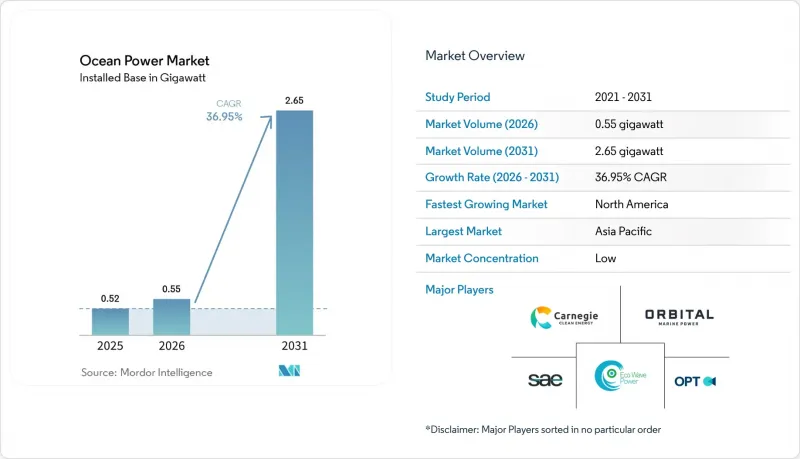
根據 Mordor Intelligence 估計,2025 年海上電力市場裝置容量為 0.52 吉瓦,預計到 2031 年將從 2026 年的 0.55 吉瓦,預計到 2031 年將從 2026-2031 年)複合年成長率為 2.65 吉瓦,預測期(2026-2031 年)複合年成長率為 36.95%。
本報告按技術(潮汐能、波浪能、海洋溫差能、鹽度梯度能)、應用(發電、海水淡化、船舶推進、數據和通訊平台)、最終用戶(公共產業和獨立發電企業、工業、商業)以及地區(北美、歐洲、亞太、南美、中東和非洲)進行細分。市場預測以規模(吉瓦)為單位。
全球海洋能源市場趨勢與洞察
可再生能源目標和政策獎勵
各國脫碳藍圖如今都明確了潮汐能的裝置容量分配,不再將其歸類為可再生能源的剩餘類別。法國設定了2030年實現250兆瓦潮汐能裝置容量的目標,並提供每千瓦時0.16美元的上網電價補貼(FIT),以確保可預測的現金流,並幫助開發商獲得優先債務融資。美國已撥款1.12億美元,用於在奧勒岡州海岸附近的併網PacWave波浪能電站測試波浪能轉換器,為設備製造商提供商業規模示範項目的途徑。西班牙正在加那利群島投資興建60兆瓦波浪能發電項目,以取代液化天然氣進口,凸顯了該島地區豐富的波浪能資源在穩定能源供應方面的潛力。這些政策透過為每項技術設定價格上限來降低電力供應商的風險,並鼓勵股權投資者支持首批商業電站的建設。隨著相關法規的逐步完善,領先企業正在簽署長期購電協議,以支持2031年的下一輪發電容量擴張。
平準化能源成本的下降正在加速商業性可行性的實現。
成本降低源自於更大的渦輪機、模組化陣列以及從離岸風力發電汲取的設計經驗。 Orbital Marine Power 的 2MW「O2」渦輪機將每兆瓦的基座數量減少了一半,降低了海底安裝成本,並簡化了電力收集系統。 CorPower Ocean 的相位控制系統可根據當地海況調整浮標共振,在現場測試中將年發電量提高了 30%,並將平準化電力成本降低至每千瓦時 0.18 美元。在蘇格蘭,潮汐能發電場和離岸風電場之間共用作業船和升降式駁船,使運維成本降低了 18%。此外,自動化纖維鋪放機將複合材料葉片的製造時間從 12 週縮短至 6 週。隨著這些製程改進的不斷推進,海洋能源與新建設固定式離岸風力發電之間的平準化電力成本差距持續縮小,從而擴大了可調節低碳基本負載電力的市場。
高額資本支出(CAPEX)是專案資金籌措的一大挑戰。
儘管海上能源陣列的初始成本在每千瓦4000美元至7000美元之間,但離岸風電的成本僅為每千瓦1300美元,這使得缺乏組件壽命精算數據的商業金融機構望而卻步。 Orbital Marine Power公司在英國基礎設施銀行擔保了60%的建設風險後,於2024年僅資金籌措,這表明公共支持仍然至關重要。 Carnegie Clean Energy公司在西澳的波浪發電工程超支42%後,於2024年進入自願託管程序,凸顯了該產業在海底建設中極易受到不可預見事件的影響。由於缺乏20兆瓦以下交易的標準化模板,新興市場開發商通常面臨超過8%的借貸成本。與多邊金融機構合作的混合融資結構雖然有所幫助,但會導致複雜的合約條款,從而損害專案的盈利。
細分市場分析
到2025年,潮汐能裝置容量將佔總裝置容量的98.94%。這反映了潮汐能組件的成熟壽命和超過40%的容量利用率,為公用事業規模的資金籌措潛力奠定了基礎。即使其他競爭設計日趨成熟,潮汐能預計仍將保持在主導地位。這是因為專案開發商可以利用最初為離岸風力發電建造的海底電纜和維護船隊。 Minesto公司的低速風箏式裝置正在開闢固定軸轉子無法運作的新領域,釋放約10吉瓦先前未開發的資源。波浪能目前在全球整體的裝置容量仍不足50兆瓦,但隨著相位控制浮標系統的應用,運轉率正在提高,該系統可以減少風暴高峰期間對結構的負荷。目前分佈稀少的海洋溫差發電(OTEC)預計將以三位數的速度成長,因為浮體式平台可以省去昂貴的陸上冷凍水管道,並將電力銷售與海水淡化和水產養殖的收入結合。符合 IEC 62600 標準正在加速跨境設備銷售,並擴大離岸發電市場的潛在容量。
浮體式多功能海洋溫差發電(OTEC)原型,例如Bluerise公司計劃於2027年部署的1.5兆瓦平台,將電力、淡水和冷水養殖整合於同一艘船上,在拓展收入來源的同時分散了固定成本。像CorPower公司的C4這樣的波浪能發電機能夠實現即時共振調節,使單位成本指標更接近公用事業公司的採購標準。到2031年,潮汐發電技術仍將是累積裝置容量的核心,尤其是在加拿大芬迪灣和印尼龍目海峽,這些地區的潮汐流速足以支持45%的容量利用率。然而,多元化的開發平臺表明,到2031年,超過25%的新增裝置容量將來自非潮汐系統,這預示著海上電力市場的技術組合將逐步但穩定地擴展。
區域分析
到2025年,亞太地區將佔全球總發電量的51.15%。光是中國就將在浙江和福建兩省部署270兆瓦的潮汐發電工程,透過利用離岸風力發電鏈,將輸電成本降低22%(Nea.Gov.Cn)。韓國始華大壩到2025年將發電552吉瓦時,這表明即使是潮差僅為9米的河口規模項目也能達到25%的容量係數,並且有可能獲得政府支持的資金籌措。日本已資助四個總裝置容量為12兆瓦的波浪能發電試點項目,用於離島,透過替代柴油發電,每千瓦時成本降低了0.35美元。同時,澳洲在珀斯海岸附近部署了一座8兆瓦的波浪能發電廠,為沿海採礦作業的海水淡化廠供電。東南亞地區,印尼和菲律賓未開發的海峽理論上蘊藏 18 吉瓦的資源,但由於輸電網的限制和缺乏收費系統,實際裝置容量不足 5 兆瓦。
在北美,繼美國國家海洋能源管理局 (NOEA) 於 2025 年就奧勒岡州、加利福尼亞州和緬因州沿海 600 兆瓦的潮汐能和波浪能租賃項目競標後,預計到 2031 年,該地區的年複合成長率將達到 71.9%。 PacWave 測試場地提供符合貸款方實質審查標準的即時性能元資料,從而為商業化前期的電站提供商業融資。位於加拿大芬迪灣的一座浮體式潮汐能電站,在 2024 年實現了 38% 的容量係數,且未使用海底錨。同時,在墨西哥下加利福尼亞州,正在採購 15 兆瓦的波浪能,用於為農業海水淡化廠供電。聯邦能源監管委員會 (FERC) 於 2024 年簡化了監管流程,將 5 兆瓦以下海洋能源項目的許可核准時間縮短至三年,顯示政策摩擦有所緩解。
歐洲市場正受到英國12兆瓦梅根(MeyGen)潮汐能電站和法國「長期能源計畫」(Programmation Pluriannuelle de l'Energie)下250兆瓦潮汐能發展藍圖的推動。英國皇家地產局已頒發11份海上潮汐能租賃協議,預計2025年總裝置容量將達1吉瓦;西班牙巴斯克能源署已運作一座2兆瓦振盪水柱式潮汐能電站,為600戶家庭供電。在荷蘭,一座10兆瓦潮汐能發電廠已與離岸風力發電併網,用於在無風時期調節電網頻率。此外,丹麥的 WavePiston 公司已安裝了 5 兆瓦的模組化波浪能發電板,目標是在 2029 年實現與風能發電成本持平。在南美和中東,波浪能發電的規模仍然有限,巴西的 10 兆瓦 Pesem 波浪發電工程因資金籌措問題而停滯,沙烏地阿拉伯的 5 兆瓦紅海試點計畫在授權過程中被推遲,這凸顯了各地區在投資準備方面的差異。
其他好處:
- Excel格式的市場預測(ME)表
- 3個月的分析師支持
目錄
第1章:引言
- 研究假設和市場定義
- 調查範圍
第2章:調查方法
第3章執行摘要
第4章 市場狀況
- 市場概覽
- 市場促進因素
- 可再生能源目標和政策獎勵
- 潮汐能和波浪能發電技術的平準化能源成本下降
- 可預測的基本負載電源供應
- 海上氫氣和水產養殖設施
- 海軍脫碳要求
- 島嶼韌性計劃
- 市場限制因素
- 高額資本投入與資金籌措障礙
- 複雜的環境許可程序
- 先進複合材料供應瓶頸
- 遵守非標準電網連接規則
- 供應鏈分析
- 監理情勢
- 技術展望
- 波特五力分析
第5章 市場規模與成長預測
- 透過技術
- 潮汐能
- 波浪能發電
- 海洋溫差發電(OTEC)
- 鹽度梯度(藍色能量)
- 透過使用
- 發電
- 海水淡化
- 船舶推進系統
- 數據和線上平台
- 最終用戶
- 公共產業及獨立發電商(IPP)
- 產業
- 商業
- 按地區
- 北美洲
- 美國
- 加拿大
- 墨西哥
- 歐洲
- 英國
- 法國
- 西班牙
- 荷蘭
- 丹麥
- 俄羅斯
- 其他歐洲國家
- 亞太地區
- 中國
- 印度
- 日本
- 韓國
- 東南亞國協
- 澳洲和紐西蘭
- 其他亞太國家
- 南美洲
- 巴西
- 阿根廷
- 哥倫比亞
- 其他南美國家
- 中東和非洲
- 阿拉伯聯合大公國
- 沙烏地阿拉伯
- 南非
- 埃及
- 其他中東和非洲國家
- 北美洲
第6章 競爭情勢
- 市場集中度
- 策略趨勢(併購、聯盟、購電協議)
- 市場佔有率分析(主要公司的市場排名和佔有率)
- 公司簡介
- SIMEC Atlantis Energy
- Orbital Marine Power
- Ocean Power Technologies Inc.
- Eco Wave Power Global AB
- Carnegie Clean Energy
- AW-Energy Oy
- Wello Oy
- CorPower Ocean
- Sabella SA
- Marine Power Systems
- Minesto AB
- Nova Innovation
- Oscilla Power
- Bombora Wave Power
- OceanBased Perpetual Energy
- Xinjiang Goldwind Science & Tech
- Seabased AB
- Arrecife Energy Systems
- IHI Corporation
- Hyundai Heavy Industries
第7章 市場機會與未來展望
According to Mordor Intelligence, the ocean power market size in terms of installed base was valued at 0.52 gigawatt in 2025 and is estimated to grow from 0.55 gigawatt in 2026 to reach 2.65 gigawatt by 2031, at a CAGR of 36.95% during the forecast period (2026-2031).
This report is Segmented by Technology (Tidal Energy, Wave Energy, OTEC, Salinity-Gradient), Application (Power Generation, Desalination, Marine Propulsion, Data & Telecom Platforms), End-User (Utilities and IPPs, Industrial, Commercial), and Geography (North America, Europe, Asia-Pacific, South America, Middle East and Africa). Market Forecasts are Provided in Terms of Volume (gigawatt).
Global Ocean Power Market Trends and Insights
Renewable-energy targets & policy incentives
National decarbonization roadmaps now feature explicit capacity allocations for marine energy instead of bundling it into residual renewable categories. France set a 250 MW tidal-stream target for 2030 and offers feed-in tariffs of USD 0.16 per kWh that guarantee predictable cash flow, helping developers raise senior debt. The United States earmarked USD 112 million in 2025 for wave-energy converter testing at the grid-connected PacWave site off Oregon, giving device manufacturers a route to commercial-scale demonstrations. Spain is investing in 60 MW of wave capacity for the Canary Islands to displace liquefied natural-gas imports, underscoring how archipelago jurisdictions are leveraging abundant wave resources for supply security. These policies provide technology-specific price floors that de-risk merchant exposure and encourage equity investors to back first-commercial arrays. As rule-making evolves, early movers are locking in long-term offtake agreements that will underpin the next wave of capacity additions through 2031.
Declining LCOE accelerates commercial viability
Cost reductions stem from turbine upsizing, modular arrays, and design lessons imported from offshore wind. Orbital Marine Power's 2 MW O2 turbine halves the number of foundations per megawatt, trimming subsea installation costs and simplifying electrical collection. CorPower Ocean's phase-control system tunes a buoy's resonance to local sea states, boosting annual energy capture by 30% and pulling levelized costs toward USD 0.18 per kWh in field trials. Shared crew boats and jack-up barges between tidal and wind farms in Scotland have cut O&M expenses by 18%, while automated fiber-placement machines now fabricate composite blades in six weeks instead of twelve. As these process gains propagate, the new-build LCOE gap between marine energy and fixed-bottom offshore wind continues to narrow, expanding the addressable market for dispatchable, low-carbon baseload power.
High CAPEX requirements challenge project financing
Marine-energy arrays cost USD 4,000-7,000 per kW up front, versus USD 1,300 for offshore wind, deterring commercial lenders that lack actuarial data on component lifetimes. Orbital Marine Power secured USD 36.93 million in 2024 only after the UK Infrastructure Bank guaranteed 60% of construction risk, illustrating that public backstops remain critical. Carnegie Clean Energy slipped into voluntary administration in 2024 after a 42% cost overrun on its Western Australian wave project, highlighting the sector's exposure to subsea-construction contingencies. Emerging-market developers often face debt costs above 8% because transactions are sub-20 MW and lack standardized templates. Blended-finance structures with multilateral lenders help, but they introduce complex covenant stacks that erode project returns.
Other drivers and restraints analyzed in the detailed report include:
- Predictable baseload resource availability complements intermittent renewables
- Offshore hydrogen production creates synergistic value chains
- Complex environmental permitting delays project development
For complete list of drivers and restraints, kindly check the Table Of Contents.
Segment Analysis
Tidal energy delivered 98.94% of installed capacity in 2025, reflecting validated component lifetimes and capacity factors above 40% that anchor utility-scale bankability. The ocean power market size for tidal is poised to maintain leadership even as competing designs mature, because site developers can leverage subsea cables and maintenance fleets originally built for offshore wind. Minesto's low-velocity kite devices open new geographies where fixed-axis rotors cannot function, unlocking an estimated 10 GW of previously stranded resource. Wave energy, still under 50 MW globally, is improving availability through phase-control buoy systems that shave structural loads during storm peaks. OTEC, though negligible today, will grow at a triple-digit pace as floating platforms bypass costly onshore cold-water pipes and pair electricity sales with desalination and aquaculture revenue. Compliance with IEC 62600 standards is accelerating cross-border equipment sales, expanding addressable capacity in the ocean power market.
Floating, multi-output OTEC prototypes such as Bluerise's 1.5 MW platform scheduled for 2027 combine electricity, freshwater, and chilled-water aquaculture in one hull, widening revenue streams while spreading fixed costs. Wave devices like CorPower's C4 achieve real-time resonance tuning that pulls unit-cost metrics toward utility triggers for procurement. Tidal technology will remain the backbone of cumulative installations through 2031, especially in Canada's Bay of Fundy and Indonesia's Lombok Strait, where current velocities support 45% capacity factors. However, the diversified pipeline suggests that by 2031, more than 25% of new capacity additions will come from non-tidal systems, signaling a slow but steady broadening of the ocean power market technology mix.
Geography Analysis
Asia-Pacific commanded 51.15% of global capacity in 2025 as China alone installed 270 MW of tidal-stream projects in Zhejiang and Fujian, leveraging offshore wind supply chains to slash transmission costs by 22% Nea.Gov.Cn. South Korea's Sihwa barrage generated 552 GWh in 2025, proving that estuary-scale projects with 9-m tidal ranges can secure 25% capacity factors and attract sovereign-wealth financing. Japan funded four wave pilots totaling 12 MW for remote islands where diesel displacement saves USD 0.35 per kWh, while Australia deployed 8 MW of wave capacity off Perth that feeds desalination for coastal mining operations. Across Southeast Asia, untapped straits in Indonesia and the Philippines offer 18 GW of theoretical resource, but grid constraints and absent tariffs leave installed capacity below 5 MW.
North America is set to record a 71.9% CAGR through 2031 following the US Bureau of Ocean Energy Management's 2025 auction for 600 MW of tidal and wave leases off Oregon, California, and Maine. The PacWave test site supplies real-time performance metadata that satisfies lender due-diligence standards, unlocking commercial debt for pre-commercial arrays. Canada's Bay of Fundy floating tidal farm achieved a 38% capacity factor in 2024 without seabed anchors, while Mexico's Baja California is procuring 15 MW of wave capacity to feed agricultural desalination facilities. Regulatory streamlining by the Federal Energy Regulatory Commission in 2024 reduced marine-energy licensing timelines to three years for projects under 5 MW, signaling that policy frictions are abating.
Europe's market is anchored by the UK's 12 MW MeyGen array and France's 250 MW tidal-stream roadmap under the Programmation Pluriannuelle de l'Energie. The UK Crown Estate issued 11 seabed leases in 2025 worth up to 1 GW, while Spain's Basque Energy Agency commissioned a 2 MW oscillating water column that serves 600 households. The Netherlands integrated a 10 MW tidal array with offshore wind to balance grid frequency during calm periods, and Denmark's WavePiston installed 5 MW of modular wave plates targeting cost parity with wind by 2029. South America and the Middle East remain subscale, with Brazil's 10 MW Pecem wave project stalled over financing and Saudi Arabia's 5 MW Red Sea pilot postponed amid permitting reviews, underlining regional disparities in investment readiness.
- SIMEC Atlantis Energy
- Orbital Marine Power
- Ocean Power Technologies Inc.
- Eco Wave Power Global AB
- Carnegie Clean Energy
- AW-Energy Oy
- Wello Oy
- CorPower Ocean
- Sabella SA
- Marine Power Systems
- Minesto AB
- Nova Innovation
- Oscilla Power
- Bombora Wave Power
- OceanBased Perpetual Energy
- Xinjiang Goldwind Science & Tech
- Seabased AB
- Arrecife Energy Systems
- IHI Corporation
- Hyundai Heavy Industries
Additional Benefits:
- The market estimate (ME) sheet in Excel format
- 3 months of analyst support
TABLE OF CONTENTS
1 Introduction
- 1.1 Study Assumptions & Market Definition
- 1.2 Scope of the Study
2 Research Methodology
3 Executive Summary
4 Market Landscape
- 4.1 Market Overview
- 4.2 Market Drivers
- 4.2.1 Renewable-energy targets & policy incentives
- 4.2.2 Declining LCOE for tidal & wave technologies
- 4.2.3 Predictable baseload resource availability
- 4.2.4 Offshore hydrogen & aquaculture co-location
- 4.2.5 Naval decarbonisation requirements
- 4.2.6 Island-grid resilience programmes
- 4.3 Market Restraints
- 4.3.1 High CAPEX & financing hurdles
- 4.3.2 Complex environmental permitting
- 4.3.3 Advanced-composite supply bottlenecks
- 4.3.4 Non-standard grid-code compliance
- 4.4 Supply-Chain Analysis
- 4.5 Regulatory Landscape
- 4.6 Technological Outlook
- 4.7 Porter's Five Forces Analysis
- 4.7.1 Bargaining Power of Suppliers
- 4.7.2 Bargaining Power of Buyers
- 4.7.3 Threat of New Entrants
- 4.7.4 Threat of Substitutes
- 4.7.5 Competitive Rivalry
5 Market Size & Growth Forecasts
- 5.1 By Technology
- 5.1.1 Tidal Energy
- 5.1.2 Wave Energy
- 5.1.3 Ocean Thermal Energy Conversion (OTEC)
- 5.1.4 Salinity-Gradient (Blue Energy)
- 5.2 By Application
- 5.2.1 Power Generation
- 5.2.2 Desalination
- 5.2.3 Marine Propulsion
- 5.2.4 Data & Telecom Platforms
- 5.3 By End-User
- 5.3.1 Utilities and IPPs
- 5.3.2 Industrial
- 5.3.3 Commercial
- 5.4 By Region
- 5.4.1 North America
- 5.4.1.1 United States
- 5.4.1.2 Canada
- 5.4.1.3 Mexico
- 5.4.2 Europe
- 5.4.2.1 United Kingdom
- 5.4.2.2 France
- 5.4.2.3 Spain
- 5.4.2.4 Netherland
- 5.4.2.5 Denmark
- 5.4.2.6 Russia
- 5.4.2.7 Rest of Europe
- 5.4.3 Asia-Pacific
- 5.4.3.1 China
- 5.4.3.2 India
- 5.4.3.3 Japan
- 5.4.3.4 South Korea
- 5.4.3.5 ASEAN Countries
- 5.4.3.6 Australia and New Zealand
- 5.4.3.7 Rest of Asia-Pacific
- 5.4.4 South America
- 5.4.4.1 Brazil
- 5.4.4.2 Argentina
- 5.4.4.3 Colombia
- 5.4.4.4 Rest of South America
- 5.4.5 Middle East and Africa
- 5.4.5.1 United Arab Emirates
- 5.4.5.2 Saudi Arabia
- 5.4.5.3 South Africa
- 5.4.5.4 Egypt
- 5.4.5.5 Rest of Middle East and Africa
- 5.4.1 North America
6 Competitive Landscape
- 6.1 Market Concentration
- 6.2 Strategic Moves (M&A, Partnerships, PPAs)
- 6.3 Market Share Analysis (Market Rank/Share for key companies)
- 6.4 Company Profiles (includes Global level Overview, Market level overview, Core Segments, Financials as available, Strategic Information, Products & Services, and Recent Developments)
- 6.4.1 SIMEC Atlantis Energy
- 6.4.2 Orbital Marine Power
- 6.4.3 Ocean Power Technologies Inc.
- 6.4.4 Eco Wave Power Global AB
- 6.4.5 Carnegie Clean Energy
- 6.4.6 AW-Energy Oy
- 6.4.7 Wello Oy
- 6.4.8 CorPower Ocean
- 6.4.9 Sabella SA
- 6.4.10 Marine Power Systems
- 6.4.11 Minesto AB
- 6.4.12 Nova Innovation
- 6.4.13 Oscilla Power
- 6.4.14 Bombora Wave Power
- 6.4.15 OceanBased Perpetual Energy
- 6.4.16 Xinjiang Goldwind Science & Tech
- 6.4.17 Seabased AB
- 6.4.18 Arrecife Energy Systems
- 6.4.19 IHI Corporation
- 6.4.20 Hyundai Heavy Industries
7 Market Opportunities & Future Outlook
- 7.1 White-space & Unmet-Need Assessment
 波浪能:市場佔有率分析、產業趨勢與統計、成長預測(2026-2031)
 波浪能和潮汐能市場-全球產業規模、佔有率、趨勢、機會和預測:按類型、技術、應用、地區和競爭格局分類,2021-2031年漂浮式潮汐能市場-全球產業規模、佔有率、趨勢、機會與預測:按潮汐能轉換器、地區和競爭格局分類,2021-2031年
 波浪能和潮汐能市場預測至2034年—按類型、組件、地區、應用、最終用戶和地理分類的全球分析
 波浪能和潮汐能市場:按技術、組件、安裝類型、最終用途和最終用戶分類-2026-2032年全球市場預測波浪能發電設備市場:依技術、額定功率、安裝類型、運轉模式及最終用戶分類-2026-2032年全球市場預測
 波浪能發電設備市場:依技術、地點、應用和區域分類波浪能發電市場:按類型、產品類型、部署模式、應用和最終用戶分類-2026-2032年全球市場預測海洋波浪和潮汐能市場預測至2034年:按類型、組件、安裝位置、應用、最終用戶和地區分類的全球分析
 2026年全球波浪能與潮汐能市場報告