


 |
市場調查報告書
商品編碼
2101910
FLNG市場機會、成長要素、產業趨勢分析及2026-2035年預測。FLNG Market Opportunity, Growth Drivers, Industry Trend Analysis, and Forecast 2026 - 2035 |
||||||

全球FLNG市場預計到2025年價值34億美元,年複合成長率為10.3%,到2035年將達到87億美元。
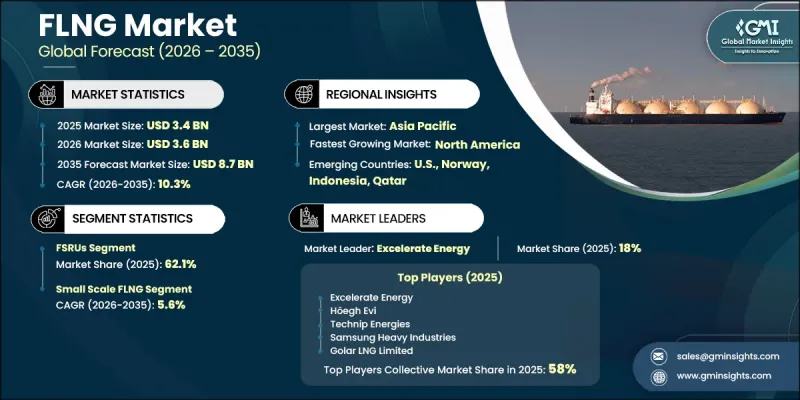
全球液化天然氣貿易的擴張推動了這一成長,而浮體式液化和再氣化(FLNG)解決方案正日益成為開發利用商業性無法利用的近海天然氣蘊藏量的首選方案。對於尋求柔軟性、擴充性且可快速部署的陸上LNG基礎設施替代方案的產氣國而言,FLNG系統正成為重要的戰略驅動力。這項技術已成為依賴特定近海資源的經濟體的LNG生產結構的核心,而無需大規模建造沿海終端即可支援全面生產。同時,全球能源轉型趨勢,例如亞洲從煤炭轉向天然氣以及歐洲供應來源多元化,正在增強長期需求前景。數位孿生系統、人工智慧驅動的預測性維護和先進的模組化控制架構的整合也有助於提高浮體式資產的整體運轉率和成本效益。此外,船舶改裝策略和模組化FLNG設計正在降低資本密集度,進一步加速現有和新興生產生產對FLNG的採用。
| 市場範圍 | |
|---|---|
| 開始年份 | 2025 |
| 預測期 | 2026-2035 |
| 上市時的市場規模 | 34億美元 |
| 預測金額 | 87億美元 |
| 複合年成長率 | 10.3% |
基於浮式儲存再氣化裝置(FSRU)的解決方案預計在2025年將佔據62.1%的市場佔有率,並在2035年之前以8.6%的複合年成長率成長。這一主導地位反映了浮體式再氣化產能的快速擴張,尤其是在傳統管道供應網路遭受大規模中斷之後,全球液化天然氣(LNG)流量已重新分配至高需求地區。這些設施作為基礎設施,在彌合天然氣進口國的供需缺口方面繼續發揮至關重要的作用,與傳統的陸上終端相比,其部署速度更快。
年處理能力不超過100萬噸的小規模FLNG專案享有更強的規模經濟效益和更低的單位液化成本,該細分市場的成長速度仍然相對緩慢。然而,小規模系統在開發無利可圖的近海油田、偏遠島嶼和不發達盆地(在這些地區,大規模基礎設施建設在獲利能力不可行)方面繼續發揮著至關重要的作用,並且正在穩步獲得小眾市場的認可。
預計到2025年,北美浮式液化天然氣(FLNG)市佔率將達到11%,並在2035年之前以13.8%的複合年成長率成長。該地區市場的擴張主要得益於液化天然氣(LNG)出口能力的提升以及沿海主要樞紐地區海上液化計畫的開發。豐富的在建項目以及與全球LNG供應路線日益緊密的整合,進一步提升了該地區在FLNG生態系統中的戰略地位。
目錄
第1章:調查方法和範圍
第2章執行摘要
第3章 行業洞察
- 產業生態系分析
- 造船廠生產能力和瓶頸
- 採購前置作業時間長的低溫設備和零件
- 模組製造地熟練勞動力供應和勞動力短缺情況
- 監理情勢
- 影響產業的因素
- 促進因素
- 產業潛在風險與挑戰
- 成長潛力分析
- 波特的分析
- PESTLE分析
- 投資與資金籌措分析
- FLNG專案資本投資趨勢
- 小規模天然氣基礎設施資本投資趨勢
- 私募股權公司、國有企業和多邊機構目前的資金籌措狀況
- 價格趨勢分析
- 對過去價格趨勢的分析
- 人工智慧和生成式人工智慧對市場的影響
- 利用人工智慧改造現有經營模式
- 生成式人工智慧的應用案例與實施藍圖
- 風險、限制和監管考量
- 將永續發展措施與工業4.0結合
- 未來展望與策略機遇
- 生產能力概覽
- FLNG的已安裝產能
- 運轉率和擴張計劃
第4章 競爭情勢
- 介紹
- 企業市佔率分析:按地區分類
- 北美洲
- 歐洲
- 亞太地區
- 中東和非洲
- 拉丁美洲
- 主要進展
- 重要合作夥伴關係和合作
- 主要併購活動
- 產品創新和新產品發布
- 市場擴大策略
- 競爭定位矩陣
- 排名分類標準與遴選標準
- 按銷售額、地區和創新能力分類的層級定位矩陣。
第5章 市場規模及預測:依設施類型分類,2022-2035年
- FSRU
- LNG FPSO
- 駁船型浮式液化天然氣
第6章 市場規模及預測:依產能分類,2022-2035年
- 小規模
- 中號
- 大規模
第7章 市場規模及預測:依應用領域分類,2022-2035年
- 液化和生產
- 再氣化
- 倉儲和運輸
第8章 市場規模及預測:依地區分類,2022-2035年
- 北美洲
- 美國
- 加拿大
- 墨西哥
- 歐洲
- 英國
- 挪威
- 荷蘭
- 亞太地區
- 中國
- 澳洲
- 印尼
- 馬來西亞
- 中東和非洲
- 卡達
- UAE
- 莫三比克
- 塞內加爾
- 剛果共和國
- 加彭
- 茅利塔尼亞
- 拉丁美洲
- 巴西
- 阿根廷
- 智利
第9章:公司簡介
- BW LNG
- Baker Hughes
- Delfin Midstream
- Excelerate Energy
- Exmar NV
- Golar LNG Limited
- Hoegh Evi
- HD Hyundai Heavy Industries
- JGC Holdings
- MISC Berhad
- MOL(Mitsui OSK Lines)
- McDermott International
- New Fortress Energy
- Samsung Heavy Industries
- SBM Offshore
- Seatrium
- Technip Energies
- UTM Offshore
- Wison Offshore & Marine
The Global FLNG Market was valued at USD 3.4 billion in 2025 and is estimated to grow at a CAGR of 10.3% to reach USD 8.7 billion by 2035.
Growth is shaped by the expanding global LNG trade landscape, where floating liquefaction and regasification solutions are increasingly preferred for monetizing offshore gas reserves that are otherwise commercially stranded. FLNG systems are becoming a strategic enabler for gas-producing nations seeking flexible, scalable, and faster-to-deploy alternatives to onshore LNG infrastructure. The technology is already central to national LNG output structures in select offshore-dependent economies, where it supports full-scale production without requiring extensive coastal terminal development. At the same time, global energy transition dynamics, including coal-to-gas switching in Asia and supply diversification in Europe, are reinforcing long-term demand visibility. The growing integration of digital twin systems, AI-enabled predictive maintenance, and advanced modular control architectures is also improving operational uptime and cost efficiency across floating assets. Additionally, vessel conversion strategies and modular FLNG designs are reducing capital intensity, further accelerating adoption across both established and emerging offshore basins.
| Market Scope | |
|---|---|
| Start Year | 2025 |
| Forecast Year | 2026-2035 |
| Start Value | $3.4 Billion |
| Forecast Value | $8.7 Billion |
| CAGR | 10.3% |
FSRU-based solutions segment held 62.1% share in 2025 and is expected to grow at a CAGR of 8.6% through 2035. This leadership reflects the rapid expansion of floating regasification capacity, particularly as global LNG flows have been redirected toward demand-heavy regions following major disruptions in traditional pipeline supply networks. These assets continue to serve as critical infrastructure for bridging supply-demand gaps in gas importing economies, enabling faster deployment compared to conventional onshore terminals.
The small-scale FLNG units with capacities up to 1 Mtpa segment accounted for 15.7% share in 2025 and are projected to grow at a CAGR of 5.6% through 2035. Growth in this segment remains comparatively moderate as larger-scale FLNG projects benefit from stronger economies of scale and lower per-unit liquefaction costs. However, small-scale systems continue to play an essential role in monetizing marginal offshore fields, remote island grids, and underdeveloped basins where large infrastructure is not economically feasible, ensuring steady but niche adoption.
North America FLNG Market accounted for 11% share in 2025 and is projected to grow at a CAGR of 13.8% through 2035. The region's expansion is primarily driven by rising LNG export capacity and the development of offshore-linked liquefaction initiatives along key coastal hubs. Strong project pipelines and increasing integration into global LNG supply routes are reinforcing the region's strategic importance in the FLNG ecosystem.
Major players operating in the FLNG industry are Excelerate Energy, Hoegh Evi, Technip Energies, Samsung Heavy Industries, Golar LNG, Seatrium, HD Hyundai Heavy Industries, New Fortress Energy, BW LNG, JGC Holdings Corporation, Baker Hughes, McDermott International, Wison Offshore & Marine, SBM Offshore, MISC Berhad, Exmar, MOL, UTM Offshore, Delfin Midstream, and Air Products. Companies operating in the FLNG market are increasingly focusing on modular engineering approaches, vessel conversion strategies, and standardized liquefaction train designs to reduce capital expenditure and shorten project timelines. They are also investing heavily in digitalization, including AI-driven predictive maintenance systems and digital twin platforms, to improve asset reliability and minimize downtime across offshore operations. Strategic collaborations between EPC contractors, energy majors, and marine engineering firms are strengthened to secure long-term project pipelines and share technological risk. In addition, firms are expanding into floating regasification and hybrid FLNG-FSRU solutions to diversify revenue streams and improve asset utilization rates.
Table of Contents
Chapter 1 Methodology & Scope
- 1.1 Research approach
- 1.2 Quality commitments
- 1.2.1 GMI AI policy & data integrity commitment
- 1.2.1.1 Source consistency protocol
- 1.2.1 GMI AI policy & data integrity commitment
- 1.3 Research trail & confidence scoring
- 1.3.1 Research trail components
- 1.3.2 Scoring components
- 1.4 Data collection
- 1.4.1 Partial list of primary sources
- 1.5 Data mining sources
- 1.5.1 Paid sources
- 1.5.1.1 Sources, by region
- 1.5.1 Paid sources
- 1.6 Base estimates and calculations
- 1.6.1 Base year calculation for any one approach
- 1.7 Market estimates & forecasts parameters
- 1.8 Forecast model
- 1.8.1 Quantified market impact analysis
- 1.8.1.1 Mathematical impact of growth parameters on forecast
- 1.8.1 Quantified market impact analysis
- 1.9 Research transparency addendum
- 1.9.1 Source attribution framework
- 1.9.2 Quality assurance metrics
- 1.9.3 Our commitment to trust
- 1.10 Market definitions
Chapter 2 Executive Summary
- 2.1 Industry synopsis, 2022 - 2035
- 2.1.1 Business trends
- 2.1.2 Facility trends
- 2.1.3 Capacity trends
- 2.1.4 Application trends
- 2.1.5 Regional trends
Chapter 3 Industry Insights
- 3.1 Industry ecosystem analysis
- 3.1.1 Shipyard capacity & bottlenecks
- 3.1.2 Cryogenic equipment sourcing & long lead-time components
- 3.1.3 Skilled labor supply & workforce constraints in module fabrication yards
- 3.2 Regulatory landscape
- 3.3 Industry impact forces
- 3.3.1 Growth drivers
- 3.3.2 Industry pitfalls & challenges
- 3.4 Growth potential analysis
- 3.5 Porter's analysis
- 3.5.1 Bargaining power of suppliers
- 3.5.2 Bargaining power of buyers
- 3.5.3 Threat of new entrants
- 3.5.4 Threat of substitutes
- 3.6 PESTEL analysis
- 3.6.1 Political factors
- 3.6.2 Economic factors
- 3.6.3 Social factors
- 3.6.4 Technological factors
- 3.6.5 Legal factors
- 3.6.6 Environmental factors
- 3.7 Investment & funding analysis
- 3.7.1 Capital expenditure trends in FLNG projects
- 3.7.2 Capital investment trends in small-scale LNG infrastructure
- 3.7.3 Private Equity, NOC & multilateral Funding Landscape
- 3.8 Price trend analysis (Driven by Primary Research)
- 3.8.1 Historical price trend analysis
- 3.9 Impact of AI & Generative AI on the market
- 3.9.1 AI-Driven disruption of existing business models
- 3.9.2 GenAI use cases & adoption roadmap
- 3.9.3 Risks, limitations & regulatory considerations
- 3.10 Sustainability initiatives & industry 4.0 integration
- 3.11 Future outlook & strategic opportunities
- 3.12 Capacity landscape (Driven by Primary Research)
- 3.12.1 Installed FLNG Capacity
- 3.12.2 Capacity Utilization Rates & Expansion Pipelines
Chapter 4 Competitive Landscape, 2026
- 4.1 Introduction
- 4.2 Company market share analysis, by region, 2025
- 4.2.1 North America
- 4.2.2 Europe
- 4.2.3 Asia Pacific
- 4.2.4 Middle East & Africa
- 4.2.5 Latin America
- 4.3 Key developments
- 4.3.1 Key partnerships & collaborations
- 4.3.2 Major M&A activities
- 4.3.3 Product innovations & launches
- 4.3.4 Market expansion strategies
- 4.4 Competitive positioning matrix
- 4.4.1 Tier classification criteria & qualifying thresholds
- 4.4.2 Tier positioning matrix by revenue, geography & innovation
Chapter 5 Market Size and Forecast, By Facility, 2022 - 2035 (MTPA & USD Million)
- 5.1 Key trends
- 5.2 FSRU
- 5.3 LNG FPSO
- 5.4 Barge-Based FLNG
Chapter 6 Market Size and Forecast, By Capacity, 2022 - 2035 (MTPA & USD Million)
- 6.1 Key trends
- 6.2 Small Scale
- 6.3 Med Scale
- 6.4 Large Scale
Chapter 7 Market Size and Forecast, By Application, 2022 - 2035 (MTPA & USD Million)
- 7.1 Key trends
- 7.2 Liquefaction & Production
- 7.3 Regasification
- 7.4 Storage & Transportation
Chapter 8 Market Size and Forecast, By Region, 2022 - 2035 (MTPA & USD Million)
- 8.1 Key trends
- 8.2 North America
- 8.2.1 U.S.
- 8.2.2 Canada
- 8.2.3 Mexico
- 8.3 Europe
- 8.3.1 UK
- 8.3.2 Norway
- 8.3.3 Netherlands
- 8.4 Asia Pacific
- 8.4.1 China
- 8.4.2 Australia
- 8.4.3 Indonesia
- 8.4.4 Malaysia
- 8.5 Middle East & Africa
- 8.5.1 Qatar
- 8.5.2 UAE
- 8.5.3 Mozambique
- 8.5.4 Senegal
- 8.5.5 Republic of Congo
- 8.5.6 Gabon
- 8.5.7 Mauritania
- 8.6 Latin America
- 8.6.1 Brazil
- 8.6.2 Argentina
- 8.6.3 Chile
Chapter 9 Company Profiles
- 9.1 BW LNG
- 9.2 Baker Hughes
- 9.3 Delfin Midstream
- 9.4 Excelerate Energy
- 9.5 Exmar NV
- 9.6 Golar LNG Limited
- 9.7 Hoegh Evi
- 9.8 HD Hyundai Heavy Industries
- 9.9 JGC Holdings
- 9.10 MISC Berhad
- 9.11 MOL (Mitsui O.S.K. Lines)
- 9.12 McDermott International
- 9.13 New Fortress Energy
- 9.14 Samsung Heavy Industries
- 9.15 SBM Offshore
- 9.16 Seatrium
- 9.17 Technip Energies
- 9.18 UTM Offshore
- 9.19 Wison Offshore & Marine

 浮體式液化天然氣(FLNG)市場規模、佔有率、成長、全球產業分析、區域趨勢及2026-2034年預測2026-2034年全球浮體式液化天然氣(FLNG)市場規模、佔有率、趨勢和成長分析報告
 浮體式液化天然氣發電廠:市佔率分析、產業趨勢與統計及成長預測(2026-2031 年)
 浮體式儲存再氣化裝置(FSRU)市場規模、佔有率和成長分析:按類型、結構、儲存能力、再氣化能力、錨碇系統、應用、最終用戶和地區分類-2026-2033年產業預測浮體式液化天然氣:市場佔有率分析、產業趨勢與統計、成長預測(2026-2031)
 浮體式液化天然氣(LNG)接收站市場規模、佔有率和趨勢分析報告:按接收站類型、應用、地區和細分市場預測(2026-2033 年)
 2026-2030年全球浮體式儲存再氣化裝置(FSRU)市場
 浮體式儲存再氣化裝置市場:按組件、船舶類型、容量、設計類型、運作方式和最終用戶產業分類-2026-2032年全球市場預測浮體式液化天然氣(FLNG)市場:按儲存系統、船舶類型、技術、儲存容量、運作狀態、應用和最終用戶分類-2026-2032年全球市場預測
 浮體式液化天然氣(FLNG)市場-全球產業規模、佔有率、趨勢、機會、預測:按技術、最終用戶、地區和競爭對手分類,2021-2031年