


 |
市場調查報告書
商品編碼
2062313
社交電視:市場佔有率分析、產業趨勢與統計、成長預測(2026-2031)Social TV - Market Share Analysis, Industry Trends & Statistics, Growth Forecasts (2026 - 2031) |
||||||

※ 本網頁內容可能與最新版本有所差異。詳細情況請與我們聯繫。
據 Mordor Intelligence 稱,2025 年社交電視市場價值 49.3 億美元,預計到 2031 年將從 2026 年的 55.3 億美元成長到 95.8 億美元,預測期(2026-2031 年)的複合年成長率為 11.61%。
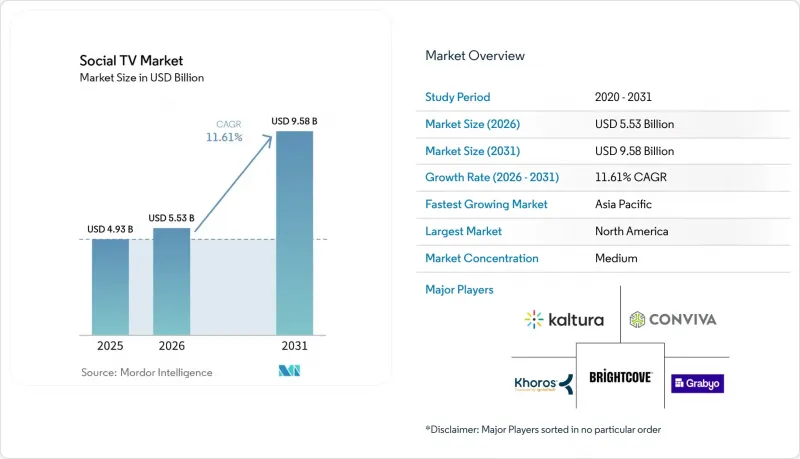
本報告按組件(軟體平台、社交電視分析工具等)、應用程式(定向廣告和贊助等)、設備/平台(網頁瀏覽器介面、遊戲主機等)、部署模式(雲端、本地/邊緣)、最終用戶(廣告商和品牌、內容製作工作室等)以及地區進行細分。市場預測以美元計價。
全球社交電視市場趨勢與洞察
人工智慧驅動的個人化內容建議
建議引擎正從週期性更新轉向持續的行為建模,即時更新提案,將內容發現轉變為以用戶意圖為主導的服務。預計到2025年,Roku頻道上創作者主導節目的串流播放時長將年增約80%,這反映了消費者對真實故事的需求。迪士尼同意使用OpenAI的Sora技術來製作200個標誌性角色,這表明生成式人工智慧如何在降低製作成本的同時,實現大規模資產的在地化。然而,由於58%的觀眾表示他們無法區分真實內容和合成內容,36%的廣告商正考慮將廣告支出從社群媒體轉移到他們認為更安全的連網電視(CTV)環境。因此,將人工智慧驅動的個人化功能與第一方數據結合的平台,更有可能同時維護用戶忠誠度和廣告商信任。
CTV程序化廣告支出激增
供應端整合將使買家能夠透過單一訂單在分散的廣告位上投放宣傳活動,預計到2026年,50%的連網電視(CTV)交易將透過程式化購買實現。 Brightcove與Magnite的合作表明,豐富的元資料如何提高廣告填充率並清理未售出的廣告位。在東南亞,2025年第一季開放式程式化CTV廣告支出年增43%,57%的行銷人員將至少40%的預算重新分配到連網螢幕上。儘管成長勢頭強勁,但新增資金中有四分之一來自社群媒體和搜尋廣告,這給缺乏廣播級影像內容的中小品牌帶來了創新素材短缺的挑戰。
更嚴格的隱私和數據使用法規
《一般資料保護規範》(GDPR)、《加州消費者隱私法案》(CCPA) 以及各州新訂定的法規迫使平台依賴使用者同意的資料和情境線索,這增加了合規負擔,而行為資料池卻在不斷萎縮。世界各地不同的監管規定進一步加劇了工作流程的複雜性,例如韓國實施嚴格的選擇加入政策,而東南亞的監管則更為寬鬆。廣告商將廣告支出轉向連網電視(CTV)時,越來越重視透明度和品牌安全,並將其作為決策的重要標準。因此,擁有基於 ISO 27001 或類似框架認證的供應商更具優勢。
細分市場分析
預計到2025年,軟體平台將佔總收入的44.19%,其核心是內容管理套件、建議引擎和互動式疊加層建構器,這些工具使廣播公司能夠在不改變其線性工作流程的情況下添加投票和即時聊天功能。尼爾森的Talkwalker社交內容評級系統整合了其傳統產品,可追蹤172個電視網和串流媒體服務上的對話,為製作人提供向贊助商展示內容病毒式傳播能力的手段。雖然分析工具目前在社群電視市場中所佔小規模,但隨著版權所有擁有者將原始粉絲對話數據轉化為可銷售的廣告位,預計該細分市場將以12.43%的複合年成長率成長。每個平台都結合了自然語言處理和電腦視覺技術,以確保即時情緒分析結果能夠在不到一秒的時間內影響插播廣告的定價。供應商還提供分層儀表板,支援競爭基準測試,這項功能可以減輕資源有限的地方電視台的報告負擔。
主流雲端供應商正將分析模組作為其核心播放服務的附加元件進行銷售,從而減少了對獨立解決方案的需求。 Amagi NOW 於 2026 年 3 月發布的「AI 美術引擎」可自動產生適用於連網電視 (CTV)、行動裝置和社群媒體的縮圖,將素材製作前置作業時間從數天縮短至數分鐘,消除了先前阻礙多通路分發的瓶頸。在早期採用案例,例如 YES Network 的“Gotham Sports”應用程式,在棒球直播中加入互動性強的問答遊戲後,每場比賽的平均獨立觀看量成長了 38%。隨著廣告主願意為經第二螢幕熱議檢驗的廣告位支付溢價,分析工具正成為社群電視市場經濟結構的核心。
到2025年,觀眾互動和社群建設將佔總支出的35.43%,這主要得益於觀眾聚會、趣味問答和粉絲徽章等功能,這些功能旨在獎勵持續觀看的用戶。然而,目前電商和可購物電視應用正以12.78%的複合年成長率快速成長,是該細分市場中成長最高的。沃爾瑪與VIZIO作業系統的整合,使得每週有1.5億消費者能夠在客廳螢幕上完成從產品發現到一鍵結帳的整個流程。 Roku Action Ads與Shopify的合作,讓LolaVie的銷售額成長了40%,證明電視的購物車轉換率可以媲美曾經僅限於社群媒體的資訊流。與社群功能相關的社群電視市場規模依然可觀,因為互動聊天能夠延長平均觀看時間,並間接增加廣告曝光量。
然而,獲利效率的提升主要體現在能夠縮短用戶從產生興趣到最終購買的轉換流程的商業體驗。根據NBC環球的數據,「可購買的互動環節」使整個節目組合的參與度在2023年第三季至2024年第四季提升了378%。這證實了零售噱頭正在提升而非降低用戶對內容的留存率。貝爾傳媒的Shopsense人工智慧平台能夠產生精選的店鋪頁面,主要面向烹飪和體育節目,其中62.7%的觀眾至少發現了一款新產品。這顯示情境化商品行銷能夠引起用戶的共鳴。隨著電視作業系統中支付資訊的註冊日益普及,預計到2031年,商業領域將成為社群電視市場中最有價值的驅動力。
區域分析
北美地區憑藉著較高的每用戶平均收入 (ARPU) 和成熟的程序化廣告基礎,預計到 2025 年將佔總收入的 34.89%。聯網電視廣告支出預計將在 2026 年達到約 380 億美元,年增 13.8%,其中 70% 的廣告主平均將預算增加 17%。沃爾瑪的 VIZIO OS 單點登入等電商整合方案已將串流曝光與店內銷售聯繫起來,使 Café Bustello 等品牌的額外覆蓋範圍提升了 98%。 5G 的普及正在加速大規模體育賽事直播中第二螢幕增強功能的同步應用。
雖然歐洲也存在類似的基礎設施,但其營運受到更嚴格的隱私法規約束。 GDPR限制行為定向的條款迫使平台投資於情境引擎,雖然增加了成本,但也帶來了品質上的競爭優勢。行業聯合委員會在製定標準方面進展緩慢,迫使買家使用多種指標,這阻礙了全部區域。由於東南亞觀眾更傾向於觀看本國的故事,因此區域性OTT服務擴大融入以文化相關IP為中心的社交功能。
預計到2031年,亞太地區將以12.49%的複合年成長率成長,除中國外,聯網電視家庭用戶預計將增加近1億戶,其中印度和日本將引領這一成長。 2025年第一季,東南亞的程序化廣告支出較去年同期成長43%,顯示需求端平台(DSP)正在填補市場片段化造成的空缺。南美、中東和非洲正面臨平均每用戶收入(ARPU)偏低的困境,並正與通訊業者合作推廣捆綁式微訂閱服務作為臨時措施。儘管如此,大型足球和板球比賽的每千次展示成本(CPM)仍是娛樂類基準值的2到5倍,高價值的直播時段必將繼續推動新興地區社交電視市場的發展趨勢。
其他好處:
- Excel格式的市場預測(ME)表
- 3個月的分析師支持
目錄
第1章:引言
- 研究假設和市場定義
- 調查範圍
第2章:調查方法
第3章執行摘要
第4章 市場狀況
- 市場概覽
- 市場促進因素
- 人工智慧驅動的個人化內容建議
- 程序化連網電視廣告支出激增
- 利用5G實現同步第二螢幕體驗
- 購物功能與社交電商的整合
- 即時觀眾情緒作為一種交易貨幣
- OTT平台與社交網路之間的策略夥伴關係
- 市場限制因素
- 加強對隱私和資料使用的監管
- 設備和作業系統生態系統碎片化
- 缺乏統一的跨平台指標
- 新興市場平均每用戶收入(ARPU)低,限制了獲利能力。
- 產業價值鏈分析
- 監理情勢
- 技術展望
- 宏觀經濟因素對市場的影響
- 波特五力分析
第5章 市場規模與成長預測
- 按組件
- 軟體平台
- 服務
- 硬體/智慧電視解決方案
- 社交電視分析工具
- 透過使用
- 觀眾互動與社區建設
- 定向廣告和贊助
- 內容髮現與建議
- 社交遊戲/互動編程
- 具有商業和購物功能的電視
- 按設備/按平台
- 智慧電視和聯網電視作業系統
- 適用於手機和平板電腦的第二螢幕應用
- 串流媒體播放機和機上盒
- 網頁瀏覽器介面
- 遊戲機
- 按部署模式
- 雲
- 本地部署/邊緣部署
- 最終用戶
- 廣播公司及付費電視業者
- OTT和串流服務供應商
- 廣告商和品牌
- 內容製作工作室
- 體育聯盟和賽事組織者
- 按地區
- 北美洲
- 美國
- 加拿大
- 墨西哥
- 歐洲
- 德國
- 英國
- 法國
- 俄羅斯
- 其他歐洲國家
- 亞太地區
- 中國
- 日本
- 印度
- 韓國
- 澳洲
- 其他亞太國家
- 中東和非洲
- 中東
- 沙烏地阿拉伯
- 阿拉伯聯合大公國
- 其他中東國家
- 非洲
- 南非
- 埃及
- 其他非洲國家
- 中東
- 南美洲
- 巴西
- 阿根廷
- 其他南美國家
- 北美洲
第6章 競爭情勢
- 市場集中度
- 策略趨勢
- 市佔率分析
- 公司簡介
- Brightcove Inc.
- Kaltura Inc.
- Khoros LLC
- Conviva Inc.
- Grabyo Ltd.
- Sceenic Ltd.
- LiveLike Interactive, Inc.
- Never.no AS
- Flowics Inc.
- Amobee, Inc.
- Red Bee Media Ltd.
- Viaccess-Orca SA
- Yidio LLC
- Youtoo Technologies LLC
- TiVo Corporation
- Gracenote, Inc.
- ScreenHits TV Ltd.
- Amagi Corporation
- Streann Media, Inc.
- Magnite, Inc.
第7章 市場機會與未來展望
According to Mordor Intelligence, the social tV market size was valued at USD 4.93 billion in 2025 and estimated to grow from USD 5.53 billion in 2026 to reach USD 9.58 billion by 2031, at a CAGR of 11.61% during the forecast period (2026-2031).
This report is Segmented by Component (Software Platforms, Social TV Analytics Tools, and More), Application (Targeted Advertising and Sponsorship, and More), Device/Platform (Web Browser Interfaces, Gaming Consoles, and More), Deployment Model (Cloud, On-Premise/Edge), End User (Advertisers and Brands, Content Production Studios, and More), and Geography. The Market Forecasts are Provided in Terms of Value (USD).
Global Social TV Market Trends and Insights
AI-Powered Personalized Content Recommendations
Recommendation engines are shifting from scheduled updates to continuous behavioral modeling that refreshes suggestions in real time, turning discovery into an intent-driven service. Streaming hours devoted to creator-led shows on The Roku Channel climbed almost 80% year over year in 2025, reflecting consumer appetite for authentic narratives. Disney's agreement to use OpenAI's Sora for 200 iconic characters shows how generative AI can lower production costs while localizing assets at scale. Yet 58% of viewers report difficulty telling real from synthetic content, nudging 36% of advertisers to shift dollars from social media toward perceived-safer CTV environments. Platforms that couple AI personalization with first-party data are therefore positioned to sustain both user loyalty and advertiser trust.
Programmatic CTV Ad-Spend Boom
Supply-side integrations now let buyers activate campaigns across scattered inventory with a single insertion order, propelling programmatic to an expected 50% of all CTV deals in 2026. Brightcove's tie-up with Magnite demonstrates how enriched metadata boosts fill rates and clears unsold spots. In Southeast Asia, open programmatic CTV spend jumped 43% year on year in Q1 2025 as 57% of marketers reallocated at least 40% of budgets to connected screens. Despite growth, one quarter of incremental funds move from social and search, creating a creative-asset gap for smaller brands that lack broadcast-quality footage.
Tightening Privacy and Data-Usage Regulations
GDPR, the California Consumer Privacy Act, and new state-level statutes force platforms to rely on consented data and contextual cues, lifting compliance overheads while shrinking behavioral pools. Divergent global rules further complicate workflows, as South Korea enforces strict opt-in policies while Southeast Asia applies lighter-touch regimes. Advertisers shifting spend into CTV increasingly cite transparency and brand safety as decision filters, so providers that certify against ISO 27001 and similar frameworks gain an edge.
Other drivers and restraints analyzed in the detailed report include:
- 5G-Enabled Synchronous Second-Screen Experiences
- Shoppable and Social-Commerce Integrations
- Low ARPU in Emerging Markets Limits Monetization
For complete list of drivers and restraints, kindly check the Table Of Contents.
Segment Analysis
Software platforms accounted for 44.19% of 2025 revenue, anchored by content-management suites, recommendation engines, and interactive overlay builders that let broadcasters add polls and live chat without rewiring linear workflows. Talkwalker Social Content Ratings, which absorbs Nielsen's legacy product, tracks conversations across 172 networks and streaming services, giving programmers a way to prove amplification value to sponsors. The Social TV market share held by analytics tools remains modest today, yet the segment is projected to post a 12.43% CAGR as rights owners translate raw fan chatter into sellable inventory. Platforms fuse natural-language processing with computer vision so that real-time sentiment can influence midroll pricing in under a second. Vendors also bundle tiered dashboards that benchmark performance against competitive shows, a feature that reduces reporting labor for resource-starved local stations.
Leading cloud vendors position analytics modules as add-ons to core playout services, limiting the need for point solutions. Amagi NOW's AI Artwork Engine, launched in March 2026, cuts asset turnaround times from days to minutes by automatically generating thumbnails for CTV, mobile, and social, fixing a bottleneck that once slowed multichannel release. Early adopters such as YES Network's Gotham Sports app reported a 38% jump in average unique streams per game after layering sentiment-rich trivia into live baseball. Because advertisers pay premiums for inventory verified by second-screen buzz, analytics tools are becoming central to the social TV market economic stack.
Audience engagement and community-building accounted for 35.43% of 2025 spend, driven by watch parties, quiz overlays, and fandom badges that reward streak viewership. Yet commerce and shoppable TV applications are now advancing at a 12.78% CAGR, the highest in the segment hierarchy. Walmart's VIZIO OS unification lets 150 million weekly shoppers move from discovery to one-click checkout on the living-room screen. Roku Action Ads, paired with Shopify, raised LolaVie's sales by 40% and proved that television can equal cart-conversion rates once exclusive to social feeds. The social TV market size tied to community features still matters because interactive chats extend average viewing time, thereby indirectly boosting ad impressions.
Yet monetization efficiency skews toward commerce experiences that shorten the funnel from inspiration to purchase. NBC Universal data show that shoppable activations boosted engagement by 378% across the portfolio of shows between Q3 2023 and Q4 2024, confirming that retail hooks lift, rather than cannibalize, content retention. Bell Media's Shopsense AI produces curated storefronts around cooking and sports programs, with 62.7% of viewers discovering at least one new product, evidence that contextual merchandising resonates. As payment credentials proliferate within TV operating systems, the commerce segment is expected to add the largest absolute dollars to the social TV market by 2031.
Geography Analysis
North America retained 34.89% of 2025 revenue, buoyed by high ARPU and mature programmatic rails. Connected-TV ad spend is projected to hit about USD 38 billion in 2026, up 13.8% year over year, with 70% of advertisers lifting budgets by 17% on average. Commerce integrations such as Walmart's VIZIO OS single-sign-on already link streaming exposure to in-store sales, boosting incremental reach for brands like Cafe Bustelo by 98%. Widespread 5G helps synchronize second-screen augmentations across large-scale sports broadcasts.
Europe shows parallel infrastructure yet operates under stiffer privacy rules. GDPR clauses that restrict behavioral retargeting push platforms to invest in contextual engines, adding cost but also creating a quality moat. Joint Industry Committee standards move slowly, leaving buyers to juggle multiple measurement currencies, a pain point restraining spend velocity across the region. Southeast Asian audiences prefer domestic storylines, pushing regional OTTs to weave social features around culturally relevant IP.
Asia-Pacific, forecast to climb at a 12.49% CAGR to 2031, will add almost 100 million connected-TV households outside China, led by India and Japan. Open programmatic spend in Southeast Asia jumped 43% year on year in Q1 2025, signaling that demand-side platforms are closing fragmentation gaps. South America and the Middle East and Africa wrestle with low ARPU, pushing telco-bundled micro-subscriptions as stopgaps. Still, marquee football and cricket fixtures generate CPMs two to five times above entertainment baselines, ensuring that high-value live windows continue to move the social TV market needle in emerging regions.
- Brightcove Inc.
- Kaltura Inc.
- Khoros LLC
- Conviva Inc.
- Grabyo Ltd.
- Sceenic Ltd.
- LiveLike Interactive, Inc.
- Never.no AS
- Flowics Inc.
- Amobee, Inc.
- Red Bee Media Ltd.
- Viaccess-Orca SA
- Yidio LLC
- Youtoo Technologies LLC
- TiVo Corporation
- Gracenote, Inc.
- ScreenHits TV Ltd.
- Amagi Corporation
- Streann Media, Inc.
- Magnite, Inc.
Additional Benefits:
- The market estimate (ME) sheet in Excel format
- 3 months of analyst support
TABLE OF CONTENTS
1 INTRODUCTION
- 1.1 Study Assumptions and Market Definition
- 1.2 Scope of the Study
2 RESEARCH METHODOLOGY
3 EXECUTIVE SUMMARY
4 MARKET LANDSCAPE
- 4.1 Market Overview
- 4.2 Market Drivers
- 4.2.1 AI-Powered Personalised Content Recommendations
- 4.2.2 Programmatic CTV Ad-Spend Boom
- 4.2.3 5G-Enabled Synchronous Second-Screen Experiences
- 4.2.4 Shoppable and Social-Commerce Integrations
- 4.2.5 Real-Time Audience Sentiment as a Trading Currency
- 4.2.6 Strategic Alliances Between OTT Platforms and Social Networks
- 4.3 Market Restraints
- 4.3.1 Tightening Privacy / Data-Usage Regulations
- 4.3.2 Fragmented Device and OS Ecosystem
- 4.3.3 Lack of Unified Cross-Platform Measurement Standards
- 4.3.4 Low ARPU in Emerging Markets Limits Monetisation
- 4.4 Industry Value-Chain Analysis
- 4.5 Regulatory Landscape
- 4.6 Technological Outlook
- 4.7 Impact of Macroeconomic Factors on the Market
- 4.8 Porter's Five Forces Analysis
- 4.8.1 Bargaining Power of Buyers
- 4.8.2 Bargaining Power of Suppliers
- 4.8.3 Threat of New Entrants
- 4.8.4 Threat of Substitutes
- 4.8.5 Competitive Rivalry
5 MARKET SIZE AND GROWTH FORECASTS (VALUE)
- 5.1 By Component
- 5.1.1 Software Platforms
- 5.1.2 Services
- 5.1.3 Hardware / Smart-TV Solutions
- 5.1.4 Social TV Analytics Tools
- 5.2 By Application
- 5.2.1 Audience Engagement and Community Building
- 5.2.2 Targeted Advertising and Sponsorship
- 5.2.3 Content Discovery and Recommendations
- 5.2.4 Social Gaming / Interactive Programming
- 5.2.5 Commerce and Shoppable TV
- 5.3 By Device / Platform
- 5.3.1 Smart TVs and Connected-TV OS
- 5.3.2 Mobile and Tablet Second-Screen Apps
- 5.3.3 Streaming Media Players and Set-Top Boxes
- 5.3.4 Web Browser Interfaces
- 5.3.5 Gaming Consoles
- 5.4 By Deployment Model
- 5.4.1 Cloud
- 5.4.2 On-Premise / Edge
- 5.5 By End User
- 5.5.1 Broadcasters and Pay-TV Operators
- 5.5.2 OTT and Streaming Service Providers
- 5.5.3 Advertisers and Brands
- 5.5.4 Content Production Studios
- 5.5.5 Sports Leagues and Event Owners
- 5.6 By Geography
- 5.6.1 North America
- 5.6.1.1 United States
- 5.6.1.2 Canada
- 5.6.1.3 Mexico
- 5.6.2 Europe
- 5.6.2.1 Germany
- 5.6.2.2 United Kingdom
- 5.6.2.3 France
- 5.6.2.4 Russia
- 5.6.2.5 Rest of Europe
- 5.6.3 Asia-Pacific
- 5.6.3.1 China
- 5.6.3.2 Japan
- 5.6.3.3 India
- 5.6.3.4 South Korea
- 5.6.3.5 Australia
- 5.6.3.6 Rest of Asia-Pacific
- 5.6.4 Middle East and Africa
- 5.6.4.1 Middle East
- 5.6.4.1.1 Saudi Arabia
- 5.6.4.1.2 United Arab Emirates
- 5.6.4.1.3 Rest of Middle East
- 5.6.4.2 Africa
- 5.6.4.2.1 South Africa
- 5.6.4.2.2 Egypt
- 5.6.4.2.3 Rest of Africa
- 5.6.4.1 Middle East
- 5.6.5 South America
- 5.6.5.1 Brazil
- 5.6.5.2 Argentina
- 5.6.5.3 Rest of South America
- 5.6.1 North America
6 COMPETITIVE LANDSCAPE
- 6.1 Market Concentration
- 6.2 Strategic Moves
- 6.3 Market Share Analysis
- 6.4 Company Profiles (includes Global Level Overview, Market Level Overview, Core Segments, Financials as available, Strategic Information, Market Rank/Share, Products and Services, Recent Developments)
- 6.4.1 Brightcove Inc.
- 6.4.2 Kaltura Inc.
- 6.4.3 Khoros LLC
- 6.4.4 Conviva Inc.
- 6.4.5 Grabyo Ltd.
- 6.4.6 Sceenic Ltd.
- 6.4.7 LiveLike Interactive, Inc.
- 6.4.8 Never.no AS
- 6.4.9 Flowics Inc.
- 6.4.10 Amobee, Inc.
- 6.4.11 Red Bee Media Ltd.
- 6.4.12 Viaccess-Orca SA
- 6.4.13 Yidio LLC
- 6.4.14 Youtoo Technologies LLC
- 6.4.15 TiVo Corporation
- 6.4.16 Gracenote, Inc.
- 6.4.17 ScreenHits TV Ltd.
- 6.4.18 Amagi Corporation
- 6.4.19 Streann Media, Inc.
- 6.4.20 Magnite, Inc.
7 MARKET OPPORTUNITIES AND FUTURE OUTLOOK
- 7.1 White-Space and Unmet-Need Assessment

 雲端電視全球市場規模、佔有率、趨勢和成長分析報告(2026-2034)
 雲端電視:市場佔有率分析、產業趨勢和統計數據、成長預測(2026-2031 年)
 雲端電視市場-2026-2032年全球市場預測社群電視市場:2026-2032年全球市場預測(依內容類型、功能、應用程式、發行管道及最終用戶分類)
 雲端電視市場:依技術、內容類型、設備類型和地區分類
 2026年全像電視市場報告2026年全球雲端電視市場報告
 雲端電視市場規模、佔有率和成長分析(按部署類型、組織規模、應用程式、最終用戶和地區分類)-2026-2033年產業預測
 全球雲端電視市場全球社交電視市場:2025 年至 2030 年預測