


 |
市場調查報告書
商品編碼
2062273
零售物流:市場佔有率分析、產業趨勢與統計、成長預測(2026-2031)Retail Logistics - Market Share Analysis, Industry Trends & Statistics, Growth Forecasts (2026 - 2031) |
||||||
※ 本網頁內容可能與最新版本有所差異。詳細情況請與我們聯繫。
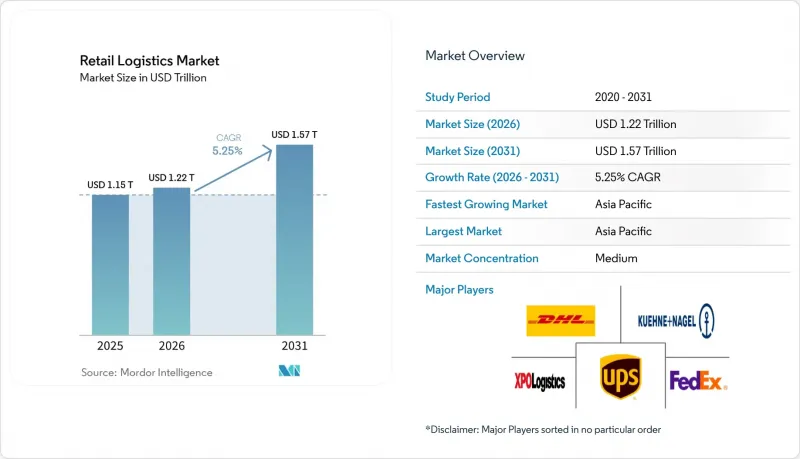
根據 Mordor Intelligence 預測,零售物流市場規模將從 2025 年的 1.15 兆美元和 2026 年的 1.22 兆美元成長到 2031 年的 1.57 兆美元,2026 年至 2031 年的複合年成長率為 5.25%。
自動化、訂閱式商業交易量的成長以及區塊鏈在可追溯性方面的強制性應用,正在重塑履約的經濟結構,尤其是在最後一公里配送和逆向物流領域。本報告按服務類型(運輸、倉儲配送及其他)、產品類型(食品飲料、個人護理及家居用品及其他)、配銷通路(超市、大型超市、便利店及百貨商店、專賣店及其他)和地區(北美、南美、亞太、歐洲及其他)進行細分。市場預測以美元計價。
全球零售物流市場趨勢與洞察
大規模部署自主配送機器人和無人機
到2025年,自動駕駛配送車隊的商業化規模將持續擴大。此前沃爾瑪在2024年初於美國七個州完成了超過2萬次無人機配送,這些里程碑式的成就推動了該行業的顯著成長。亞馬遜的Prime Air服務也正在拓展至鳳凰城都會區,凸顯了其到2031年每年空運5億件包裹的企業目標。 Starship Technologies的地面機器人目前已在全球60多所大學校園和270多個地點運作,將電商訂單的「最後一公里」配送成本降低了高達60%。訂閱模式確保了訂單密度的可預測性,這對於最大限度地提高電池利用率和車隊周轉率至關重要。隨著亞太地區和歐洲監管機構頒發沙盒許可,促進跨境技術標準的整合,預計該產業將進一步擴張。
二手/循環零售的成長正在推動逆向物流平台的發展。
循環零售措施正加速對逆向物流的投資,例如DHL於2025年收購Inmar供應鏈解決方案公司,為其北美網路新增14個退貨中心和800名專業人員。 ThredUp和Vestiaire Collective等二手交易平台仰賴傳統正向物流網路無法實現的高容量鑑定流程。各大品牌正在整合自身的回收循環。 Patagonia的「Worn Wear」和Lululemon的「Like New」等項目透過處理退貨並將其作為合法轉售商品來保護品牌價值。區塊鏈標籤檢驗商品的來源和狀況,在建立消費者信任的同時降低仿冒品的風險。預計監管機構對減少廢棄物目標的持續支持將繼續為專用退貨基礎設施提供資金。
跨境關稅的波動會影響運輸路線的經濟效益。
2025年,中美貿易路線關稅的變化導致配送成本計算方式發生多項調整,迫使零售商從墨西哥雙重採購以規避關稅風險。受近岸外包需求成長的推動,UPS收購了Estafeta,從而在墨西哥160個城市建立了快遞網路。然而,最後一刻推出的監管政策變化迫使承運商重新談判燃油額外費用條款,加劇了官僚摩擦。這種高度不不確定性導致倉庫租賃商縮短合約期限並提高每平方英尺租金。預計這種波動將持續到多邊貿易論壇制定長期框架為止。
細分市場分析
到2025年,運輸業將佔零售物流市場佔有率的62.1%,反映出國內公路貨運在最後一公里配送的關鍵角色。道路運輸運輸受益於連接倉庫和都市區微型樞紐的強大路線網路,而鐵路則從成本效益的角度處理大批量上游工程運輸。海運承擔了大部分跨境貨物運輸,但運費波動促使運輸路線多元化,轉向其他港口。附加價值服務雖然規模較小,但年複合成長率達6.5%,將合規挑戰轉化為高收入來源。逆向物流、產品客製化和檢驗線使零售商無需自建基礎設施即可支援循環經濟模式。
自動化正在變革端到端的服務。自動駕駛卡車已開始在州際公路上進行樞紐到樞紐的試點運營,而倉庫機器人則將平均揀貨時間縮短了40%至50%。 DHL收購Inmar就是一個典型的「整合模式」案例,將高密度運輸與專業的退貨中心結合。區塊鏈的附加功能可在交接時檢驗產品真偽,進而為加值產業帶來技術競爭優勢。隨著ESG審計日益嚴格,碳排放測量儀錶板可能會從基於諮詢的升級轉向標準化的服務等級合約。
區域分析
預計到2025年,亞太地區將以39.8%的市佔率引領零售物流市場,並在2031年之前維持6.9%的複合年成長率。中國政府在上海和深圳設立的自動駕駛汽車測試區,為無人機和機器人測試創造了低門檻通道,加速了其商業部署。印度的「國家物流政策」為貨運走廊和低溫運輸叢集提供資金支持,降低了生鮮食品電子商務的進入門檻。東南亞的智慧城市項目,例如新加坡和吉隆坡,正在整合數位雙胞胎,並將即時交通數據納入路線規劃引擎,以確保即使在都市區擁擠的情況下也能嚴格遵守配送時限。
北美仍是技術的試驗場,但主要都會區土地資源稀缺,導致租金飆升,迫使第三方物流供應商(3PL)轉向多層樞紐設施。雖然倉庫自動化率很高,但企業客戶日益嚴格的ESG(環境、社會和治理)資訊揭露要求迫使承運商以小包裹計算柴油消耗量。與墨西哥的跨境活動日益頻繁,近岸外包將部分消費性電子產品組裝轉移到更靠近美國買家的地方,縮短了運輸時間,並保護供應鏈免受關稅風險的影響。
在歐洲,重點在於遵守排放法規,《企業永續性報告指令》(CSRD) 強制要求計算整個生產過程(從搖籃到大門)的碳排放,採購清單也在進行修訂。鹿特丹和漢堡港口及鐵路資產的垂直整合,提高了托運人實現其環境目標所需的航運路線透明度。在拉丁美洲,UPS 旗下 Estafeta 網路的擴張正在產生投資的連鎖效應,但基礎設施短缺和複雜的海關程序阻礙了成長。中東和非洲市場的發展並不均衡。海灣合作理事會 (GCC) 成員國正在投資建設保稅物流園區,但許多撒哈拉以南非洲國家優先發展公路網路,而非全面部署高科技設備。
其他好處:
- Excel格式的市場預測(ME)表
- 3個月的分析師支持
目錄
第1章:引言
- 研究假設和市場定義
- 調查範圍
第2章:調查方法
第3章執行摘要
第4章 市場狀況
- 市場概覽
- 市場促進因素
- 大規模部署自主配送機器人和無人機
- 二手/循環零售的成長正在推動逆向物流平台的發展。
- 訂閱式電商模式穩定了配送需求。
- 生鮮食品電子商務低溫運輸的開發
- 主要品牌強制推行基於區塊鏈的可追溯性
- 以數據驅動庫存管理的零售媒體網路。
- 市場限制因素
- 跨境關稅波動較大,影響航線盈利。
- 主要大都市地區倉儲物業短缺,導致第三方物流成本上升。
- 來自環境、社會及治理(ESG)審計的壓力正在推動對排放測量領域的資本投資增加。
- 人工智慧人才短缺正在減緩數位雙胞胎。
- 價值供應鏈分析
- 政府法規和政策
- 產業的技術創新
- 地緣政治事件對市場的影響
- 波特五力模型
第5章 市場規模與成長預測
- 按服務類型
- 運輸
- 路
- 鐵路
- 航空
- 海路和內河航道
- 倉儲/物流
- 附加價值服務
- 運輸
- 依產品
- 食品/飲料
- 個人及居家護理
- 時尚與生活方式(配件、服裝、鞋類)
- 家具
- 電子設備及家用電器
- 其他產品
- 透過分銷管道
- 超市/大賣場/便利商店和百貨公司
- 專賣店
- 線上
- 其他頻道
- 按地區
- 北美洲
- 美國
- 加拿大
- 墨西哥
- 南美洲
- 巴西
- 秘魯
- 智利
- 阿根廷
- 其他南美國家
- 亞太地區
- 印度
- 中國
- 日本
- 澳洲
- 韓國
- 東南亞(新加坡、馬來西亞、泰國、印尼、越南、菲律賓)
- 其他亞太國家
- 歐洲
- 英國
- 德國
- 法國
- 西班牙
- 義大利
- 比荷盧經濟聯盟(比利時、荷蘭、盧森堡)
- 北歐國家(丹麥、芬蘭、冰島、挪威、瑞典)
- 其他歐洲國家
- 中東和非洲
- 阿拉伯聯合大公國
- 沙烏地阿拉伯
- 南非
- 奈及利亞
- 其他中東和非洲國家
- 北美洲
第6章 競爭情勢
- 市場集中度
- 策略趨勢
- 市佔率分析
- 公司簡介
- DHL Supply Chain & Global Forwarding
- UPS Supply Chain Solutions
- FedEx Logistics
- XPO Logistics
- Kuehne+Nagel International
- CH Robinson Worldwide
- JD Logistics
- Cainiao(Alibaba Logistics)
- SF Express
- Geodis
- DSV A/S
- Rakuten Super Logistics
- GXO Logistics
- Aramex
- CEVA Logistics
- Ryder Supply Chain Solutions
- Hellmann Worldwide Logistics
- Nippon Express
- JB Hunt Transport Services
- Dachser
第7章 市場機會與未來展望
According to Mordor Intelligence, the retail logistics market size is projected to expand from USD 1.15 trillion in 2025 and USD 1.22 trillion in 2026 to USD 1.57 trillion by 2031, registering a 5.25% CAGR between 2026 and 2031.
Automation roll-outs, subscription-commerce volumes, and blockchain traceability mandates are combining to reconfigure fulfillment economics, especially in last-mile and reverse-logistics settings. This report is Segmented by Service Type (Transportation, Warehousing and Distribution, and More), by Product (Foods and Beverages, Personal and Household Care, and More), by Distribution Channel (Super/Hyper/Convenience and Department Stores, Specialty Stores, and More), by Geography (North America, South America, Asia-Pacific, Europe, and More). The Market Forecasts are Provided in Terms of Value (USD).
Global Retail Logistics Market Trends and Insights
Scale Deployment of Autonomous Delivery Robots and Drones
Autonomous delivery fleets continued to solidify their commercial scale through 2025. Building on earlier milestones such as Walmart surpassing 20,000 drone deliveries across seven U.S. states in early 2024, the sector saw significant ongoing expansion. Amazon's Prime Air also expanded into the Phoenix metro area, underscoring a corporate goal of moving 500 million packages annually by aerial means before 2031. Ground-based robots from Starship Technologies now operate on over 60 university campuses and across more than 270 global locations, cutting last-mile costs by up to 60% for quick-commerce orders. Subscription programs supply the predictable order density needed to maximize battery usage and fleet turnaround times. As regulators issue sandbox permits in Asia-Pacific and Europe, cross-border technology standards are expected to converge, enabling further scale gains.
Growth of Resale / Circular Retail Spurring Reverse-Logistics Platforms
Circular retail activity is accelerating reverse-logistics investments, highlighted by DHL's 2025 purchase of Inmar Supply Chain Solutions, which added 14 returns centers and 800 specialists to its North American network. Resale marketplaces such as ThredUp and Vestiaire Collective depend on high-throughput authentication lines that traditional forward networks cannot match. Brands are internalizing take-back loops, Patagonia's Worn Wear and Lululemon's Like New programs process returned goods for verified resale, protecting brand equity. Blockchain tagging verifies provenance and condition, building consumer trust while reducing counterfeit risk. Continued regulatory support for waste-reduction targets should keep funding flowing toward dedicated returns infrastructure.
Volatile Cross-Border Tariffs Impacting Route Economics
Tariff swings on United States-China trade lanes altered landed-cost math several times in 2025, compelling retailers to dual-source from Mexico to hedge duty risks. Nearshoring demand drove UPS's buyout of Estafeta, giving it express reach across 160 Mexican cities. Yet last-minute rule changes force carriers to renegotiate fuel-surcharge clauses, adding administrative friction. Elevated uncertainty pushes warehouse lessors to shorten contract terms, raising per-square-foot rates. The outlook suggests persistent volatility until multilateral trade forums settle on longer-cycle frameworks.
Other drivers and restraints analyzed in the detailed report include:
- Cold-Chain Build-Out for Fresh Grocery E-Commerce
- Subscription-Commerce Models Stabilizing Delivery Demand
- Warehouse Real-Estate Scarcity in Tier-1 Metros Inflating 3PL Costs
For complete list of drivers and restraints, kindly check the Table Of Contents.
Segment Analysis
Transportation accounted for 62.1% of the retail logistics market share in 2025, reflecting the indispensable role of domestic road freight in last-mile fulfillment. Road carriers benefit from rich route networks that link warehouses to urban micro-hubs, while rail captures bulk upstream moves for cost efficiency. Sea lanes handle most cross-border volume, though tariff volatility is prompting lane diversification into alternate ports. Value-added services, although smaller, are registering a 6.5% CAGR and converting compliance pain points into premium revenue streams. Reverse logistics, product customization, and inspection lines enable retailers to support circular models without building proprietary infrastructure.
Automation is reshaping both ends of the service spectrum. Autonomous trucks are beginning hub-to-hub pilots on interstate corridors, while warehouse robots cut average pick times by 40% to 50%. DHL's Inmar acquisition exemplifies the stitched-together model, merging transport density with specialized return centers. Blockchain add-ons verify product authenticity at handoff, giving value-added divisions a technology moat. As ESG audits tighten, carbon-counting dashboards are likely to migrate from consultancy upgrades into standard service-level agreements.
Geography Analysis
Asia-Pacific led the Retail logistics market with a 39.8% share in 2025 and is set to grow at a 6.9% CAGR through 2031. China's government-designated autonomous-vehicle zones in Shanghai and Shenzhen carve out low-friction corridors for drone and robot testing, accelerating commercial deployments. India's National Logistics Policy unlocks funding for freight corridors and cold-chain clusters, lowering barrier costs for fresh-food e-commerce. Southeast Asian smart-city blueprints in Singapore and Kuala Lumpur integrate digital twins that feed live traffic data into routing engines, keeping delivery windows tight despite urban congestion.
North America remains a technology testbed but wrestles with land scarcity in tier-1 metros, elevating lease rates and nudging 3PLs toward multi-story hubs. Warehouse automation uptake is high, yet ESG disclosure rules emanating from corporate clients push carriers to measure diesel usage down to the parcel. Cross-border dynamics with Mexico intensify as nearshoring relocates portions of consumer-electronics assembly closer to United States buyers, shortening transit times and insulating supply chains from tariff risk.
Europe focuses on emissions compliance, with the Corporate Sustainability Reporting Directive enforcing cradle-to-gate carbon tallies that reshape procurement checklists. Vertical integration of port and rail assets in Rotterdam and Hamburg provides corridor visibility for shippers juggling green quotas. Latin America captures spillover investment through UPS's Estafeta network expansion, though infrastructure gaps and customs complexity temper growth. Middle East and Africa markets show patchy progress Gulf Cooperative Council states invest in bonded logistics parks, while many sub-Saharan countries prioritize road connectivity before high-tech upgrades can gain traction.
- DHL Supply Chain & Global Forwarding
- UPS Supply Chain Solutions
- FedEx Logistics
- XPO Logistics
- Kuehne + Nagel International
- C.H. Robinson Worldwide
- JD Logistics
- Cainiao (Alibaba Logistics)
- SF Express
- Geodis
- DSV A/S
- Rakuten Super Logistics
- GXO Logistics
- Aramex
- CEVA Logistics
- Ryder Supply Chain Solutions
- Hellmann Worldwide Logistics
- Nippon Express
- J.B. Hunt Transport Services
- Dachser
Additional Benefits:
- The market estimate (ME) sheet in Excel format
- 3 months of analyst support
TABLE OF CONTENTS
1 Introduction
- 1.1 Study Assumptions & Market Definition
- 1.2 Scope of the Study
2 Research Methodology
3 Executive Summary
4 Market Landscape
- 4.1 Market Overview
- 4.2 Market Drivers
- 4.2.1 Scale Deployment of Autonomous Delivery Robots and Drones
- 4.2.2 Growth of Resale / Circular Retail Spurring Reverse-Logistics Platforms
- 4.2.3 Subscription-Commerce Models Stabilizing Delivery Demand
- 4.2.4 Cold-Chain Build-out for Fresh Grocery E-commerce
- 4.2.5 Blockchain-based Traceability Mandates from Major Brands
- 4.2.6 Retail Media Networks Driving Data-Centric Inventory Positioning
- 4.3 Market Restraints
- 4.3.1 Volatile Cross-Border Tariffs Impacting Route Economics
- 4.3.2 Warehouse Real-Estate Scarcity in Tier-1 Metros Inflating 3Pl Costs
- 4.3.3 ESG Audit Pressures Elevating Emissions-Measurement Capex
- 4.3.4 AI-Skills Shortage Delaying Digital-Twin Roll-Outs
- 4.4 Value / Supply-Chain Analysis
- 4.5 Government Regulations and Policies
- 4.6 Technological Innovations in the Industry
- 4.7 Impact of Geopolitical Events on the Market
- 4.8 Porter's Five Forces
- 4.8.1 Competitive Rivalry
- 4.8.2 Threat of New Entrants
- 4.8.3 Bargaining Power of Suppliers
- 4.8.4 Bargaining Power of Buyers
- 4.8.5 Threat of Substitutes
5 Market Size & Growth Forecasts (Value)
- 5.1 By Service Type
- 5.1.1 Transportation
- 5.1.1.1 Road
- 5.1.1.2 Rail
- 5.1.1.3 Air
- 5.1.1.4 Sea and Inland Waterway
- 5.1.2 Warehousing & Distribution
- 5.1.3 Value-Added Services
- 5.1.1 Transportation
- 5.2 By Product
- 5.2.1 Foods and Beverages
- 5.2.2 Personal and Household Care
- 5.2.3 Fashion and Lifestyle (accessories, apparel, footwear)
- 5.2.4 Furniture
- 5.2.5 Electronics and Household Appliances
- 5.2.6 Other Products
- 5.3 By Distribution Channel
- 5.3.1 Super/Hyper/Convenience and Department Stores
- 5.3.2 Specialty Stores
- 5.3.3 Online
- 5.3.4 Other Channels
- 5.4 By Geography
- 5.4.1 North America
- 5.4.1.1 United States
- 5.4.1.2 Canada
- 5.4.1.3 Mexico
- 5.4.2 South America
- 5.4.2.1 Brazil
- 5.4.2.2 Peru
- 5.4.2.3 Chile
- 5.4.2.4 Argentina
- 5.4.2.5 Rest of South America
- 5.4.3 Asia-Pacific
- 5.4.3.1 India
- 5.4.3.2 China
- 5.4.3.3 Japan
- 5.4.3.4 Australia
- 5.4.3.5 South Korea
- 5.4.3.6 South East Asia (Singapore, Malaysia, Thailand, Indonesia, Vietnam, and Philippines)
- 5.4.3.7 Rest of Asia-Pacific
- 5.4.4 Europe
- 5.4.4.1 United Kingdom
- 5.4.4.2 Germany
- 5.4.4.3 France
- 5.4.4.4 Spain
- 5.4.4.5 Italy
- 5.4.4.6 BENELUX (Belgium, Netherlands, and Luxembourg)
- 5.4.4.7 NORDICS (Denmark, Finland, Iceland, Norway, and Sweden)
- 5.4.4.8 Rest of Europe
- 5.4.5 Middle East And Africa
- 5.4.5.1 United Arab Emirates
- 5.4.5.2 Saudi Arabia
- 5.4.5.3 South Africa
- 5.4.5.4 Nigeria
- 5.4.5.5 Rest of Middle East and Africa
- 5.4.1 North America
6 Competitive Landscape
- 6.1 Market Concentration
- 6.2 Strategic Moves
- 6.3 Market Share Analysis
- 6.4 Company Profiles (includes Global level Overview, Market level overview, Core Segments, Financials as available, Strategic Information, Market Rank/Share for key companies, Products & Services, and Recent Developments)
- 6.4.1 DHL Supply Chain & Global Forwarding
- 6.4.2 UPS Supply Chain Solutions
- 6.4.3 FedEx Logistics
- 6.4.4 XPO Logistics
- 6.4.5 Kuehne + Nagel International
- 6.4.6 C.H. Robinson Worldwide
- 6.4.7 JD Logistics
- 6.4.8 Cainiao (Alibaba Logistics)
- 6.4.9 SF Express
- 6.4.10 Geodis
- 6.4.11 DSV A/S
- 6.4.12 Rakuten Super Logistics
- 6.4.13 GXO Logistics
- 6.4.14 Aramex
- 6.4.15 CEVA Logistics
- 6.4.16 Ryder Supply Chain Solutions
- 6.4.17 Hellmann Worldwide Logistics
- 6.4.18 Nippon Express
- 6.4.19 J.B. Hunt Transport Services
- 6.4.20 Dachser
7 Market Opportunities & Future Outlook
 美國零售物流:市場佔有率分析、行業趨勢和統計數據、成長預測(2026-2031 年)
 零售物流市場:依運輸方式、通路、服務類型、顧客類型及產品類型分類-2026-2032年全球市場預測
 2026年全球零售物流市場報告2026年全球家具物流市場報告
 零售物流市場規模、佔有率和成長分析(按類型、解決方案、運輸方式和地區分類)-2026-2033年產業預測
 零售物流的印度市場評估,類別,各解決方案,運輸模式別,各地區,機會,預測,2019年~2033年零售物流市場:各類型,各解決方案,各運輸方法,各地區,機會,預測,2018年~2032年
 全球零售物流市場
 零售物流市場、機會、成長動力、產業趨勢分析與預測,2024-2032