

 |
市場調查報告書
商品編碼
2062034
飼料用甲硫胺酸添加劑:市場佔有率分析、產業趨勢與統計及成長預測(2026-2031)Feed Methionine Additive - Market Share Analysis, Industry Trends & Statistics, Growth Forecasts (2026 - 2031) |
||||||
※ 本網頁內容可能與最新版本有所差異。詳細情況請與我們聯繫。
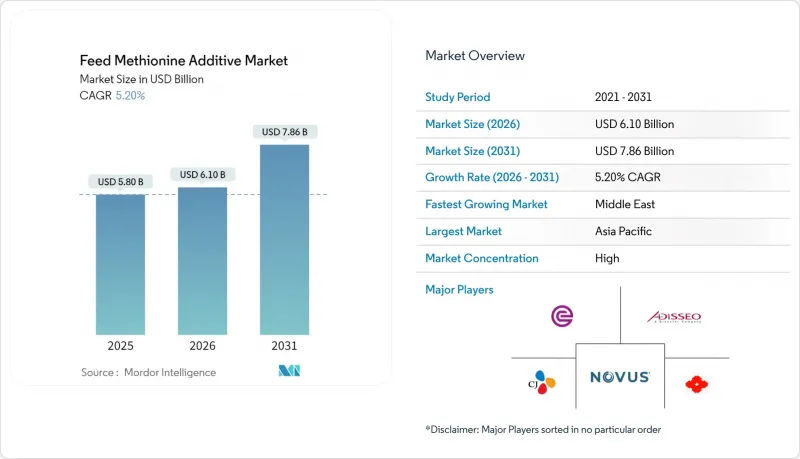
根據 Mordor Intelligence 預測,飼料用甲硫胺酸添加劑的市場規模預計將從 2025 年的 58 億美元成長到 2026 年的 61 億美元,到 2031 年達到 78.6 億美元,2026 年至 2031 年的年複合成長率(CAGR)為 5.2%。
本報告按產品類型(DL-甲硫胺酸、L-甲硫胺酸、甲硫胺酸羥基類似物(MHA)等)、劑型(粉末/顆粒、液體)、原料(石油化工、生物基)、目標動物(家禽、豬、反芻動物、水產養殖等)和地區(北美、歐洲、亞太等)進行細分。市場預測以美元(USD)計價。
全球市場趨勢及飼料用甲硫胺酸添加劑的洞察。
全球禽肉生產擴張
受都市區消費者對價格適中的動物性蛋白質需求所驅動,全球家禽產量持續成長。聯合國糧食及農業組織(糧農組織)預測,亞太地區和南美洲的家禽產量將穩定成長,這與肉雞養殖設施的擴張和甲硫胺酸用量的增加密切相關。養殖設施的升級改造優先採用含硫氨基酸含量較低的經濟型植物蛋白,從而增加了甲硫胺酸的添加量以維持飼料轉換率。 2024年,贏創營運公司在新加坡運作了一條年產4萬噸的DL-甲硫胺酸生產線。一體化家禽養殖戶正在利用即時軟體來實現每日甲硫胺酸目標。
水產養殖集約化進展
魚蝦養殖場正擴大用大豆和菜籽油取代魚粉,這導致甲硫胺酸供應不足。一項針對太平洋白蝦的研究表明,將飼料中甲硫胺酸含量提高到0.69%至0.82%可將魚粉用量從18%減少到6%,且不會對產量產生負面影響,投資收益(ROI)高達33.2%。目前,越南的蝦場和挪威的鮭魚場正在使用甲硫胺酸或液態甲硫胺酸來防止蛋氨酸滲漏。供應商正在提供微膠囊化產品,該產品可在攝取後溶解,從而將飼料甲硫胺酸添加劑市場拓展到高密度循環水產養殖系統。
石化原料價格波動劇烈
2025年初,紅海運輸中斷導致硫磺和丙烯醛價格上漲。由於合約條款反映原物料價格波動存在時間滯後,這影響了甲硫胺酸的利潤率。硫酸銨的肥料收入在一定程度上抵消了這些影響。然而,如果硫磺和甲硫胺酸價格同時下跌,小規模生產商將面臨困境。雖然像Bluestar Adisseo這樣的大型綜合企業能夠內部管理原料風險以維持生產水平,但獨立加工商往往會推遲維護或降低運轉率,從而限制飼料甲硫胺酸添加劑市場的新增供應。
細分市場分析
預計到2025年,DL-甲硫胺酸將佔飼料甲硫胺酸添加劑市場46%的佔有率。甲硫胺酸羥基類似物(MHA)市場預計在2026年至2031年間以7.8%的複合年成長率成長,這主要得益於液態MHA的廣泛應用,使其更易於在高密度肉雞和蝦類養殖系統中施用。 L-甲硫胺酸因其天然存在的異構體能夠提高消化率,在水產養殖專用飼料中尤為有效。然而,其高昂的生產成本限制了其市場佔有率的擴張。
隨著自動化程度的提高,市場需求正轉向能夠與監控軟體配合使用的液態產品。為了滿足這一趨勢,藍星安迪蘇(Bluestar Adisseo)已提升其位於南京的液態產品生產線的產能。在液態產品基礎設施不完善的地區,DL-甲硫胺酸仍然至關重要,因為它可以與其他飼料添加劑混合裝袋或桶運輸。然而,在年產量高的飼料廠,液態系統的高投資報酬率正在推動其應用,並提升MHA在飼料甲硫胺酸添加劑市場的滲透率。對於需要持續釋放營養物質的水生生物而言,包覆或包覆產品仍然十分重要,這為能夠客製化顆粒形態的生產商創造了一個利基但穩定的商機。
在2025年的飼料甲硫胺酸添加劑市場中,粉末和顆粒佔最大佔有率,達64%。然而,受自動化工廠的推動,預計2026年至2031年間,液態甲硫胺酸市場將以7.5%的複合年成長率快速成長。這些工廠傾向於使用線上泵,以便在不中斷生產的情況下實現微米級精度的分配。此外,液態甲硫胺酸作為合規措施也越來越受歡迎,因為它能最大限度地減少可吸入粉塵,而可吸入粉塵是美國和歐盟職業安全審核的關鍵要素。
在基礎設施低度開發地區,粉劑仍然佔據主導地位,因為飼料運輸車需要為多個小規模農場供貨。袋裝粉劑使工廠能夠根據需求波動調整批量大小,而無需擔心保存期限或泵浦維護。對於長途海運而言,粉末更受歡迎,因為與某些液體劑型所需的冷藏桶相比,每公斤活性成分的運費更低。然而,隨著產業結構調整將生產轉移到大規模工廠,液體劑型在營運方面的優勢日益凸顯,其在全球飼料甲硫胺酸添加劑市場的佔有率也逐漸擴大。
區域分析
到2025年,亞太地區將在飼料甲硫胺酸添加劑市場佔據38%的最大市場。 2023年,浙江新和生物技術有限公司與中國石化宣布成立液態甲硫胺酸合資企業,確保了丙烯醛的供應,並展現了雙方在面臨反傾銷挑戰的情況下對長期發展的信心。由於泰國蝦飼料廠的快速自動化以及印度向複合乳牛飼料的轉型,基本客群不斷擴大。儘管環境法規日益嚴格,但地方政府為生物技術產業提供稅收優惠,這抵消了合規成本,並鞏固了亞太地區作為飼料甲硫胺酸添加劑製造地的地位。
中東地區預計將經歷最快成長,2026年至2031年間的複合年成長率將達到8.1%,主要得益於海灣合作理事會波灣合作理事會主權財富基金對糧食舉措的投資。沙烏地阿拉伯的大規模垂直一體化家禽養殖綜合體和阿拉伯聯合大公國的全循環水產養殖系統在工廠建設前就已簽訂銷售契約,從而降低了甲硫胺酸供應商的風險。 2025年紅海航線中斷導致運費飆升,凸顯了長供應鏈的脆弱性,並加速了關於建立區域甲硫胺酸配製中心的討論。
在北美和歐洲,由於畜群已進入成熟期,成長依然緩慢,但高階市場和強制無抗生素養殖方式持續支撐著穩定的需求。 2026年,美國商務部對從西班牙和中國進口甲硫胺酸的調查帶來了不確定性,導致一些飼料整合公司簽訂了多年期國內契約,並設定了固定價差,以降低關稅風險。在歐洲,土地使用限制和嚴格的硫排放法規促使生產商將重點放在分階段消除瓶頸,而不是新建待開發區。
其他好處:
- Excel格式的市場預測(ME)表
- 3個月的分析師支持
目錄
第1章:引言
- 研究假設和市場定義
- 調查範圍
第2章:調查方法
第3章執行摘要
第4章 市場狀況
- 市場概覽
- 市場促進因素
- 全球雞肉生產規模擴大
- 水產養殖集約化進展
- 高階寵物食品需求不斷成長
- 推動制定法規,減少飼料中抗生素的使用。
- 一步發酵可減少資本投入。
- 人工智慧演算法最佳化甲硫胺酸與離胺酸的比例。
- 市場限制因素
- 石化原料價格波動劇烈
- 嚴格的法規正在影響生產過程中的硫排放。
- 由於反傾銷措施,全球供應鏈正面臨日益增加的製裁風險。
- 電解氧化處理廢棄物會產生大量成本。
- 監理情勢
- 技術展望
- 波特五力分析
第5章 市場規模與成長預測
- 依產品類型
- DL-甲硫胺酸
- L-甲硫胺酸
- 甲硫胺酸羥基類似物(MHA)
- 其他產品類型
- 按形式
- 粉末和顆粒
- 液體
- 來源
- 石油化學系統
- 生物基
- 依動物類型
- 家禽
- 豬
- 反芻動物
- 水產養殖
- 寵物食品
- 按地區
- 北美洲
- 美國
- 加拿大
- 墨西哥
- 其他北美國家
- 歐洲
- 德國
- 法國
- 英國
- 西班牙
- 俄羅斯
- 其他歐洲國家
- 亞太地區
- 中國
- 印度
- 日本
- 印尼
- 其他亞太國家
- 南美洲
- 巴西
- 阿根廷
- 其他南美國家
- 中東
- 沙烏地阿拉伯
- 阿拉伯聯合大公國
- 其他中東國家
- 非洲
- 南非
- 埃及
- 其他非洲國家
- 北美洲
第6章 競爭情勢
- 市場集中度
- 策略趨勢
- 市佔率分析
- 公司簡介
- Evonik Industries AG
- Adisseo Animal Nutrition Private Limited
- Novus International, Inc.
- CJ CheilJedang Corporation
- Sumitomo Chemical Co., Ltd.
- Zhejiang NHU Co., Ltd.
- Sichuan Hebang Biotechnology Co., Ltd.
- Chongqing Unisplendour Chemical Co., Ltd.
- Ningxia Eppen Biotech Co., Ltd.
- Volzhsky Orgsynthese, JSC
- Ajinomoto Co., Inc.
- Kemin Industries, Inc.
- Phibro Animal Health Corporation
- Archer Daniels Midland Company
- Prinova Group LLC
第7章 市場機會與未來展望
According to Mordor Intelligence, the feed methionine additive market size is projected to grow from USD 5.80 billion in 2025 to USD 6.10 billion in 2026, reaching USD 7.86 billion by 2031, with a CAGR of 5.2% during 2026-2031.
This report is Segmented by Product Type (DL-Methionine, L-Methionine, Methionine Hydroxy Analog (MHA), and More), by Form (Powder and Granules, and Liquid), by Source (Petrochemical-Based, and Bio-Based), by Animal Type (Poultry, Swine, Ruminants, Aquaculture, and More), and by Geography (North America, Europe, Asia-Pacific, and More). The Market Forecasts are Provided in Terms of Value (USD).
Global Feed Methionine Additive Market Trends and Insights
Escalating Global Poultry Meat Production
Global chicken production continues to rise, driven by urban consumers' demand for affordable animal protein. The Food and Agriculture Organization (FAO) forecasts steady growth in Asia-Pacific and South America, linking broiler facility expansion to higher methionine usage. Facility upgrades prioritize cost-effective plant proteins low in sulfur amino acids, prompting increased methionine supplementation to maintain feed-conversion ratios. In 2024, Evonik Operations GmbH commissioned a 40,000 metric ton per annum DL-Methionine line in Singapore. Integrators rely on real-time software to meet daily methionine targets.
Growth in Aquaculture Intensification
Fish and shrimp farms are replacing fishmeal with soy and rapeseed, creating methionine deficits that must be addressed. A 2022-2023 study on Pacific white shrimp showed that 0.69-0.82% dietary methionine reduced fishmeal from 18% to 6% without affecting performance, yielding a 33.2% ROI. Shrimp ponds in Vietnam and salmon cages in Norway now use coated or liquid methionine variants to resist leaching. Suppliers are offering micro-encapsulated grades that dissolve upon ingestion, helping the feed methionine additive market expand into high-density recirculating systems.
Volatile Petrochemical Feedstock Prices
Sulfur and acrolein increase in early 2025 due to shipping disruptions in the Red Sea. Methionine margins were affected as contract formulas incorporate raw material price changes with a delay. Fertilizer revenue from ammonium sulfate helps offset such impacts. However, when both sulfur and methionine prices decline simultaneously, smaller producers encounter difficulties. Large integrated companies, such as Bluestar Adisseo Company, manage feedstock risks internally to sustain production levels, whereas independent processors often postpone maintenance or lower operating rates, restricting new supply additions to the feed methionine additive market.
Other drivers and restraints analyzed in the detailed report include:
- Rising Demand for Premium Pet Food
- Regulatory Push for Reduced Antibiotic Usage in Feed
- Strict Regulations Impact Sulfur Emissions in Production
For complete list of drivers and restraints, kindly check the Table Of Contents.
Segment Analysis
DL-Methionine is accounted for 46% of the feed methionine additive market by 2025. The Methionine Hydroxy Analog (MHA) market size is projected to grow at a CAGR of 7.8% from 2026 to 2031, driven by the adoption of liquid grades that facilitate dosing in high-density broiler and shrimp systems. L-Methionine is particularly effective in specialty aquaculture diets due to its natural isomer, which enhances digestibility. However, its high production cost limits its market share.
As automation continues to expand, the demand is shifting toward liquid products that integrate with supervisory control software. Bluestar Adisseo Company has increased the capacity of its Nanjing liquid production line to align with this trend. DL-Methionine remains essential in regions without liquid infrastructure, as it can be transported in sacks and big bags alongside other feed additives via mixed freight. However, for feed mills with higher annual output, the return on investment for a liquid system encourages adoption and increases MHA penetration in the feed methionine additive market. Encapsulated or coated variants remain significant for aquatic species requiring slow nutrient release, creating niche but stable revenue opportunities for producers capable of customizing particle morphology.
Powder and granules accounted for the largest share, 64%, of the feed methionine additive market size in 2025. However, liquid methionine market size is projected to grow at the fastest rate, with a CAGR of 7.5% from 2026 to 2031, driven by its adoption in automated mills. These mills favor inline pumps that deliver precise micron-level volumes without interrupting production. Liquid methionine minimizes respirable dust, a critical factor in occupational safety audits in the United States and European Union, enhancing its appeal as a compliance solution.
Powders remain prevalent in regions with fragmented infrastructure, where feed trucks supply multiple small farms. Bagged powders enable mills to align batch sizes with demand fluctuations without concerns about shelf life or pump maintenance. Long-haul maritime transport favors powders due to lower freight costs per active kilogram compared to the refrigerated drums required for certain liquid forms. However, as industry consolidation shifts more production to large-scale mills, the operational advantages increasingly favor liquids, gradually increasing their share in the global feed methionine additive market.
Geography Analysis
Asia-Pacific accounted for the largest 38% market share of the feed methionine additive market in 2025. Zhejiang NHU Co., Ltd. and Sinopec announced a joint venture for liquid methionine in 2023, ensuring acrolein supply and reflecting long-term confidence despite anti-dumping challenges. In Thailand, rapid automation in shrimp feed mills and India's shift toward compound dairy rations have expanded the customer base. While environmental regulations are becoming stricter, local governments are offering tax incentives to biotechnology, helping offset compliance costs and reinforcing Asia-Pacific's position as the manufacturing hub for feed methionine additives.
The Middle East is projected to achieve the fastest growth, with a CAGR of 8.1% from 2026 to 2031, as Gulf Cooperation Council countries invest sovereign funds in food-security initiatives. Large vertically integrated poultry complexes in Saudi Arabia and full-recirculation aquaculture systems in the United Arab Emirates are securing offtake agreements before plant construction, reducing risks for methionine suppliers. Freight cost spikes during the 2025 Red Sea disruptions highlighted the vulnerability of long supply chains, accelerating discussions on establishing regional methionine formulation hubs.
In North America and Europe, growth remains moderate due to mature livestock inventories, but premium segments and antibiotic-free mandates continue to support consistent demand. In 2026, the United States Department of Commerce's investigation into Spanish and Chinese methionine imports created uncertainty, prompting some feed integrators to secure multi-year domestic contracts with fixed spreads to mitigate tariff risks. In Europe, producers are focusing on incremental debottlenecking rather than new greenfield projects, constrained by land-use limitations and stringent sulfur regulations.
- Evonik Industries AG
- Adisseo Animal Nutrition Private Limited
- Novus International, Inc.
- CJ CheilJedang Corporation
- Sumitomo Chemical Co., Ltd.
- Zhejiang NHU Co., Ltd.
- Sichuan Hebang Biotechnology Co., Ltd.
- Chongqing Unisplendour Chemical Co., Ltd.
- Ningxia Eppen Biotech Co., Ltd.
- Volzhsky Orgsynthese, JSC
- Ajinomoto Co., Inc.
- Kemin Industries, Inc.
- Phibro Animal Health Corporation
- Archer Daniels Midland Company
- Prinova Group LLC
Additional Benefits:
- The market estimate (ME) sheet in Excel format
- 3 months of analyst support
TABLE OF CONTENTS
1 Introduction
- 1.1 Study Assumptions and Market Definition
- 1.2 Scope of the Study
2 Research Methodology
3 Executive Summary
4 Market Landscape
- 4.1 Market Overview
- 4.2 Market Drivers
- 4.2.1 Escalating global poultry meat production
- 4.2.2 Growth in aquaculture intensification
- 4.2.3 Rising demand for premium pet food
- 4.2.4 Regulatory push for reduced antibiotic usage in feed
- 4.2.5 Single-step fermentation reduces capital expenditure
- 4.2.6 AI-driven algorithms optimize methionine-to-lysine ratios
- 4.3 Market Restraints
- 4.3.1 Volatile petrochemical feedstock prices
- 4.3.2 Strict regulations impact sulfur emissions in production
- 4.3.3 Global supply chains increase exposure to anti-dumping penalties
- 4.3.4 Electrolytic oxidation waste management adds significant costs
- 4.4 Regulatory Landscape
- 4.5 Technological Outlook
- 4.6 Porter's Five Forces Analysis
- 4.6.1 Threat of New Entrants
- 4.6.2 Bargaining Power of Buyers
- 4.6.3 Bargaining Power of Suppliers
- 4.6.4 Threat of Substitutes
- 4.6.5 Intensity of Competitive Rivalry
5 Market Size and Growth Forecasts (Value)
- 5.1 By Product Type
- 5.1.1 DL-Methionine
- 5.1.2 L-Methionine
- 5.1.3 Methionine Hydroxy Analog (MHA)
- 5.1.4 Other Product Types
- 5.2 By Form
- 5.2.1 Powder and Granules
- 5.2.2 Liquid
- 5.3 By Source
- 5.3.1 Petrochemical-based
- 5.3.2 Bio-based
- 5.4 By Animal Type
- 5.4.1 Poultry
- 5.4.2 Swine
- 5.4.3 Ruminants
- 5.4.4 Aquaculture
- 5.4.5 Pet Food
- 5.5 By Geography
- 5.5.1 North America
- 5.5.1.1 United States
- 5.5.1.2 Canada
- 5.5.1.3 Mexico
- 5.5.1.4 Rest of North America
- 5.5.2 Europe
- 5.5.2.1 Germany
- 5.5.2.2 France
- 5.5.2.3 United Kingdom
- 5.5.2.4 Spain
- 5.5.2.5 Russia
- 5.5.2.6 Rest of Europe
- 5.5.3 Asia-Pacific
- 5.5.3.1 China
- 5.5.3.2 India
- 5.5.3.3 Japan
- 5.5.3.4 Indonesia
- 5.5.3.5 Rest of Asia-Pacific
- 5.5.4 South America
- 5.5.4.1 Brazil
- 5.5.4.2 Argentina
- 5.5.4.3 Rest of South America
- 5.5.5 Middle East
- 5.5.5.1 Saudi Arabia
- 5.5.5.2 United Arab Emirates
- 5.5.5.3 Rest of Middle East
- 5.5.6 Africa
- 5.5.6.1 South Africa
- 5.5.6.2 Egypt
- 5.5.6.3 Rest of Africa
- 5.5.1 North America
6 Competitive Landscape
- 6.1 Market Concentration
- 6.2 Strategic Moves
- 6.3 Market Share Analysis
- 6.4 Company Profiles (Includes Global level Overview, Market level overview, Core Segments, Financials as available, Strategic Information, Market Rank/Share for key companies, Products and Services, and Recent Developments)
- 6.4.1 Evonik Industries AG
- 6.4.2 Adisseo Animal Nutrition Private Limited
- 6.4.3 Novus International, Inc.
- 6.4.4 CJ CheilJedang Corporation
- 6.4.5 Sumitomo Chemical Co., Ltd.
- 6.4.6 Zhejiang NHU Co., Ltd.
- 6.4.7 Sichuan Hebang Biotechnology Co., Ltd.
- 6.4.8 Chongqing Unisplendour Chemical Co., Ltd.
- 6.4.9 Ningxia Eppen Biotech Co., Ltd.
- 6.4.10 Volzhsky Orgsynthese, JSC
- 6.4.11 Ajinomoto Co., Inc.
- 6.4.12 Kemin Industries, Inc.
- 6.4.13 Phibro Animal Health Corporation
- 6.4.14 Archer Daniels Midland Company
- 6.4.15 Prinova Group LLC
7 Market Opportunities and Future Outlook
 全球特種飼料添加劑市場
 印度飼料添加劑:市場佔有率分析、產業趨勢與統計及成長預測(2026-2031)
 全球飼料添加劑市場:按類型、功能、最終用戶、動物種類、來源、形態和地區分類-預測至2031年
 飼料添加劑市場規模、佔有率和成長分析(按類型、畜種、成分、形態、功能和地區分類)—產業預測(2026-2033 年)
 特種飼料添加劑市場(按類型、動物、產地、形態、功能、製造技術和地區分類)-預測至2030年
 飼料添加劑市場-全球產業規模、佔有率、趨勢、機會及預測(按成分類型、牲畜、形態、地區和競爭情況細分,2020-2030 年)
 中國飼料添加劑市場:依產品種類、牲畜、來源、形式、最終用戶、地區、機會、預測,2017-2031年日本飼料添加劑市場評估:依產品類型、牲畜、原料、格式、最終用戶和地區劃分的機會和預測(2018-2032)全球飼料添加劑市場評估:依產品類型、牲畜、原料、形式、最終用戶、地區、機會、預測(2017-2031)印度飼料添加劑市場評估:依產品類型、牲畜、原料、形式、最終用戶、地區、機會、預測(2018 財年-2032 財年)