


 |
市場調查報告書
商品編碼
2061615
美國垂直農業:市場佔有率分析、產業趨勢與統計及成長預測(2026-2031 年)United States Vertical Farming - Market Share Analysis, Industry Trends & Statistics, Growth Forecasts (2026 - 2031) |
||||||

※ 本網頁內容可能與最新版本有所差異。詳細情況請與我們聯繫。
據 Mordor Intelligence 稱,美國垂直農業市場在 2025 年的價值為 15 億美元,預計到 2031 年將達到 26 億美元,而 2026 年為 16 億美元,在 2026 年至 2031 年的預測期內,複合年成長率為 10.6%。
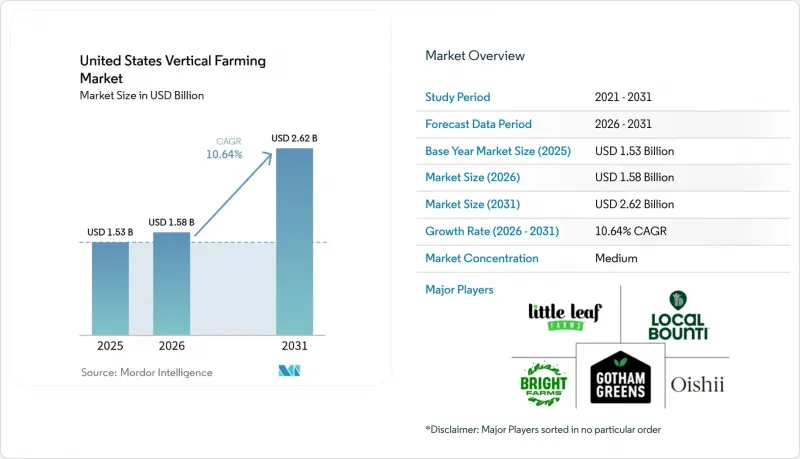
本報告依生長機制(水耕、氣耕、魚菜共生)、結構(建築型、倉庫型、貨櫃型)、作物類型(綠葉類、香草類、微型菜苗等)、組件(硬體、軟體、服務)和最終用戶(零售/超級市場、餐飲服務業等)進行細分。市場預測以美元計價。
美國垂直農業市場的趨勢與洞察
對本地種植、不含農藥的綠葉蔬菜的需求
隨著大型連鎖超市擴大將無農藥農產品作為採購標準,零售需求正在支撐美國垂直農業市場的發展。室內農場始終滿足無農藥和無除草劑的要求,並且全年產量都優於露天種植者和許多溫室種植者。聯邦政府的舉措進一步推動了零售商期望的實現。例如,美國農業部 (USDA) 於 2025 年 1 月宣布撥款 1,440 萬美元,用於城市農業和創新生產的新津貼,使自 2020 年以來的撥款總額達到 5,370 萬美元。這些進展正在增強包裝沙拉和切塊蔬菜類別的合約透明度、零售關係和價格紀律。透過降低室內種植的綠葉類蔬菜在景氣衰退時期被視為「可有可無」商品的風險,市場關注點正在轉向零售品類管理和供應保障。這種相互關聯的需求模式凸顯了美國垂直農業市場對穩定零售夥伴關係的日益依賴,而非消費者對新奇產品的偏好。
透過當日送達減少食品運輸里程並確保新鮮度。
縮短運輸距離正在提升美國垂直農業市場的效率,有效解決了綠葉類在長途國內運輸過程中新鮮度大幅下降的問題。來自加州和亞利桑那州的傳統農產品通常需要4-6天才能運抵東部零售網路,這限制了門市的供應量和消費者的購買機會。相較之下,位於主要城市200英里範圍內的室內農場可以在採摘後24小時內送達,從而將零售展示時間延長5-7天。 Wang等人於2025年9月發表的一項研究表明,本地採購可減少18-22%的採後呼吸損失,直接提高零售商的利潤率並降低降價。這項轉變凸顯了「當日送達,新鮮如初」為何正從單純的行銷訊息演變為都市區配送路線中的合約標準,從而鞏固了本地室內農業的合法性。
電力消耗量和電價的波動給利潤率帶來了壓力。
由於依賴照明、氣候控制和除濕等高能耗系統,電力是美國垂直農業市場的主要成本因素。 Kaiser等人2024年的報告估計,電力成本佔生產成本的20%至40%,其中照明就消耗了總電力消耗量的60%至85%。根據AGEYE 2025年的研究結果,施工前的財務模型通常低估了暖通空調(HVAC)和除濕成本30%至50%,導致成本假設過於樂觀。 2026年發表在《自然通訊》上的一項研究發現,大多數垂直農場的能源閾值。雖然動態照明控制可以降低12%的電力成本,但維修舊設施的高昂成本往往不切實際。因此,市場,特別是中西部和東北部的市場,更容易受到電力價格波動的影響,這凸顯了引入可再生能源、儲能系統和高效技術的迫切需要,以穩定成本並提高競爭力。
細分市場分析
到2025年,水耕技術將主導美國垂直農業市場,佔56.8%的佔有率。這主要得益於其與綠葉蔬菜的兼容性、成熟的水耕系統以及易於融入現有室內農場佈局。水耕技術能夠提供可預測的產量和標準化的種植週期,這與零售商對生菜和菠菜等主要商業作物的需求相契合。然而,水耕技術的普及正在模糊產品差異化,使得規模、執行和客戶通路對成功而言變得更加重要。
氣耕正迅速成為成長最快的耕作方式,預計從2026年到2031年將以16%的複合年成長率成長。這主要歸功於其高效性——用水量比水耕法減少70%至95%——以及改善根區氧氣供應,這對高價值、對水分敏感的作物尤其有利。諸如Local Bounti公司於2026年2月獲得專利的人工智慧輔助混合系統等創新技術,展現了耕作方式日益增強的柔軟性,促使業者不斷最佳化產量。魚菜共生由於需要同時管理植物和魚類的生物特性,操作較為複雜,目前仍屬於小眾市場,但它已被應用於機構和製藥行業等專業市場,在這些市場中,可追溯性和閉合迴路生產能夠提升價值。所有這些耕作方式都反映出市場正朝著效率、創新和針對性應用的方向發展,以滿足多樣化的需求。
預計到2025年,建築型農場將占美國垂直農業市場總值的68.6%,是該市場中最大的結構類型。建築型農場不僅能夠將現有倉庫和工業空間改造為大規模生產場所,而且透過高密度多層佈局和嚴格的環境控制,還能確保高產量。這些優勢對於滿足國家和地區層級的零售合約至關重要。此外,建築型農場的擴充性使營運商能夠將固定成本分攤到更高的產量上,從而鞏固其在市場中的中心地位。
同時,貨櫃農場預計將在2026年至2031年間以12.2%的複合年成長率成長,成為成長最快的結構類型。其模組化和快速部署能力使其成為食品沙漠地區、軍事設施和機構園區等不適合永久性建設場所的理想選擇。例如,Opolo Farms於2025年在鳳凰城部署的自動化立方體農場就展示了貨櫃系統如何透過緊湊的自動化解決方案來應對勞動力和空間限制。在這兩種形式之間,倉庫式農場的種植能力優於貨櫃農場,但其建築密度低於專用多層建築。這些結構類型反映了市場正在努力平衡大規模區域中心和小規模模組化單元,推動美國垂直農業市場朝向多元化和適應性強的解決方案發展。
其他好處:
- Excel格式的市場預測(ME)表
- 3個月的分析師支持
目錄
第1章:引言
- 研究假設和市場定義
- 調查範圍
第2章:調查方法
第3章執行摘要
第4章 市場狀況
- 市場概覽
- 市場促進因素
- 對本地生產、不含農藥蔬菜的需求
- 透過當日送達減少食品運輸里程並確保新鮮度
- 西部地區乾旱壓力下的節水生產
- 零售商對全年穩定供應的需求
- 可再生能源和微電網合約提高了經濟效率。
- 人工智慧視覺、授粉技術和栽培配方能夠實現高品質果樹栽培。
- 市場限制因素
- 農作物盈利仍集中在綠葉蔬菜和香草。
- 電力成本比率和電力價格波動對利潤率造成的壓力
- 破產後的資金籌措缺口推高了資本成本。
- 州和地方政府的規劃、許可和電網連接非常複雜。
- 監理情勢
- 技術展望
- 波特五力分析
第5章 市場規模與成長預測
- 透過生長機制
- 水耕法
- 氣耕
- 水耕法
- 按結構
- 建築型垂直農場
- 倉庫式垂直農場
- 貨櫃式垂直農場
- 按作物類型
- 綠葉蔬菜
- 草藥
- 微型菜苗
- 水果和漿果
- 花卉和觀賞植物
- 按組件
- 硬體
- 照明系統
- 暖通空調和空調控制
- 感測器和監測
- 灌溉和養分供應
- 貨架、托盤和輸送裝置
- 電源和備用系統
- 軟體
- 農業作業系統
- 人工智慧和電腦視覺
- 工作流程、ERP 和可追溯性
- 服務
- 設計與整合
- 維護和農業支持
- 管理營運
- 硬體
- 最終用戶
- 零售商店和超級市場
- 食品服務業
- D2C 和電子商務
- 機構和政府
- 醫藥和化妝品原料採購商
第6章 競爭情勢
- 市場集中度
- 策略趨勢
- 市佔率分析
- 公司簡介
- Little Leaf Farms, LLC
- Gotham Greens Holdings, LLC
- BrightFarms Inc.(Cox Enterprises, Inc.)
- Oishii Farm Corporation
- Local Bounti Corporation
- Plenty Unlimited Inc.
- AeroFarms, Inc.
- 80 Acres Farms, Inc.
- Square Roots, Inc.
- Farm.One, Inc.
- American Hydroponics, Inc.
- Argus Control Systems Limited
- Priva Holding BV
- Netafim Ltd.(Orbia Advance Corporation, SAB de CV)
- Fluence Bioengineering, Inc.(ams-OSRAM AG)
第7章 市場機會與未來展望
According to Mordor Intelligence, the united states vertical farming market size was valued at USD 1.5 billion in 2025 and is estimated to grow from USD 1.6 billion in 2026 to reach USD 2.6 billion by 2031, at a CAGR of 10.6% during the forecast period 2026-2031.
This report is Segmented by Growth Mechanism (Hydroponics, Aeroponics, and Aquaponics), by Structure (Building-Based, Warehouse, and Container), by Crop Type (Leafy Greens, Herbs, Microgreens, and More), by Component (Hardware, Software, and Services), and by End User (Retail and Supermarkets, Foodservice, and More). The Market Forecasts are Provided in Terms of Value (USD).
United States Vertical Farming Market Trends and Insights
Demand for Local Pesticide-Free Greens
Retail demand is anchoring the United States vertical farming market, as major grocery chains increasingly treat pesticide-free produce as a procurement standard. Indoor farms consistently meet zero-pesticide and no-herbicide requirements, outperforming field growers and many greenhouse suppliers across seasons. This alignment with retail expectations is further supported by federal initiatives, such as the USDA's January 2025 announcement of USD 14.4 million in new Urban Agriculture and Innovative Production grants, bringing total commitments since 2020 to USD 53.7 million. These developments strengthen contract visibility, retailer relationships, and pricing discipline in packaged salads and fresh-cut categories. By reducing the risk that indoor greens are treated as discretionary products during economic downturns, the market is shifting its focus to retail category management and supply assurance. This interconnected demand pattern underscores the United States vertical farming market's growing reliance on stable retail partnerships rather than consumer novelty preferences.
Food-Mile Reduction and Same-Day Freshness
Shorter delivery distances are driving efficiency in the United States vertical farming market by addressing the significant shelf-life losses leafy greens face during long cross-country transit. Conventional produce from California and Arizona often takes 4 to 6 days to reach eastern retail networks, leaving limited time for store handling and consumer purchase. In contrast, indoor farms within 200 miles of major cities can deliver produce within 24 hours of harvest, extending retail shelf life by 5 to 7 days. A September 2025 study by Wang and coauthors highlighted that proximity sourcing reduced postharvest respiration losses by 18% to 22%, directly improving retailer margins and reducing markdowns. This shift underscores why same-day freshness is evolving from a marketing message to a contractual standard in urban distribution corridors, solidifying the case for regional indoor farming.
Power Intensity and Electricity-Price Volatility Pressure Margins
Electricity is a major cost driver for the United States vertical farming market due to the reliance on energy-intensive systems like lighting, climate control, and dehumidification. In 2024, Kaiser and coauthors reported that electricity constitutes 20% to 40% of production costs, with lighting alone consuming 60% to 85% of total electricity. AGEYE's 2025 findings showed that pre-build financial models often underestimate HVAC and dehumidification costs by 30% to 50%, leading to weaker cost assumptions. A 2026 study in Nature Communications found that most vertical farms exceed the energy-intensity threshold for carbon-competitive positioning against traditional imports. While dynamic lighting can cut electricity costs by 12%, retrofitting older facilities is often unaffordable. This leaves the market vulnerable to tariff volatility, particularly in the Midwest and Northeast, highlighting the urgent need for renewable energy adoption, storage systems, and efficient technologies to stabilize costs and enhance competitiveness.
Other drivers and restraints analyzed in the detailed report include:
- Water-Efficient Production under Western Drought Pressure
- AI Vision, Pollination, and Crop Recipes Enable Premium Fruit Crops
- Post-Bankruptcy Financing Gap Raises Cost of Capital
For complete list of drivers and restraints, kindly check the Table Of Contents.
Segment Analysis
Hydroponics dominated the United States vertical farming market with a 56.8% share in 2025, driven by its compatibility with leafy greens, established nutrient systems, and ease of integration into existing indoor farm layouts. Its ability to deliver predictable outputs and standardized crop cycles aligns with retailer demand for crops like lettuce and spinach, which remain the top commercial products. However, the widespread adoption of hydroponics has reduced product differentiation, making operational scale, execution, and customer access more critical for success.
Aeroponics, with a projected 16% CAGR during 2026-2031, is emerging as the fastest-growing mechanism due to its efficient water usage, 70% to 95% less than hydroponics, and enhanced root-zone oxygenation, which benefits high-value, water-sensitive crops. Innovations like Local Bounti's AI-assisted hybrid system, patented in February 2026, highlight the increasing flexibility of growth methods as operators optimize throughput. While aquaponics remains a niche due to its operational complexity in managing both plant and fish biology, it serves specialized markets like institutional and pharmaceutical channels, where traceability and closed-loop production add value. Together, these mechanisms reflect a market evolving towards efficiency, innovation, and targeted applications to meet diverse demands.
Building-based farms accounted for 68.6% of the 2025 market value, making them the largest structure type in the United States vertical farming market. Their ability to repurpose existing warehouse and industrial spaces for high-volume production, in addition to the dense multi-tier layouts and tighter climate control, ensures higher harvest volumes. These advantages are critical for meeting national and regional retail contracts, and the scalability of building-based formats allows operators to spread fixed costs over greater output, solidifying their central role in the market.
Meanwhile, shipping-container farms, with a projected CAGR of 12.2% during 2026-2031, are emerging as the fastest-growing structure type. Their modular and rapid-deployment capabilities make them ideal for food deserts, military locations, and institutional campuses where permanent construction is less practical. For instance, Opollo Farm's 2025 automated cube deployment in Phoenix demonstrated how container systems can address labor and space constraints through compact, automated solutions. Warehouse-based farms, positioned between these two formats, offer more cultivation volume than containers but lower build intensity compared to purpose-designed multi-level buildings. Together, these structure types reflect a market balancing large regional hubs with smaller, modular units, driving the evolution of the United States vertical farming market toward diverse and adaptable solutions.
List of Companies Covered in this Report:
- Little Leaf Farms, LLC
- Gotham Greens Holdings, LLC
- BrightFarms Inc. (Cox Enterprises, Inc.)
- Oishii Farm Corporation
- Local Bounti Corporation
- Plenty Unlimited Inc.
- AeroFarms, Inc.
- 80 Acres Farms, Inc.
- Square Roots, Inc.
- Farm.One, Inc.
- American Hydroponics, Inc.
- Argus Control Systems Limited
- Priva Holding B.V.
- Netafim Ltd. (Orbia Advance Corporation, S.A.B. de C.V.)
- Fluence Bioengineering, Inc. (ams-OSRAM AG)
Additional Benefits:
- The market estimate (ME) sheet in Excel format
- 3 months of analyst support
TABLE OF CONTENTS
1 Introduction
- 1.1 Study Assumptions and Market Definition
- 1.2 Scope of the Study
2 Research Methodology
3 Executive Summary
4 Market Landscape
- 4.1 Market Overview
- 4.2 Market Drivers
- 4.2.1 Demand for local pesticide-free greens
- 4.2.2 Food-mile reduction and same-day freshness
- 4.2.3 Water-efficient production under western drought pressure
- 4.2.4 Retailer demand for year-round supply resilience
- 4.2.5 Renewable power and microgrid contracting improves economics
- 4.2.6 AI vision, pollination, and crop recipes enable premium fruit crops
- 4.3 Market Restraints
- 4.3.1 Crop profitability remains concentrated in leafy greens and herbs
- 4.3.2 Power intensity and electricity-price volatility pressure margins
- 4.3.3 Post-bankruptcy financing gap raises cost of capital
- 4.3.4 State and local zoning, permitting, and interconnection complexity
- 4.4 Regulatory Landscape
- 4.5 Technological Outlook
- 4.6 Porter's Five Forces Analysis
- 4.6.1 Bargaining Power of Suppliers
- 4.6.2 Bargaining Power of Buyers
- 4.6.3 Threat of New Entrants
- 4.6.4 Threat of Substitutes
- 4.6.5 Intensity of Competitive Rivalry
5 Market Size and Growth Forecasts (Value)
- 5.1 By Growth Mechanism
- 5.1.1 Hydroponics
- 5.1.2 Aeroponics
- 5.1.3 Aquaponics
- 5.2 By Structure
- 5.2.1 Building-based Vertical Farms
- 5.2.2 Warehouse-based Vertical Farms
- 5.2.3 Shipping-Container Vertical Farms
- 5.3 By Crop Type
- 5.3.1 Leafy Greens
- 5.3.2 Herbs
- 5.3.3 Microgreens
- 5.3.4 Fruits and Berries
- 5.3.5 Flowers and Ornamentals
- 5.4 By Component
- 5.4.1 Hardware
- 5.4.1.1 Lighting Systems
- 5.4.1.2 HVAC and Climate Control
- 5.4.1.3 Sensors and Monitoring
- 5.4.1.4 Irrigation and Nutrient Delivery
- 5.4.1.5 Racks, Trays, and Conveyance
- 5.4.1.6 Power and Backup Systems
- 5.4.2 Software
- 5.4.2.1 Farm Operating Systems
- 5.4.2.2 AI and Computer Vision
- 5.4.2.3 Workflow, ERP, and Traceability
- 5.4.3 Services
- 5.4.3.1 Design and Integration
- 5.4.3.2 Maintenance and Agronomy Support
- 5.4.3.3 Managed Operations
- 5.4.1 Hardware
- 5.5 By End User
- 5.5.1 Retail and Supermarkets
- 5.5.2 Foodservice
- 5.5.3 Direct-to-Consumer and E-commerce
- 5.5.4 Institutional and Government
- 5.5.5 Pharmaceutical and Cosmetic Ingredient Buyers
6 Competitive Landscape
- 6.1 Market Concentration
- 6.2 Strategic Moves
- 6.3 Market Share Analysis
- 6.4 Company Profiles (Includes Global Level Overview, Market Level Overview, Core Segments, Financials as Available, Strategic Information, Market Rank/Share for Key Companies, Products and Services, and Recent Developments)
- 6.4.1 Little Leaf Farms, LLC
- 6.4.2 Gotham Greens Holdings, LLC
- 6.4.3 BrightFarms Inc. (Cox Enterprises, Inc.)
- 6.4.4 Oishii Farm Corporation
- 6.4.5 Local Bounti Corporation
- 6.4.6 Plenty Unlimited Inc.
- 6.4.7 AeroFarms, Inc.
- 6.4.8 80 Acres Farms, Inc.
- 6.4.9 Square Roots, Inc.
- 6.4.10 Farm.One, Inc.
- 6.4.11 American Hydroponics, Inc.
- 6.4.12 Argus Control Systems Limited
- 6.4.13 Priva Holding B.V.
- 6.4.14 Netafim Ltd. (Orbia Advance Corporation, S.A.B. de C.V.)
- 6.4.15 Fluence Bioengineering, Inc. (ams-OSRAM AG)
7 Market Opportunities and Future Outlook

 全球垂直農業市場規模、佔有率、趨勢和成長分析報告(2026-2034年)
 到 2034 年,城市垂直農業向超本地化供應市場發展趨勢的市場預測——按作物類型、耕作系統、技術、基礎設施類型、供應模式和地區進行全球分析。
 垂直農業市場:2026-2032年全球市場預測(按產品、照明類型、作物類型、系統、農場規模、安裝類型和最終用戶分類)
 垂直農業:市場佔有率分析、產業趨勢與統計、成長預測(2026-2031)
 垂直農業市場機會、成長要素、產業趨勢分析及2026-2035年預測
 垂直農業市場分析與預測(至2035年):按類型、產品、服務、技術、組件、應用、最終用戶、安裝方法、設備和解決方案分類垂直漿果種植市場預測至2034年—全球分析(按漿果類型、栽培技術、組件、自動化程度、設施類型、應用、最終用戶、分銷管道和地區分類)
 垂直農業市場報告:按組成部分、結構、成長要素、應用和地區分類(2026-2034 年)
 2026年全球垂直農業市場報告2034年室內農業產品市場預測-按產品類型、種植方法、設施類型、種植規模、最終用戶和地區分類的全球分析