


 |
市場調查報告書
商品編碼
2061566
德國風力發電:市場佔有率分析、產業趨勢與統計及成長預測(2026-2031)Germany Wind Energy - Market Share Analysis, Industry Trends & Statistics, Growth Forecasts (2026 - 2031) |
||||||
※ 本網頁內容可能與最新版本有所差異。詳細情況請與我們聯繫。
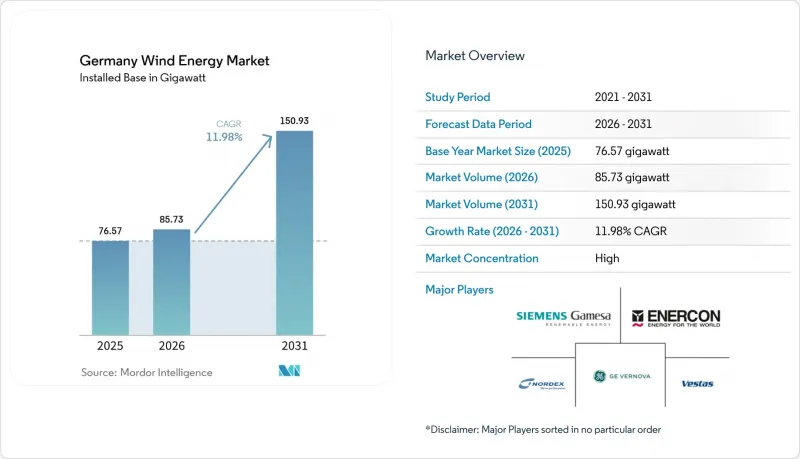
根據 Mordor Intelligence 預測,德國風力發電市場將從 2025 年的 76.57 吉瓦成長到 2026 年的 85.73 吉瓦,然後從 2026 年到 2031 年以 11.98% 的複合年成長率成長,到 2031 年達到 150.
本報告按位置(陸上和海上)、渦輪機功率(小於3兆瓦、3-6兆瓦和大於6兆瓦)和應用(公用事業規模、商業/工業和區域項目)進行細分。市場規模和預測均以裝置容量(吉瓦)為基礎。
德國風力發電市場趨勢與洞察
聯邦政府設定的陸上發電裝置容量115吉瓦和離岸發電裝置容量30吉瓦的目標正在推動市場加速發展。
2030年的約束性裝置容量目標意味著陸上每年新增7.7吉瓦,海上每年新增4吉瓦,與2024年陸上淨增2.5吉瓦相比,這是一個顯著的變化。專案已準備開工並獲得併網接入位的開發商將獲得先發優勢。離岸風力發電目標將使現有裝置容量增加兩倍,這需要電網營運商和專案發起人之間前所未有的協調。 TenneT的北海電網目前已承載8.03吉瓦的容量,但要到2045年將容量擴充至70吉瓦,還需要建設35條高壓直流輸電線路,這些線路目前正在競標階段。
簡化許可程序和《風力發電和土地法》將減少開發障礙。
授權制度改革使2024年獲批裝置容量增加了85%,達到14吉瓦,並減少了中小開發商的核准障礙。各聯邦州被要求在2027年至2032年期間劃出2%的土地用於風力發電開發,以確保空間規劃的確定性。光是2025年第一季,北萊茵-威斯特法倫州就發放了1.5吉瓦的許可證,顯示出快速成長。然而,平均建設前置作業時間仍超過兩年,大部分新增裝置容量將集中在2026年至2028年之間。
電網瓶頸和限電風險阻礙了發電最佳化。
2023年,由於南北輸電能力的限制,19太瓦時(TWh)的風力發電被削減,佔總發電量的13%。儘管聯邦政府批准的五條主要交流輸電走廊有望緩解堵塞,但由於這些走廊預計要到2027年或更晚才能完工,短期利潤仍面臨風險。北海海上發電量激增,超過了陸上電網的升級改造速度,進一步加劇了這個問題。
細分市場分析
到2025年,陸域風電資產將佔德國風力發電市場的87.02%,但離岸風電專案預計到2031年將以20.7%的複合年成長率成長。石勒蘇益格-荷爾斯泰因州、下薩克森州和梅克倫堡-前波美拉尼亞州佔裝置容量的三分之二,這得益於有利的條件,例如輪轂高度100米處風速可達7-8米/秒,以及早期區域規劃。在30-50米水深下,固定式基礎的成本為每颱風機150萬至200萬歐元,遠低於浮體式,這向德國風力發電市場發出了一個強烈的成本訊號:沿海開發應優先考慮。
隨著德國灣和波美拉尼亞灣吸收2024年競標中授予的7吉瓦離岸風電裝置容量,離岸風力發電裝置容量將從2025年的10.03吉瓦增至2031年的33.58吉瓦。超過50%的裝置容量利用率和零補貼的經濟效益將提高企劃案融資的槓桿率。陸上風力發電的成長將依賴下薩克森州和勃蘭登堡州的改造升級,屆時三台2兆瓦的風力發電機將被一台6兆瓦的機組取代,從而擴大轉子掃掠面積並重複利用現有基礎。這種雙管齊下的擴大策略將降低德國風力發電產業受土地短缺的影響。
其他好處:
- Excel格式的市場預測(ME)表
- 3個月的分析師支持
目錄
第1章:引言
- 研究假設和市場定義
- 調查範圍
第2章:調查方法
第3章執行摘要
第4章 市場狀況
- 市場概覽
- 市場促進因素
- 聯邦政府的目標是到2030年實現陸上115吉瓦和海上30吉瓦的裝置容量。
- 簡化許可程序和《風陸空法》
- 企業購電協議(PPA)與綠氫能驅動需求
- 運作超過15年的風力發電機進行改造升級,將提高發電能力。
- 高壓直流海上電網和北海互聯線路
- 公民能源收益分享系統
- 市場限制因素
- 電網瓶頸與限電風險
- 對亞洲渦輪機供應鏈的依賴
- 由於當地居民的反對和訴訟,導致延誤。
- 海上維運業技術純熟勞工短缺
- 供應鏈分析
- 監理情勢
- 技術展望
- 波特五力模型
- PESTLE分析
第5章 市場規模與成長預測
- 按位置
- 陸上
- 離岸
- 按渦輪機容量
- 3兆瓦或以下
- 3~6 MW
- 6兆瓦或以上
- 透過使用
- 公用事業規模
- 商業和工業用途
- 社區計畫
- 基於成分的分析(質性分析)
- 機艙/渦輪機
- 刀刃
- 塔
- 發電機和齒輪箱
- 系統平衡
第6章 競爭情勢
- 市場集中度
- 策略趨勢(併購、聯盟、購電協議)
- 市場佔有率分析(主要公司的市場排名和佔有率)
- 公司簡介
- Siemens Gamesa Renewable Energy SA
- Vestas Wind Systems A/S
- Enercon GmbH
- Nordex SE
- GE Vernova(GE Renewable Energy)
- RWE AG
- Orsted A/S
- ENBW AG
- PNE AG
- BayWa re AG
- WPD AG
- ABO Energy GmbH & Co. KGaA
- Deutsche Windtechnik AG
- Siemens Energy AG(Grid solutions)
- TenneT TSO GmbH
- 50Hertz Transmission GmbH
- Orsted Germany GmbH
- Statkraft Markets GmbH
- TotalEnergies Renewables Deutschland
第7章 市場機會與未來展望
According to Mordor Intelligence, the germany wind energy market size is expected to grow from 76.57 gigawatt in 2025 to 85.73 gigawatt in 2026 and is forecast to reach 150.93 gigawatt by 2031 at 11.98% CAGR over 2026-2031.
This report is Segmented by Location (Onshore and Offshore), Turbine Capacity (Less Than 3 MW, 3 To 6 MW, and Above 6 MW), and Application (Utility-Scale, Commercial and Industrial, and Community Projects). The Market Size and Forecasts are Provided in Terms of Installed Capacity (GW).
Germany Wind Energy Market Trends and Insights
Federal 115 GW Onshore & 30 GW Offshore Targets Drive Market Acceleration
Binding 2030 capacity goals translate into annual additions of 7.7 GW onshore and 4 GW offshore, a step-change from 2024's 2.5 GW net onshore increase. Developers with shovel-ready projects and secured interconnection spots gain a first-mover advantage. Offshore ambitions triple present capacity, forcing unprecedented coordination between grid operators and project sponsors. TenneT's North Sea links already move 8.03 GW, yet expansion to 70 GW by 2045 requires 35 HVDC corridors that are now entering the tender phase.
Streamlined Permitting & Wind-an-Land Act Reduce Development Friction
Permitting reforms lifted 2024 approvals 85% year-on-year to 14 GW, cutting bureaucratic hurdles for small and mid-sized developers. Federal states must zone 2% of land for wind by 2027-2032, guaranteeing spatial certainty. North Rhine-Westphalia licensed 1.5 GW in Q1-2025 alone, illustrating rapid uptake. Yet average construction lead time still exceeds two years, meaning the bulk of new capacity flows into the 2026-2028 window.
Grid Bottlenecks & Curtailment Risk Constrain Output Optimization
Nineteen TWh of wind power were curtailed in 2023, equal to 13% of total generation, due to limited north-to-south transmission. Federal approval of five major AC corridors will ease congestion, but completion dates after 2027 leave near-term earnings exposed. Offshore generation compounds the issue as North Sea output surges ahead of onshore grid reinforcements.
Other drivers and restraints analyzed in the detailed report include:
- Corporate PPAs & Green Hydrogen Create New Revenue Streams
- Repowering of >15-Year Turbines Amplifies Capacity Additions
- Dependency on Asian Supply Chains Creates Strategic Vulnerabilities
For complete list of drivers and restraints, kindly check the Table Of Contents.
Segment Analysis
Onshore assets supplied 87.02% of the German wind energy market size in 2025, yet offshore projects grow at a 20.7% CAGR through 2031. Schleswig-Holstein, Lower Saxony, and Mecklenburg-Vorpommern host two-thirds of installed capacity, benefiting from 7-8 m/s winds at 100 m hub height and early zoning. Fixed-bottom foundations in 30-50 m depths cost EUR 1.5-2 million per turbine, well below floating alternatives, giving the German wind energy market strong cost signals to push near-shore sites first.
Offshore capacity rises from 10.03 GW in 2025 to 33.58 GW in 2031 as the German Bight and Pomeranian Bay absorb 7 GW of 2024 auction awards. Capacity factors above 50% and zero-subsidy economics improve project finance leverage ratios. Onshore growth hinges on repowering in Lower Saxony and Brandenburg, where three 2 MW turbines give way to one 6 MW unit, freeing rotor-swept area while recycling foundations. This dual-track expansion keeps the German wind energy industry resilient to site scarcity.
List of Companies Covered in this Report:
- Siemens Gamesa Renewable Energy SA
- Vestas Wind Systems A/S
- Enercon GmbH
- Nordex SE
- GE Vernova (GE Renewable Energy)
- RWE AG
- Orsted A/S
- ENBW AG
- PNE AG
- BayWa r.e. AG
- WPD AG
- ABO Energy GmbH & Co. KGaA
- Deutsche Windtechnik AG
- Siemens Energy AG (Grid solutions)
- TenneT TSO GmbH
- 50Hertz Transmission GmbH
- Orsted Germany GmbH
- Statkraft Markets GmbH
- TotalEnergies Renewables Deutschland
Additional Benefits:
- The market estimate (ME) sheet in Excel format
- 3 months of analyst support
TABLE OF CONTENTS
1 Introduction
- 1.1 Study Assumptions & Market Definition
- 1.2 Scope of the Study
2 Research Methodology
3 Executive Summary
4 Market Landscape
- 4.1 Market Overview
- 4.2 Market Drivers
- 4.2.1 Federal 115 GW on-shore & 30 GW off-shore targets (2030)
- 4.2.2 Stream-lined permitting & "Wind-an-Land" Act
- 4.2.3 Corporate PPAs + green-hydrogen demand pull
- 4.2.4 Repowering of >15-yr turbines boosts MW additions
- 4.2.5 HVDC offshore grid & North Sea inter-connectors
- 4.2.6 Citizen-energy revenue-sharing schemes
- 4.3 Market Restraints
- 4.3.1 Grid bottlenecks & curtailment risk
- 4.3.2 Dependency on Asian turbine supply-chains
- 4.3.3 Local opposition & litigation delays
- 4.3.4 Skilled-labour shortage for offshore O&M
- 4.4 Supply-Chain Analysis
- 4.5 Regulatory Landscape
- 4.6 Technological Outlook
- 4.7 Porter's Five Forces
- 4.7.1 Threat of New Entrants
- 4.7.2 Bargaining Power of Suppliers
- 4.7.3 Bargaining Power of Buyers
- 4.7.4 Threat of Substitutes
- 4.7.5 Competitive Rivalry
- 4.8 PESTLE Analysis
5 Market Size & Growth Forecasts
- 5.1 By Location
- 5.1.1 Onshore
- 5.1.2 Offshore
- 5.2 By Turbine Capacity
- 5.2.1 Up to 3 MW
- 5.2.2 3 to 6 MW
- 5.2.3 Above 6 MW
- 5.3 By Application
- 5.3.1 Utility-scale
- 5.3.2 Commercial and Industrial
- 5.3.3 Community Projects
- 5.4 By Component (Qualitative Analysis)
- 5.4.1 Nacelle/Turbine
- 5.4.2 Blade
- 5.4.3 Tower
- 5.4.4 Generator and Gearbox
- 5.4.5 Balance-of-System
6 Competitive Landscape
- 6.1 Market Concentration
- 6.2 Strategic Moves (M&A, Partnerships, PPAs)
- 6.3 Market Share Analysis (Market Rank/Share for key companies)
- 6.4 Company Profiles (includes Global level Overview, Market level overview, Core Segments, Financials as available, Strategic Information, Products & Services, and Recent Developments)
- 6.4.1 Siemens Gamesa Renewable Energy SA
- 6.4.2 Vestas Wind Systems A/S
- 6.4.3 Enercon GmbH
- 6.4.4 Nordex SE
- 6.4.5 GE Vernova (GE Renewable Energy)
- 6.4.6 RWE AG
- 6.4.7 Orsted A/S
- 6.4.8 ENBW AG
- 6.4.9 PNE AG
- 6.4.10 BayWa r.e. AG
- 6.4.11 WPD AG
- 6.4.12 ABO Energy GmbH & Co. KGaA
- 6.4.13 Deutsche Windtechnik AG
- 6.4.14 Siemens Energy AG (Grid solutions)
- 6.4.15 TenneT TSO GmbH
- 6.4.16 50Hertz Transmission GmbH
- 6.4.17 Orsted Germany GmbH
- 6.4.18 Statkraft Markets GmbH
- 6.4.19 TotalEnergies Renewables Deutschland
7 Market Opportunities & Future Outlook
- 7.1 White-space & Unmet-Need Assessment
 風力發電市場報告:按組件、額定功率、安裝狀態、渦輪機類型、應用和地區分類,2026-2034 年
 風力發電基礎市場:依渦輪機朝向、安裝類型和應用分類-2026-2032年全球預測
 2026年全球風力發電市場報告2026年全球風力發電設備物流市場報告
 風力發電基礎市場-全球產業規模、佔有率、趨勢、機會、預測:按選址、基礎類型、地區和競爭格局分類,2021-2031年
 全球風能市場:依組件、安裝地點、應用和地區劃分-市場規模、產業動態、機會分析和預測(2026-2035 年)
 日本風力發電:市場佔有率分析、產業趨勢與統計及成長預測(2026-2031)風力發電轉換系統市場按組件、技術、安裝類型、功率容量、應用和最終用戶分類,全球預測(2026-2032)全球風能市場-按類型(海上和陸上)、最終用戶(工業、商業和住宅)、地區和競爭格局分類的產業規模、佔有率、趨勢、機會和預測(2021-2031年預測)
 風力發電市場規模、佔有率和成長分析:按組件、渦輪機額定功率、安裝量、技術、性別、最終用戶和地區分類 - 產業預測(2026-2033 年)