


 |
市場調查報告書
商品編碼
2044203
乾混砂漿添加劑和化學品:市場佔有率分析、行業趨勢和統計數據以及成長預測(2026-2031 年)Dry-Mix Mortar Additives And Chemicals - Market Share Analysis, Industry Trends & Statistics, Growth Forecasts (2026 - 2031) |
||||||
※ 本網頁內容可能與最新版本有所差異。詳細情況請與我們聯繫。
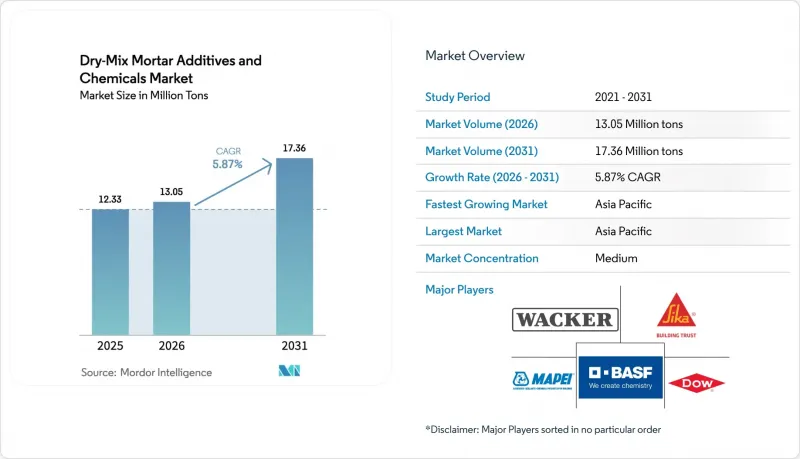
預計乾混砂漿添加劑和化學品的市場規模將從 2025 年的 1,233 萬噸擴大到 2026 年的 1,305 萬噸,到 2031 年達到 1736 萬噸,2026 年至 2031 年的複合年成長率為 5.87%。
印度強勁的公共部門支出和中國加速發展的工業建設推動了銷售量的成長。同時,美國的粉塵管制和歐洲的強制翻新工程鞏固了工廠預拌砂漿作為標準採購方式的地位。擁有垂直整合聚合物生產系統的製造商比區域性攪拌機製造商更能抵禦原料價格波動的影響,並在城市軌道交通、橋面和外牆外保溫裝飾系統(EIFS)維修項目中獲得了長期合約。儘管醋酸乙烯單體和丙烯酸的價格波動仍然是利潤率的主要威脅,但透過自身單體生產進行避險的供應商正在保護終端用戶免受季度價格衝擊的影響。設備密集的乾混砂漿廠對新進者構成威脅,並有效地鞏固了現有公司在亞太地區大型企劃和歐洲維修熱潮中的技術服務關係。
乾混砂漿添加劑和化學品的全球市場趨勢和洞察。
亞太地區的建設活動活性化
印度2026年聯邦預算累計12.2兆盧比(約1460億美元)的資本支出,其中5.98兆盧比用於交通基礎設施,85522兆盧比用於城市發展,這將推動對高性能建築材料(如瓷磚黏合劑和防水砂漿)的需求。儘管中國2024年房地產投資下降了10.6%,但其建築業正轉向工業和物流設施建設,並在勞動力萎縮的情況下利用乾混砂漿提高效率。在東南亞,特別是越南和印度尼西亞,基礎設施項目正在採用預混合料配方,以滿足世界銀行規定的ASTM C1714標準。然而,供應鏈風險,例如颱風造成的聚合物粉末運輸延誤,仍然是一個挑戰。該地區預計年複合成長率為 6.65%,前提是公共部門資本投資持續成長,但由於負債累累的地方政府面臨財政限制,2028 年後新的競標可能會放緩。
建築業的長期成本效益
使用工廠預拌乾混砂漿的建築公司,其材料浪費率已降至2%以下,中型住宅專案每年可節省8,000至12,000美元的成本。此外,消除現場配料錯誤可提高勞動生產力,每1000平方英尺的建築工期可縮短3至4小時。雖然這些優勢在阿拉伯聯合大公國和新加坡等人事費用高的市場至關重要,但由於需要在筒倉儲存設施和氣動輸送系統方面進行15萬至25萬美元的初始投資,因此在印度等區域性城市等分散市場中推廣應用受到限制。德里印度理工學院(IIT)2025年的一項研究表明,使用聚合物改質抹灰材料可將外牆維護週期從7年延長至12年,並將生命週期成本降低23%。這促使採購委員會優先考慮預先認證的乾混砂漿供應商,使擁有成熟技術服務網路的成熟公司更具優勢。
乾混料廠需高額資本投入
建造一座年產20萬噸的乾混砂漿廠需要5000萬至7000萬美元的資本投資,其中包括筒倉群、電腦控制的配料系統以及符合ISO 14001標準的除塵基礎設施。印尼和菲律賓等市場的高貸款利率(9%至12%)阻礙了當地企業進入這些市場。小規模的混合料生產商通常租賃契約製造,這不僅會損失15%至20%的利潤率,還會失去對其混合料相關智慧財產權的控制權,從而限制了產品的客製化。瓦克公司位於南京的工廠自2024年運作以來,充分體現了規模經濟效益,透過一項多年期收購契約,投資8000萬歐元(約合8700萬美元),實現了年產6萬噸可分散聚合物粉末的生產能力。相較之下,古吉拉突邦和泰米爾納德邦的中型供應商營運的工廠小規模(年產量2萬至4萬噸),生產批量不穩定,因此沒有資格參與預製混凝土競標。全球前十大生產商控制55%的產能,而200多家區域混凝土攪拌站則瓜分了剩餘的45%。
細分市場分析
到2025年,添加劑將佔總量的93.20%,預計在預測期(2026-2031年)內將以5.94%的複合年成長率成長。可再分散聚合物粉末仍然是一個重要的細分市場,對於亞太地區住宅建築使用的EN 12004-C2瓷磚黏合劑至關重要。羥丙基甲基纖維素(3200-4500美元/噸)是資料中心自流平砂漿的核心支撐材料,可在2米跨度內實現±3毫米的平整度。在加拿大,由於橋樑建設需要應對反覆的凍融循環,空氣嵌入劑的需求出現了暫時性激增,但銷售量仍落後於聚合物粉末。
化學產品扮演著特定的角色。例如,無水石膏收縮抑制劑可以防止自動化倉庫樓板開裂,而硬化促進劑則有助於波羅的海國家在冬季進行混凝土澆築。歐盟REACH法規(化學品註冊、評估、授權和限制)的合規成本為每個產品變體20萬至50萬歐元不等,這阻礙了中型企業的創新,因此供應集中在現有的跨國公司手中。
《乾混砂漿添加劑和化學品市場報告》按類型(添加劑和化學品)、最終用戶行業(住宅和非住宅)以及地區(亞太地區、北美、歐洲、南美以及中東和非洲)進行細分。乾混砂漿添加劑和化學品的市場規模和預測均以噸為單位呈現。
區域分析
預計到2025年,亞太地區將佔據36.59%的市場佔有率,並在預測期(2026-2031年)內以6.65%的複合年成長率成長。在印度,季風引發的返工導致高速公路和地鐵建設中對聚合物改質砂漿的需求比估計值高出30-40%。中國的國有管道項目正在將需求轉向工業園區和高鐵路車輛站。在東南亞,由於缺乏符合ISO 9001標準的產品,25-35%的預混合料砂漿依賴進口,這增加了進口成本,但保證了ASTM標準的品質。
歐洲的「翻新熱潮」正推動著市場穩定成長,儘管成長較為緩慢。在德國,採用外牆外保溫裝飾系統(EIFS)的維修工程對底塗層的需求量高達每平方公尺15公斤,但英國的BS 8414防火測試標準限制了認證供應商的數量,僅有三家。北美的基礎建設資金正在提振市場需求,預計橋面翻新工程將在2027年後達到高峰。沙烏地阿拉伯耗資1.3兆美元的「2030願景」計畫雖然帶來了間歇性的高價需求激增,但專案進度延誤抵消了部分成長。
其他好處:
- Excel格式的市場預測(ME)表
- 3個月的分析師支持
目錄
第1章:引言
- 研究假設和市場定義
- 調查範圍
第2章:調查方法
第3章執行摘要
第4章 市場狀況
- 促進因素
- 亞太地區的建設活動活性化
- 建築業的長期成本效益
- 歐洲對維修和整修的需求不斷成長
- 政府關於預混合料砂漿(粉塵控制)的規定
- 3D列印與模組化建築的協同效應
- 抑制因子
- 對乾混料廠進行大量資本投資
- 特種聚合物價格波動
- 嚴格的揮發性有機化合物和粉塵排放法規
- 產業價值鏈分析
- 波特五力分析
- 供應商的議價能力
- 消費者議價能力
- 新進入者的威脅
- 替代產品和服務的威脅
- 競爭程度
第5章 市場規模與成長預測
- 按類型
- 添加劑
- 可再分散聚合物粉末
- 塑化劑
- 消泡劑
- 纖維素醚
- 空氣注入劑
- 其他添加物
- 化學品
- 無水石膏的收縮率
- 延誤代理人
- 加速器
- 添加劑
- 按最終用戶行業分類
- 住宅
- 非住宅
- 商業的
- 工業和公共設施
- 基礎設施
- 按地區
- 亞太地區
- 中國
- 印度
- 日本
- 韓國
- 亞太其他地區
- 北美洲
- 美國
- 加拿大
- 墨西哥
- 歐洲
- 德國
- 英國
- 義大利
- 法國
- 其他歐洲國家
- 南美洲
- 巴西
- 阿根廷
- 南美洲其他地區
- 中東和非洲
- 沙烏地阿拉伯
- 南非
- 其他中東和非洲地區
- 亞太地區
第6章 競爭情勢
- 市場集中度
- 策略趨勢
- 市佔率(%)/排名分析
- 公司簡介
- AGRANA Beteiligungs AG
- Ashland
- Avebe
- BASF SE
- Celanese Corporation
- CEMEX SAB de CV
- Chemstar Products Company
- DCC
- Don Construction Products Ltd
- Dow
- Emsland Group
- Evonik Industries AG
- Innospec
- Kima Chemical Co. Ltd
- LOTTE Fine Chemical
- Mapei SpA
- Nouryon
- Rudolf GmbH
- SE Tylose GmbH & Co. KG(ShinEtsu)
- Shandong Head Co. Ltd
- SIDLEY CHEMICAL CO. LTD
- Sika AG
- SMScor
- The Euclid Chemical Company
- Wacker Chemie AG
- Berolan GmbH
第7章 市場機會與未來展望
The Dry-Mix Mortar Additives and Chemicals Market size is expected to increase from 12.33 million tons in 2025 to 13.05 million tons in 2026 and reach 17.36 million tons by 2031, growing at a CAGR of 5.87% over 2026-2031.
Robust public-sector spending in India and accelerated industrial works in China underpin volume gains, while dust-control ordinances in the United States and European renovation mandates institutionalize factory-blended mortars as the default procurement path. Producers with vertically integrated polymer chains absorb raw-material volatility better than regional blenders, securing long-term contracts for metro-rail, bridge-deck, and EIFS retrofits. Vinyl acetate monomer and acrylic acid price swings remain the chief margin threat, although suppliers hedged by in-house monomer production shield end-users from quarterly list-price shocks. Equipment-intensive dry-mix plants act as a deterrent for new entrants, effectively locking in incumbents' technical-service relationships across Asia-Pacific transport megaprojects and Europe's Retrofit Wave.
Global Dry-Mix Mortar Additives And Chemicals Market Trends and Insights
Rising Construction Activity in Asia-Pacific
India's Union Budget 2026 allocated INR 12.2 lakh crore (USD 146 billion) for capital expenditure, with ₹5.98 lakh crore for transport infrastructure and INR 85,522 crore for urban development, driving demand for high-performance construction materials like tile adhesives and waterproofing mortars. China's construction sector, despite a 10.6% property-investment decline in 2024, is shifting toward industrial and logistics facilities, leveraging dry-mix mortars for efficiency amid a shrinking workforce. Southeast Asia, led by Vietnam and Indonesia, is adopting pre-mixed formulations to meet World Bank-mandated ASTM C1714 standards for infrastructure projects. However, supply-chain risks, such as typhoons disrupting polymer-powder shipments, pose challenges. The region's 6.65% forecast CAGR depends on sustained public-sector capex, though fiscal constraints in debt-laden provinces may slow new tenders after 2028.
Long-Term Cost Efficiency in Construction
Contractors using factory-blended dry-mix mortars have reduced material waste to under 2%, saving USD 8,000-12,000 annually for mid-sized residential projects. Labor productivity has improved, saving 3-4 hours per 1,000-square-foot application by eliminating on-site batching errors. These benefits, significant in wage-inflated markets like the United Arab Emirates (UAE) and Singapore, require an upfront investment of USD 150,000-250,000 in silo storage and pneumatic systems, limiting adoption in fragmented markets like India's Tier-2 cities. A 2025 study by IIT (Indian Institute of Technology) Delhi showed polymer-modified renders extended facade-maintenance cycles from 7 to 12 years, cutting lifecycle costs by 23%. This has driven procurement committees to favor pre-qualified dry-mix suppliers, strengthening incumbents with established technical-service networks.
High Capex for Dry-Mix Plants
Establishing a 200,000-ton-per-year dry-mix mortar plant requires USD 50-70 million in capital expenditure, covering silo arrays, computerized batching systems, and ISO 14001-compliant dust-collection infrastructure. High financing rates (9-12%) in markets like Indonesia and the Philippines deter regional players. Smaller formulators often lease toll-manufacturing capacity, losing 15-20% margins and control over formulation IP, limiting customization. Wacker's Nanjing facility, operational since 2024, exemplifies scale economies with a EUR 80 million (USD 87 million) investment supporting 60,000 tons of dispersible-polymer-powder capacity through multi-year offtake agreements. In contrast, mid-tier suppliers in Gujarat and Tamil Nadu operate smaller plants (20,000-40,000 tons/year) with batch variability, disqualifying them from precast-concrete tenders. The top 10 producers control 55% of global capacity, while over 200 regional blenders share the remaining 45%.
Other drivers and restraints analyzed in the detailed report include:
- Growing Renovation and Retrofit Demand in Europe
- Government Dust-Control Mandates
- Volatility in Specialty-Polymer Prices
For complete list of drivers and restraints, kindly check the Table Of Contents.
Segment Analysis
Additives represented 93.20% of volume in 2025 and are set to grow with a CAGR of 5.94% during the forecast period (2026-2031). Redispersible polymer powders remain the anchor sub-segment, essential for EN 12004-C2 tile adhesives across Asia-Pacific's residential towers. Hydroxypropyl methylcellulose, at USD 3,200-4,500/ton, underpins self-leveling screeds in data centers, enabling +-3 mm flatness over 2 m spans. Air-entraining agents see episodic spikes in Canada's freeze-thaw bridge works, yet trail polymer powders in volume.
Chemicals power niche roles. Anhydrite shrinkage compensators curb cracking in automated-warehouse slabs, while accelerators support winter pours in the Baltics. EU REACH (European Union Registration, Evaluation, Authorisation and Restriction of Chemicals) compliance fees of EUR 200,000-500,000 per variant deter mid-tier innovation, consolidating supply around multi-national incumbents.
The Dry-Mix Mortar Additives and Chemicals Market Report is Segmented by Type (Additives and Chemicals), by End-User Industry (Residential and Non-Residential), and Geography (Asia-Pacific, North America, Europe, South America, and the Middle East and Africa). The Market Size and Forecasts for Dry-Mix Mortar Additives and Chemicals are Done in Volume (Tons).
Geography Analysis
Asia-Pacific held a 36.59% share in 2025, advancing with a CAGR of 6.65% during the forecast period (2026-2031). India's expressways and metros consume polymer-modified mortars at rates 30-40% above estimates because of monsoon-driven rework. China's state enterprise pipeline shifts volume into industrial parks and high-speed rail depots. Southeast Asia imports 25-35% of pre-mixed mortars due to ISO 9001 gaps, inflating landed costs but guaranteeing ASTM-grade quality.
Europe's Renovation Wave props stable but slower growth; Germany's Exterior Insulation and Finish Systems (EIFS) retrofits demand up to 15 kg base coat m2, while UK BS 8414 fire tests narrow the supplier base to three certified producers. North American infrastructure funds back-load demand, with bridge-deck overlays peaking post-2027. Saudi Arabia's USD 1.3 trillion Vision 2030 program injects episodic but premium-priced spikes, offset by project-timeline slippage.
- AGRANA Beteiligungs AG
- Ashland
- Avebe
- BASF SE
- Celanese Corporation
- CEMEX S.A.B. de CV
- Chemstar Products Company
- DCC
- Don Construction Products Ltd
- Dow
- Emsland Group
- Evonik Industries AG
- Innospec
- Kima Chemical Co. Ltd
- LOTTE Fine Chemical
- Mapei SpA
- Nouryon
- Rudolf GmbH
- SE Tylose GmbH & Co. KG (ShinEtsu)
- Shandong Head Co. Ltd
- SIDLEY CHEMICAL CO. LTD
- Sika AG
- SMScor
- The Euclid Chemical Company
- Wacker Chemie AG
- Berolan GmbH
Additional Benefits:
- The market estimate (ME) sheet in Excel format
- 3 months of analyst support
TABLE OF CONTENTS
1 Introduction
- 1.1 Study Assumptions and Market Definition
- 1.2 Scope of the Study
2 Research Methodology
3 Executive Summary
4 Market Landscape
- 4.1 Drivers
- 4.1.1 Rising construction activity in Asia-Pacific
- 4.1.2 Long-term cost efficiency in construction
- 4.1.3 Growing renovation and retrofit demand in Europe
- 4.1.4 Government mandates for pre-mixed mortars (dust-control)
- 4.1.5 Synergies with 3D-printing and modular construction
- 4.2 Restraints
- 4.2.1 High capex for dry-mix plants
- 4.2.2 Volatility in specialty-polymer prices
- 4.2.3 Stringent VOC and dust-emission regulations
- 4.3 Industry Value Chain Analysis
- 4.4 Porter's Five Forces Analysis
- 4.4.1 Bargaining Power of Suppliers
- 4.4.2 Bargaining Power of Consumers
- 4.4.3 Threat of New Entrants
- 4.4.4 Threat of Substitute Products and Services
- 4.4.5 Degree of Competition
5 Market Size & Growth Forecasts (Volume)
- 5.1 By Type
- 5.1.1 Additives
- 5.1.1.1 Redispersible Polymer Powder
- 5.1.1.2 Plasticizers
- 5.1.1.3 Defoamers
- 5.1.1.4 Cellulose Ether
- 5.1.1.5 Air Entraining Agents
- 5.1.1.6 Other Additives
- 5.1.2 Chemicals
- 5.1.2.1 Shrinkage (Anhydrites)
- 5.1.2.2 Retarders
- 5.1.2.3 Accelerators
- 5.1.1 Additives
- 5.2 By End-User Industry
- 5.2.1 Residential
- 5.2.2 Non-Residential
- 5.2.2.1 Commercial
- 5.2.2.2 Industrial and Institutional
- 5.2.2.3 Infrastructure
- 5.3 By Geography
- 5.3.1 Asia-Pacific
- 5.3.1.1 China
- 5.3.1.2 India
- 5.3.1.3 Japan
- 5.3.1.4 South Korea
- 5.3.1.5 Rest of Asia-Pacific
- 5.3.2 North America
- 5.3.2.1 United States
- 5.3.2.2 Canada
- 5.3.2.3 Mexico
- 5.3.3 Europe
- 5.3.3.1 Germany
- 5.3.3.2 United Kingdom
- 5.3.3.3 Italy
- 5.3.3.4 France
- 5.3.3.5 Rest of Europe
- 5.3.4 South America
- 5.3.4.1 Brazil
- 5.3.4.2 Argentina
- 5.3.4.3 Rest of South America
- 5.3.5 Middle East and Africa
- 5.3.5.1 Saudi Arabia
- 5.3.5.2 South Africa
- 5.3.5.3 Rest of Middle East and Africa
- 5.3.1 Asia-Pacific
6 Competitive Landscape
- 6.1 Market Concentration
- 6.2 Strategic Moves
- 6.3 Market Share(%)/Ranking Analysis
- 6.4 Company Profiles (includes Global Overview, Market Overview, Core Segments, Financials, Strategic Information, Products and Services, Recent Developments)
- 6.4.1 AGRANA Beteiligungs AG
- 6.4.2 Ashland
- 6.4.3 Avebe
- 6.4.4 BASF SE
- 6.4.5 Celanese Corporation
- 6.4.6 CEMEX S.A.B. de CV
- 6.4.7 Chemstar Products Company
- 6.4.8 DCC
- 6.4.9 Don Construction Products Ltd
- 6.4.10 Dow
- 6.4.11 Emsland Group
- 6.4.12 Evonik Industries AG
- 6.4.13 Innospec
- 6.4.14 Kima Chemical Co. Ltd
- 6.4.15 LOTTE Fine Chemical
- 6.4.16 Mapei SpA
- 6.4.17 Nouryon
- 6.4.18 Rudolf GmbH
- 6.4.19 SE Tylose GmbH & Co. KG (ShinEtsu)
- 6.4.20 Shandong Head Co. Ltd
- 6.4.21 SIDLEY CHEMICAL CO. LTD
- 6.4.22 Sika AG
- 6.4.23 SMScor
- 6.4.24 The Euclid Chemical Company
- 6.4.25 Wacker Chemie AG
- 6.4.26 Berolan GmbH
7 Market Opportunities and Future Outlook
- 7.1 Increase in demand for Eco Friendly Construction
 乾混砂漿添加劑及化學品市場:依砂漿類型、添加劑類型、形態、應用方法及最終用途分類-2026-2032年全球市場預測
 乾粉砂漿添加劑和化學品市場報告:按類型和地區分類,2026-2034 年
 2026年工業用預拌乾粉砂漿全球市場報告乾粉砂漿市場:按類型、包裝、計劃類型、應用、最終用途和分銷管道分類-2026-2032年全球市場預測2026年全球乾混砂漿市場報告
 乾混砂漿:市場佔有率分析、產業趨勢與統計、成長預測(2026-2031)東協乾混砂漿:市佔率分析、產業趨勢與統計、成長預測(2026-2031)歐洲乾粉砂漿:市場佔有率分析、產業趨勢與統計、成長預測(2026-2031)2026年全球乾混砂漿添加劑和化學品市場報告塔式乾粉砂漿攪拌站市場按產品類型、攪拌能力、應用、最終用途和分銷管道分類-2026-2032年全球預測