


 |
市場調查報告書
商品編碼
2044141
資料中心機櫃:市場佔有率分析、產業趨勢與統計、成長預測(2026-2031)Data Center Rack - Market Share Analysis, Industry Trends & Statistics, Growth Forecasts (2026 - 2031) |
||||||
※ 本網頁內容可能與最新版本有所差異。詳細情況請與我們聯繫。
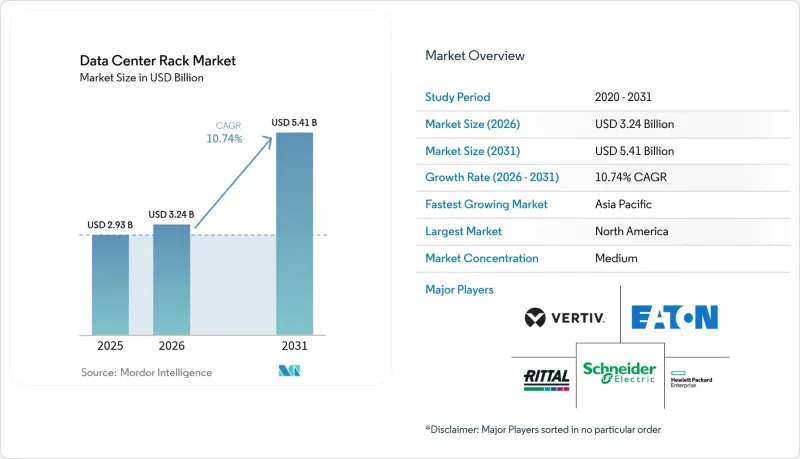
2025 年資料中心機櫃市場價值為 29.3 億美元,預計到 2031 年將達到 54.1 億美元,而 2026 年為 32.4 億美元,預測期(2026-2031 年)複合年成長率為 10.74%。
隨著機架級液冷和電源系統(能夠處理超過 40kW 的負載)逐漸成為超大規模營運商、雲端服務供應商和邊緣部署的標準配置,資料中心機櫃市場正在不斷擴張。營運商將機架基礎設施視為人工智慧 (AI) 工作負載、高效能運算叢集和對延遲敏感的邊緣節點的實體基礎。企業在努力提高運算密度並改善溫度控管的同時,48U 高機架配置、機櫃式封閉結構和液冷結構設計正成為主流。在全部區域,各國主導的人工智慧發展、可再生能源設施建設以及更嚴格的能源效率法規,進一步提升了對能夠滿足監管、永續性和可維護性目標的高階機架解決方案的需求。
全球資料中心機架市場趨勢與洞察
超大規模資料中心和託管資料中心正在迅速擴張。
預計到2025年,美國超大規模資料中心的資本支出將超過270億美元,年增69%。這鞏固了資料中心建設作為非住宅領域成長最快產業的地位。如今,單一GPU叢集每個機架需要10-140千瓦的電力,迫使營運商重新設計閒置頻段佈局,以液冷歧管而非傳統的空調系統為核心。像Digital Realty這樣的託管巨頭正在部署支援每個機櫃70千瓦電力的AI賦能型機房,這表明高階機架基礎設施是重要的競爭優勢。由於維修風冷機房的成本可能超過新建預算,這些擴建工程導致機櫃級機架的訂購週期長達數年。這一趨勢也表明,超大規模超大規模資料中心業者正在轉向擁有自己的設施,以更好地掌控其訓練和推理環境。
雲端運算和邊緣運算的日益普及正在推高機架需求。
企業正在工廠、倉庫和零售店附近部署運算節點,這迫使供應商開發耐環境腐蝕的機架。聯邦快遞 (FedEx) 透過與戴爾 (Dell) 和 Switch 的合作,在其物流中心部署了邊緣模組,這需要防震機殼和可遠端管理的電源分配單元 (PDU)。像阿拉伯聯合大公國電信 (Etisalat) 這樣的通訊業者正在部署安裝在街道設施中的封閉式機櫃內的緊湊型邊緣伺服器,這表明 5G 如何推動機架外形規格超越傳統的資料中心機房。像 3M 這樣的製造商正在工業環境中利用 Azure SQL Edge,這需要符合 NEMA 標準且能夠承受灰塵和溫度波動的機架。因此,資料中心機櫃市場正在加速發展,尤其是在提供適用於數千個分散式站點的預先整合模組化解決方案的細分市場。
能源效率法規(歐盟行為準則/ASHRAE)
修訂後的歐盟能源效率指令要求IT負載超過100千瓦的設施每年提交報告,並加強了對液冷技術的獎勵,液冷技術可將PUE值降低至1.03。美國暖氣、冷氣與空調工程師學會(ASHRAE)擴大了允許的進氣溫度範圍,並啟用了冷卻器節熱器模式,在該模式下,機架可以嚴格控制氣流。德國的《能源效率法》強制要求資料中心回收廢熱,並推薦使用後門液冷器,以便將高等級的熱能傳輸到區域供熱迴路。由於營運商都在爭分奪秒地趕在資訊揭露截止日期前完成工作,因此,提供符合監管要求的機架的供應商正享受著採購週期加快的便利。
細分市場分析
預計到 2025 年,全尺寸機架將佔資料中心機櫃市場 56.90% 的佔有率,並在 2031 年前以 12.55% 的複合年成長率 (CAGR) 超越其他尺寸。這一佔有率佔據資料中心機櫃市場規模的主導地位,反映了超大規模資料中心業者青睞 42U 機架的趨勢,這種機架簡化了佈線、氣流和 PDU 的標準化流程。人工智慧叢集需要大量的 PCIe 和 NVLink 互連,而全尺寸機架對於有序佈線至關重要,能夠確保 100 Gbps 或更高的訊號品質。在維修機房中,較大的機架尺寸還能適應現有冷通道的形狀,從而最大限度地降低重新鋪設地板的成本。
液冷進一步提升了全機架的優勢,因為更大的垂直空間使得供回水冷卻水通道的分離更加便捷。Schneider Electric的GB200 NVL72設計採用客製化歧管,位於42U伺服器區域下方,每個全機架可實現132kW的冷卻能力。因此,在資料中心機櫃市場,那些提供工廠整合冷卻水迴路、冗餘水泵和預裝在全高機櫃內的快速斷開接頭的供應商備受青睞。半機架和四分之一機架規格仍應用於邊緣機房和網路機房,但由於這些環境中很少需要大規模GPU叢集,因此它們的年複合成長率仍然較低。
到2025年,42U機架將佔據主導地位,銷量佔比高達53.10%,但預計48U機型將以11.78%的複合年成長率(CAGR)實現最高成長,直至2031年。對於操作員而言,額外的6U空間可用於安裝液冷歧管、母線槽或機架頂部交換機,且無需佔用伺服器插槽,極具價值。增加機架高度可減少所需的通道數量,在大規模機房中可節省高達12%的占地面積。此外,增加機架高度還能使重量均勻分佈到腳輪上,這在機櫃裝滿冷卻液後重量超過1500公斤時至關重要。
Littal 的 VX IT 系列機架可讓技術人員在通用導軌上混合安裝 42U 和 48U 機架,從而方便分階段過渡以適應預算週期。對於擁有充足垂直空間的場所,例如高天花板的倉庫,Littal 還提供客製化的 52U 和 54U 型號,但目前應用仍較為小眾。隨著液冷技術的進步,48U 機架在資料中心機櫃市場被視為最佳選擇,它兼顧了傳統相容性和麵向未來的容量。
資料中心機櫃市場按機架尺寸(四分之一機架、半機架、全機架)、機架高度(42U、45U及以上)、機架類型(機櫃式(密封)機架、開放式機櫃、壁掛式機架)、資料中心類型(託管資料中心、超大規模和雲端服務供應商資料中心、企業與鋼板和其他區材質、其他區材和其他地區進行合金中心、其他地區進行合金和鋼板材料中心。市場預測以美元計價。
區域分析
北美擁有強大的超大規模生態系統、成熟的供應鏈和清晰的法規環境,預計到2025年將佔全球收入的32.10%。美國資料中心資本支出將在2025年超過270億美元,但北維吉尼亞和矽谷電力供應緊張限制了其成長。加拿大正在加速利用水力發電進行永續建設,而墨西哥則在吸引近岸邊緣節點以支持美國實現低延遲目標。當地製造業的擴張,例如Schneider Electric在田納西州投資1.4億美元建設的開關設備工廠,正在幫助供應商規避關稅的不利影響。
亞太地區資料中心機櫃市場正以12.82%的複合年成長率快速擴張,在所有地區中成長率最高。中國正利用國家人工智慧基金投資大規模GPU基礎設施;印度在數位服務蓬勃發展的背景下,二線城市湧現大量5-20兆瓦的資料中心園區;日本則致力於打造工廠自動化邊緣叢集。區域製造地將顯著縮短機架物流前置作業時間,但銅材供不應求可能導致成本波動。諸如採用Vertiv設備的iGenius人工智慧中心等項目,展現了國內供應鏈如何發展以滿足區域運算需求。
其他好處:
- Excel格式的市場預測(ME)表
- 3個月的分析師支持
目錄
第1章:引言
- 研究假設和市場定義
- 調查範圍
第2章:調查方法
第3章執行摘要
第4章 市場狀況
- 市場概覽
- 市場促進因素
- 超大規模和託管設施的激增
- 雲端運算和邊緣運算的日益普及正在推高機架需求。
- 部署高密度伺服器(40 kW/機架或以上)
- 能源效率法規(歐盟行為準則/ASHRAE)
- 人工智慧最佳化的水冷機架架構
- 政府對國內貨架製造業的支持措施
- 市場限制因素
- 先進機櫃的初始資本投資成本高
- 刀鋒/伺服器晶片模組的廣泛應用
- 主要城市電力和空間短缺
- 特殊鋼和鋁的供應波動
- 供應鏈分析
- 監理情勢
- 技術展望
- 波特五力模型
- 供應商的議價能力
- 買方的議價能力
- 新進入者的威脅
- 競爭強度
- 替代品的威脅
- 對影響市場的宏觀經濟因素進行評估
第5章 市場規模與成長預測
- 按機架尺寸
- 四分之一架
- 半架
- 全機架
- 貨架高度
- 42U
- 45U
- 48U
- 其他高度(52U 和客製化)
- 按機架類型
- 櫃式(密封型)機架
- 開放式機櫃
- 壁掛式機架
- 依資料中心類型
- 託管設施
- 超大規模和雲端服務供應商的資料中心
- 企業和邊緣運算
- 材料
- 鋼
- 鋁
- 其他合金和複合材料
- 按地區
- 北美洲
- 美國
- 加拿大
- 墨西哥
- 南美洲
- 巴西
- 阿根廷
- 南美洲其他地區
- 歐洲
- 德國
- 英國
- 法國
- 義大利
- 西班牙
- 俄羅斯
- 其他歐洲地區
- 亞太地區
- 中國
- 日本
- 印度
- 韓國
- 澳洲和紐西蘭
- 亞太其他地區
- 中東和非洲
- 中東
- 沙烏地阿拉伯
- 阿拉伯聯合大公國
- 土耳其
- 其他中東國家
- 非洲
- 南非
- 奈及利亞
- 其他非洲地區
- 中東
- 北美洲
第6章 競爭情勢
- 市場集中度
- 策略趨勢
- 市佔率分析
- 公司簡介
- Schneider Electric SE
- Vertiv Group Corp.
- Eaton Corp. plc
- Rittal GmbH and Co. KG
- Hewlett Packard Enterprise
- Dell Technologies Inc.
- Legrand SA
- IBM Corp.
- Chatsworth Products Inc.
- Panduit Corp.
- APC(by Schneider Electric)
- Tripp Lite(Eaton)
- Great Lakes Case and Cabinet
- Belkin International Inc.
- Kendall Howard LLC
- Martin International Enclosures
- Black Box Corp.
- Fujitsu Ltd.
- Oracle Corp.
- Cisco Systems Inc.
第7章 市場機會與未來展望
The Data Center Rack Market size was valued at USD 2.93 billion in 2025 and is estimated to grow from USD 3.24 billion in 2026 to reach USD 5.41 billion by 2031, at a CAGR of 10.74% during the forecast period (2026-2031).
The data center rack market is expanding because hyperscale operators, cloud service providers, and edge deployments are standardizing on rack-level liquid cooling and power delivery systems that support loads above 40 kW. Operators view rack infrastructure as the physical foundation for artificial intelligence (AI) workloads, high-performance computing clusters, and latency-sensitive edge nodes. Taller 48U configurations, cabinet-style containment, and liquid-ready structural designs are becoming mainstream as companies seek to maximize compute density while improving thermal management. The region-wide pivot toward sovereign AI, renewable-powered facilities, and stricter energy-efficiency rules further intensifies demand for advanced rack solutions capable of meeting regulatory, sustainability, and serviceability targets.
Global Data Center Rack Market Trends and Insights
Hyperscale and Colocation Build-outs Surge
Hyperscale capital spending topped USD 27 billion in the United States during 2025, reflecting 69% year-over-year growth that cements data-center construction as the fastest-expanding non-residential segment. Individual GPU clusters now demand 10-140 kW per rack, pushing operators to redesign white-space layouts around liquid manifolds versus legacy air handling. Colocation leaders such as Digital Realty introduced AI-ready suites that sustain 70 kW per cabinet, signalling that premium rack infrastructure is a competitive differentiator. Because retrofit costs for air-cooled halls can eclipse new-build budgets, these expansions fuel multiyear ordering cycles for cabinet-class racks. The trend also illustrates hyperscalers' shift toward owning facilities to preserve control of training and inference environments.
Rising Cloud and Edge Adoption Boosts Rack Demand
Enterprises are placing compute nodes next to factories, warehouses, and retail stores, compelling vendors to engineer ruggedized racks. FedEx deployed edge modules inside logistics hubs through a Dell-Switch collaboration that requires vibration-resistant enclosures and remote-management PDUs. Telecom operators like Etisalat are rolling out compact edge servers that mount in sealed cabinets installed on street furniture, illustrating how 5G pushes rack form factors beyond traditional data floors. Manufacturers such as 3M leverage Azure SQL Edge on industrial shop floors, demanding NEMA-rated racks that tolerate dust and temperature swings. Consequently, the data center rack market accelerates in segments that supply pre-integrated, modular solutions suitable for thousands of distributed sites.
Energy-Efficiency Regulations (EU Code of Conduct / ASHRAE)
The European Union's revised Energy Efficiency Directive mandates yearly reporting for facilities over 100 kW IT load, aligning incentives toward liquid cooling that can achieve PUE as low as 1.03. ASHRAE widened allowable inlet temperatures, enabling chiller-less economiser modes when racks maintain tight airflow containment. Germany's Energy Efficiency Act compels data centers to reuse waste heat, favouring rear-door liquid coolers that can transfer high-grade thermal energy to district-heating loops. Vendors integrating compliant racks enjoy accelerated procurement cycles as operators race to meet disclosure deadlines.
Other drivers and restraints analyzed in the detailed report include:
- High-Density Server Deployment (Greater Than 40 kW/rack)
- High Upfront Capex for Advanced Cabinets
- Power and Space Scarcity in Tier-1 Metros
For complete list of drivers and restraints, kindly check the Table Of Contents.
Segment Analysis
Full racks delivered 56.90% of the data center rack market in 2025 and will outpace other sizes with a 12.55% CAGR to 2031. That share equates to a commanding portion of the data center rack market size and reflects hyperscalers' preference for 42U footprints that streamline cabling, airflow, and PDU standardisation. AI clusters demand sprawling PCIe and NVLink interconnects, making full racks indispensable for clean cable routing that sustains signal integrity at 100 Gbps and higher. In retrofit halls, larger frames also minimise floor-tile reconfiguration costs by aligning with existing cold-aisle geometry.
Liquid cooling magnifies full-rack advantages because taller vertical spaces facilitate segregated supply-and-return coolant channels. Schneider Electric's GB200 NVL72 blueprint achieves 132 kW per full rack through bespoke manifolds positioned below a 42U server zone. The data center rack market thus rewards vendors that deliver factory-integrated coolant loops, redundant pumps, and quick-disconnect couplings pre-installed within full-height cabinets. Half- and quarter-rack formats still serve edge closets and network rooms, yet their CAGR trails because these environments seldom require lavish GPU clusters.
Although 42U frames dominated 2025 with 53.10% revenue share, 48U variants are the fastest-growing height, posting 11.78% CAGR through 2031. Operators value the extra 6U for housing liquid manifolds, busways, or top-of-rack switches without sacrificing server slots. The incremental height reduces aisle count, yielding up to 12% floor-space savings in large halls. Taller frames also balance weight distribution across casters, vital when cabinets surpass 1,500 kilograms once coolant is added.
Rittal's VX IT line lets technicians mix 42U and 48U frames on common rails, easing phased migrations that align with budget cycles. Custom 52U or 54U models appear in high-ceiling warehouses where vertical clearance is plentiful, but adoption remains niche. With liquid cooling pushing density ceilings higher, the data center rack market regards 48U as the sweet spot between legacy compatibility and forward-looking capacity.
Data Center Rack Market is Segmented by Rack Size(Quartely Rack, Half Rack, Full Rack), Rack Height (42U, 45U and More), Rack Type(Cabinet (Closed) Racks, Open-Frame Racks, Wall-Mount Racks), Data Center Type(Colocation Facilities, Hyperscale and Cloud Service Provider DCs, Enterprise and Edge), Material(steel, Aluminum, Other Alloys and Composites) and by Geography. The Market Forecasts are Provided in Terms of Value (USD).
Geography Analysis
North America commanded 32.10% of 2025 revenue thanks to deep hyperscale ecosystems, well-established supply chains, and regulatory clarity. Data-center capital expenditure surpassed USD 27 billion in the United States during 2025, though utility congestion in Northern Virginia and Silicon Valley tempers growth. Canada accelerates sustainability-centric builds that leverage hydro generation, while Mexico attracts near-shoring edge nodes supporting U.S. latency targets. Local manufacturing expansions, such as Schneider Electric's USD 140 million Tennessee plant for switchgear, help suppliers dodge tariff headwinds.
Asia-Pacific is advancing at a 12.82% CAGR, the fastest regional clip in the data center rack market. China channels sovereign AI funds into massive GPU bases, India's digital-services boom propels 5- to 20-MW campuses across tier-2 cities, and Japan backs edge clusters to automate factories. Regional fabrication hubs slash logistics lead times for racks, yet copper deficits could add cost volatility. Projects such as Vertiv-equipped iGenius AI centers illustrate how domestic supply ecosystems are rising to meet localised compute mandates.
- Schneider Electric SE
- Vertiv Group Corp.
- Eaton Corp. plc
- Rittal GmbH and Co. KG
- Hewlett Packard Enterprise
- Dell Technologies Inc.
- Legrand SA
- IBM Corp.
- Chatsworth Products Inc.
- Panduit Corp.
- APC (by Schneider Electric)
- Tripp Lite (Eaton)
- Great Lakes Case and Cabinet
- Belkin International Inc.
- Kendall Howard LLC
- Martin International Enclosures
- Black Box Corp.
- Fujitsu Ltd.
- Oracle Corp.
- Cisco Systems Inc.
Additional Benefits:
- The market estimate (ME) sheet in Excel format
- 3 months of analyst support
TABLE OF CONTENTS
1 INTRODUCTION
- 1.1 Study Assumptions and Market Definition
- 1.2 Scope of the Study
2 RESEARCH METHODOLOGY
3 EXECUTIVE SUMMARY
4 MARKET LANDSCAPE
- 4.1 Market Overview
- 4.2 Market Drivers
- 4.2.1 Hyperscale and colocation build-outs surge
- 4.2.2 Rising cloud and edge adoption boosts rack demand
- 4.2.3 High-density server deployment (greater than 40 kW/rack)
- 4.2.4 Energy-efficiency regulations (EU Code of Conduct / ASHRAE)
- 4.2.5 AI-optimised liquid-cooled rack architectures
- 4.2.6 National incentives for local rack manufacturing
- 4.3 Market Restraints
- 4.3.1 High upfront capex for advanced cabinets
- 4.3.2 Growing use of blade/server-on-chip modules
- 4.3.3 Power and space scarcity in tier-1 metros
- 4.3.4 Specialty steel and aluminium supply volatility
- 4.4 Supply-Chain Analysis
- 4.5 Regulatory Landscape
- 4.6 Technological Outlook
- 4.7 Porter's Five Forces
- 4.7.1 Bargaining Power of Suppliers
- 4.7.2 Bargaining Power of Buyers
- 4.7.3 Threat of New Entrants
- 4.7.4 Intensity of Rivalry
- 4.7.5 Threat of Substitutes
- 4.8 Assessment of Macroeconomic Factors on the Market
5 MARKET SIZE and GROWTH FORECASTS (VALUE)
- 5.1 By Rack Size
- 5.1.1 Quarter Rack
- 5.1.2 Half Rack
- 5.1.3 Full Rack
- 5.2 By Rack Height
- 5.2.1 42U
- 5.2.2 45U
- 5.2.3 48U
- 5.2.4 Other Heights (52U and Custom)
- 5.3 By Rack Type
- 5.3.1 Cabinet (Closed) Racks
- 5.3.2 Open-Frame Racks
- 5.3.3 Wall-Mount Racks
- 5.4 By Data Center Type
- 5.4.1 Colocation Facilities
- 5.4.2 Hyperscale and Cloud Service Provider DCs
- 5.4.3 Enterprise and Edge
- 5.5 By Material
- 5.5.1 Steel
- 5.5.2 Aluminum
- 5.5.3 Other Alloys and Composites
- 5.6 By Geography
- 5.6.1 North America
- 5.6.1.1 United States
- 5.6.1.2 Canada
- 5.6.1.3 Mexico
- 5.6.2 South America
- 5.6.2.1 Brazil
- 5.6.2.2 Argentina
- 5.6.2.3 Rest of South America
- 5.6.3 Europe
- 5.6.3.1 Germany
- 5.6.3.2 United Kingdom
- 5.6.3.3 France
- 5.6.3.4 Italy
- 5.6.3.5 Spain
- 5.6.3.6 Russia
- 5.6.3.7 Rest of Europe
- 5.6.4 Asia-Pacific
- 5.6.4.1 China
- 5.6.4.2 Japan
- 5.6.4.3 India
- 5.6.4.4 South Korea
- 5.6.4.5 Australia and New Zealand
- 5.6.4.6 Rest of Asia-Pacific
- 5.6.5 Middle East and Africa
- 5.6.5.1 Middle East
- 5.6.5.1.1 Saudi Arabia
- 5.6.5.1.2 United Arab Emirates
- 5.6.5.1.3 Turkey
- 5.6.5.1.4 Rest of Middle East
- 5.6.5.2 Africa
- 5.6.5.2.1 South Africa
- 5.6.5.2.2 Nigeria
- 5.6.5.2.3 Rest of Africa
- 5.6.5.1 Middle East
- 5.6.1 North America
6 COMPETITIVE LANDSCAPE
- 6.1 Market Concentration
- 6.2 Strategic Moves
- 6.3 Market Share Analysis
- 6.4 Company Profiles (includes Global level Overview, Market level overview, Core Segments, Financials as available, Strategic Information, Market Rank/Share for key companies, Products and Services, and Recent Developments)
- 6.4.1 Schneider Electric SE
- 6.4.2 Vertiv Group Corp.
- 6.4.3 Eaton Corp. plc
- 6.4.4 Rittal GmbH and Co. KG
- 6.4.5 Hewlett Packard Enterprise
- 6.4.6 Dell Technologies Inc.
- 6.4.7 Legrand SA
- 6.4.8 IBM Corp.
- 6.4.9 Chatsworth Products Inc.
- 6.4.10 Panduit Corp.
- 6.4.11 APC (by Schneider Electric)
- 6.4.12 Tripp Lite (Eaton)
- 6.4.13 Great Lakes Case and Cabinet
- 6.4.14 Belkin International Inc.
- 6.4.15 Kendall Howard LLC
- 6.4.16 Martin International Enclosures
- 6.4.17 Black Box Corp.
- 6.4.18 Fujitsu Ltd.
- 6.4.19 Oracle Corp.
- 6.4.20 Cisco Systems Inc.
7 MARKET OPPORTUNITIES and FUTURE OUTLOOK
- 7.1 White-space and Unmet-need Assessment
 資料中心機櫃市場 - 全球產業規模、佔有率、趨勢、機會、預測:按組件、機架類型、資料中心規模、機架高度、產業垂直領域、地區和競爭格局分類,2021-2031年
 資料中心機架式配電單元市場規模、佔有率和成長分析:按類型、相數、安裝方式、額定功率、資料中心類型、應用和地區分類-2026年至2033年產業預測
 全球OCP機架市場:依最終用戶、應用程式和地區分類-預測至2030年
 資料中心機櫃市場分析及預測(至2035年):類型、產品類型、服務、技術、應用、材質、最終用戶、安裝配置
 資料中心機架市場規模、佔有率、趨勢和預測:按類型、框架單位、機架尺寸、框架尺寸、框架設計、服務、應用、最終用戶和地區分類,2026-2034 年
 全球資料中心機櫃市場規模、佔有率、趨勢和成長分析報告(2026-2034年)
 資料中心機櫃市場:按機架類型、設計、承載能力、材質、應用、最終用戶和分銷管道分類-2026-2032年全球市場預測
 2026年全球資料中心機櫃與機櫃市場報告
 中國資料中心機櫃:市場佔有率分析、產業趨勢與統計及成長預測(2026-2031)
 全球資料中心機櫃用配電單元市場:市場規模、佔有率和趨勢分析(按機架類型和地區分類),細分市場預測(2026-2033 年)