


 |
市場調查報告書
商品編碼
2044070
金屬廢料回收:市場佔有率分析、產業趨勢與統計、成長預測(2026-2031)Scrap Metal Recycling - Market Share Analysis, Industry Trends & Statistics, Growth Forecasts (2026 - 2031) |
||||||
※ 本網頁內容可能與最新版本有所差異。詳細情況請與我們聯繫。
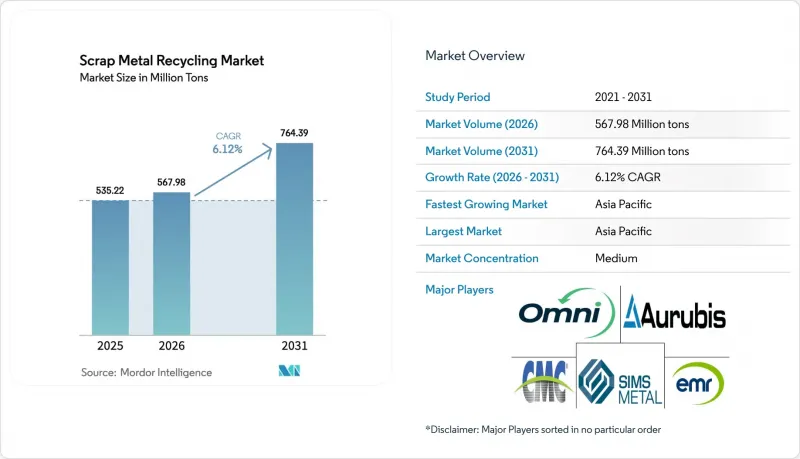
預計金屬廢料回收市場將從 2025 年的 5.3522 億噸和 2026 年的 5.6798 億噸成長到 2031 年的 7.6439 億噸,2026 年至 2031 年的年複合成長率(CAGR)為 6.12%。
三個結構性因素正在推動短期成長。首先,印度、中東和東南亞地區新電弧爐的投產增加了國內廢鋼消費量,減少了出口。其次,汽車和電子產品目的地設備製造商(OEM)簽訂了低殘餘量契約,限制了現貨市場的供應。第三,儘管經合組織推動廢鋼貿易自由化,促使監理機關採用統一的品質標準,但各國的出口課稅仍導致區域間供需失衡。這些趨勢提高了能夠將銅含量控制在0.15%以下的加工商的盈利,而那些仍依賴人工分類的加工商則處於劣勢。
全球金屬廢料回收市場趨勢及洞察
印度、中東和北非(MENA)以及東南亞的電爐(EAF)設施迅速擴張
自2024年以來啟動的電弧爐(EAF)計畫改變了亞洲廢鋼的流通格局。光是塔塔鋼鐵旁遮普邦的工廠在運作第一年就使當地廢鋼需求增加了75萬噸。同時,阿拉伯聯合大公國鋼鐵公司(Emirates Steel Arcan)位於阿布達比的工廠(年產能350萬噸)將原本運往土耳其的沿岸地區廢鋼轉運至此。 2024年至2025年間,印尼、越南和馬來西亞新增了280萬噸電弧爐產能,吸收了原本流向中國的日本廢鋼。隨著這些電弧爐產能接近運作,廢鋼回收市場面臨許多挑戰,例如短程卡車運輸能力有限,以及鋼廠300公里半徑內即時交付廢鋼的溢價不斷上漲。預計當地需求的成長將提高先前廢鋼分銷網路不發達的區域城市的廢鋼回收率。
透過併購垂直整合的鋼鐵廠來取得廢鋼供內部使用。
2024年初生鐵價格飆升45%,導致鋼鐵業利潤空間受到擠壓,鋼鐵製造商正加速收購廢鋼場以確保供應。安賽樂米塔爾收購了日本鋼鐵住友金屬北美加工網路的一半,這將確保其獲得200萬噸經認證的原料,同時將交易成本降低至少每噸12美元。在美國,紐科爾的子公司大衛·J·約瑟夫將於2025年收購中西部地區的12家廢鋼場,將其加工能力擴大到800萬噸,進一步壓縮本已集中的區域廢鋼供應。這波整合浪潮為大規模買家創造了蓬勃發展的金屬廢料回收市場,但小規模的獨立營運商則面臨著現貨市場供應減少和營運資金波動加劇等挑戰。
殘留銅污染增加會限制電弧爐原料的品質。
預計到2025年,廢料中銅的平均含量將上升至0.35%,超過0.2%的閾值。許多用於長條類產品的電弧爐(EAF)在0.2%的閾值下,銅含量過高會導致顏色缺陷。蒂森克虜伯公司報告稱,在其杜伊斯堡工廠安裝除銅設備後,熔煉成本每噸增加了15歐元。隨著電動車佈線密度的增加和印刷電路基板的日益普及,加工商被迫在投資機器人分類技術或接受降級為低價值產品(例如鋼筋)之間做出選擇。日本經濟產業省推出了津貼計劃,旨在2028年將廢料中的銅殘留量降低20%。
細分市場分析
2025年,受鋼筋、結構鋼和汽車鋼板需求的推動,鐵基金屬將佔總加工量的70.82%。預計到2031年,非鐵金屬將以6.22%的複合年成長率成長,主要得益於資料中心電纜、電動車機殼等應用,以及北美和歐洲近100%的電池回收率。 2025年,250萬噸的礦產供不應求,加上強勁電氣化的需求,將推動廢銅價格上漲18%,進而提振金屬廢料回收市場中高價值細分市場。根據《飲料罐回收法案》,鋁的回收依然強勁,但漆料污染使得二次合金的回收率僅為原生鋁錠的85%。美國的鉛酸電池回收率已達到99%,樹立了效率標桿,而鈦在利潤豐厚的航太應用領域繼續蓬勃發展。
等級溢價正在影響市場趨勢。經認證的低銅廢鐵價格高達每噸 50 美元,促使大型廢料回收廠投資基於感測器的分類設備。非鐵金屬加工商也呈現類似的趨勢。軋製級鋁的價格比混合刨花高出每噸 150 美元,一級銅在供不應求高峰期比二級銅的現貨價格高出 4%。隨著人工智慧檢測技術的普及,這些價格差異預計將會縮小。然而,先行者已經開始利用金屬廢料回收市場中最盈利的機會。
《金屬廢料回收市場報告》按金屬類型(鐵(黑色金屬和鋼)、有色金屬(銅、鋁、鉛和其他金屬))、終端用途行業(建築、汽車、電氣和電子、製造和工業等)以及地區(亞太地區、北美、歐洲、南美以及中東和非洲)進行細分。市場預測以噸為單位。
區域分析
預計到2025年,亞太地區將佔全球市場佔有率的52.22%,並預計在2031年之前以6.73%的複合年成長率成長。中國國內的出口禁令導致800萬噸廢鋼被轉運至沿海電弧爐(EAF),加劇了日本和韓國的供應緊張。儘管如此,日本仍出口了620萬噸廢鋼,較2023年的基準值下降了15%。由於韓國浦項鋼鐵公司(POSCO Korea)新建了一座配備分類機的200萬噸級電弧爐,汽車廢鋼的需求正在增加。越南、印尼和馬來西亞也呈現類似的趨勢,產能的擴張吸收了長途運輸路線上的剩餘廢鋼,促進了當地金屬廢料回收市場的成長。
在北美,美國在嚴格的車輛回收和老舊基礎設施拆除法規的推動下,預計到2025年將處理7,000萬噸廢棄物。商業金屬公司(Commercial Metals Company)在美國和墨西哥經營40個廢料場。加拿大主要向美國買家出口廢料,而在墨西哥,美墨加協定(USMCA)的相關規定促進了200萬噸廢料運往特尼姆(Ternium)位於蒙特雷的綜合設施。紐柯公司(Nucor)在美國中西部的擴張進一步加強了區域分銷,並凸顯了綜合網路在穩定廢金屬回收市場價格方面的重要作用。
在歐洲,「循環經濟行動計畫」要求到2030年回收70%的拆除廢棄物,以確保長條類產品和薄板金屬製品製造商獲得穩定的廢料供應。安賽樂米塔爾與新日鐵住金的合作確保了200萬噸專有原料的供應。在土耳其,許可法規使海外銷售額減半,降低了進口需求,並增加了北歐小型鋼廠對本地廢棄物的依賴。俄羅斯受到支付制裁,進一步加劇了影響歐洲金屬廢料回收市場的區域不平衡。
其他好處:
- Excel格式的市場預測(ME)表
- 3個月的分析師支持
目錄
第1章:引言
- 研究假設和市場定義
- 調查範圍
第2章:調查方法
第3章執行摘要
第4章 市場狀況
- 市場概覽
- 市場促進因素
- 印度、中東和北非(MENA)以及東南亞的電爐(EAF)設施迅速擴張
- 垂直整合型鋼鐵廠的併購:確保廢鋼自用
- AI 驅動的 LIBS 和高光譜遙測分選技術已將回收率提高到 98% 以上。
- 針對經認證的低殘留廢料,為原始設備製造商 (OEM) 提供閉合迴路合約。
- 經合組織正在推動廢鋼貿易自由化,以實現鋼鐵業到 2050 年的淨零排放目標。
- 市場限制因素
- 殘留銅污染的增加限制了電爐(EAF)所用原料的品質。
- 各國相繼推出出口管制法律,導致可交易廢金屬的供應量減少。
- 廢料價格波動增加了中小企業的避險成本。
- 價值鏈分析
- 波特五力模型
- 供應商的議價能力
- 買方的議價能力
- 新進入者的威脅
- 替代品的威脅
- 競爭程度
第5章 市場規模與成長預測
- 按金屬類型
- 鐵
- 鐵
- 鋼
- 有色金屬
- 銅
- 鋁
- 帶領
- 其他金屬類型
- 鐵
- 按最終用途行業分類
- 建造
- 車
- 電氣和電子
- 製造業和工業
- 家用電器
- 航太/國防
- 其他終端用戶產業
- 按地區
- 亞太地區
- 中國
- 印度
- 日本
- 韓國
- 馬來西亞
- 泰國
- 印尼
- 越南
- 亞太其他地區
- 北美洲
- 美國
- 加拿大
- 墨西哥
- 歐洲
- 德國
- 英國
- 法國
- 義大利
- 西班牙
- 土耳其
- 北歐國家
- 俄羅斯
- 其他歐洲地區
- 南美洲
- 巴西
- 阿根廷
- 南美洲其他地區
- 中東和非洲
- 沙烏地阿拉伯
- 卡達
- 阿拉伯聯合大公國
- 埃及
- 南非
- 其他中東和非洲
- 亞太地區
第6章 競爭情勢
- 市場集中度
- 策略趨勢
- 市佔率(%)/排名分析
- 公司簡介
- AIM Recycling
- ArcelorMittal
- Aurubis AG
- Baosteel Group Corporation
- CMR Green Technologies Ltd
- COHEN
- Commercial Metals Company(CMC)
- Dowa Holdings Co. Ltd
- European Metal Recycling Ltd.
- Gerdau S/A
- Greenwave Technology Solutions Inc.
- Norton Aluminium
- OmniSource, LLC
- Remondis SE & CO. KG
- Sims Limited
- SL Recycling
- Tata Steel Limited
- The David J. Joseph Company(Nucor Corporation)
- TKC Metal Recycling Inc.
- Tom Martin Company Ltd
- Total Metal Recycling, Inc.
第7章 市場機會與未來展望
The Scrap Metal Recycling Market size is projected to expand from 535.22 Million tons in 2025 and 567.98 Million tons in 2026 to 764.39 Million tons by 2031, registering a CAGR of 6.12% between 2026 to 2031.
Three structural factors are driving the near-term growth. First, the introduction of new electric arc furnaces (EAFs) in India, the Middle-East, and Southeast Asia is increasing domestic scrap consumption and reducing export volumes. Second, automotive and electronics original equipment manufacturers (OEMs) are securing low-residual contracts, which limit spot market availability. Third, the OECD's advocacy for open scrap trade is encouraging regulators to adopt uniform quality standards, although national export levies continue to create tight regional balances. These dynamics enhance the profitability of processors capable of maintaining copper content below 0.15% while disadvantaging facilities that still depend on manual sorting methods.
Global Scrap Metal Recycling Market Trends and Insights
Rapid EAF Capacity Additions in India, MENA, and Southeast Asia
EAF projects launched since 2024 have reshaped intra-Asian scrap flows. Tata Steel's Punjab furnace alone increased local demand by 0.75 million tons in its first operational year, while Emirates Steel Arkan's 3.5 million-ton Abu Dhabi plant redirected Gulf cargoes that previously went to Turkey. Between 2024 and 2025, Indonesia, Vietnam, and Malaysia added 2.8 million tons of new EAF capacity, absorbing Japanese scrap that previously moved to China. As these furnaces reach full capacity, the Scrap Metal Recycling Market faces challenges such as limited short-haul trucking capacity and higher premiums for prompt material within 300 kilometers of mill gates. Increased local demand is expected to boost collection rates in secondary cities where organized scrap chains were previously underdeveloped.
Vertically Integrated Mill M&A to Secure Captive Scrap
Steelmakers have accelerated acquisitions of scrap yards to secure supply following a 45% spike in pig-iron prices in early 2024, which compressed melt-shop margins. ArcelorMittal's acquisition of half of Nippon Steel's continental processing network ensures access to 2 million tons of certified feed while reducing transaction costs by at least USD 12 per ton. In the United States, Nucor's David J. Joseph subsidiary acquired 12 Midwest yards in 2025, increasing throughput to 8 million tons and tightening the already-concentrated regional scrap pool. This wave of consolidation keeps the Scrap Metal Recycling Market dynamic for large buyers but leaves smaller independent players facing reduced spot availability and greater working-capital volatility.
Rising Residual Copper Contamination Limits EAF Feed Quality
The average copper content in obsolete scrap rose to 0.35% in 2025, exceeding the 0.2% threshold that most long-product EAFs can tolerate without causing color defects. ThyssenKrupp reported an additional EUR 15 per ton in melt-shop costs after installing decopperization units at its Duisburg facility. As electric vehicle wiring density increases and printed circuit boards become more prevalent, processors must either invest in robotic separation technologies or accept downgrades into lower-value products like rebar. Japan's trade ministry has introduced capital grants for automated copper extraction, aiming to reduce residual copper levels by 20% by 2028.
Other drivers and restraints analyzed in the detailed report include:
- AI-Guided LIBS and Hyperspectral Sorting Lifting Recovery Yield Above 98%
- OEM Closed-Loop Contracts for Certified Low-Residual Scrap
- Wave of National Export Restriction Laws Shrinking Tradable Pool
For complete list of drivers and restraints, kindly check the Table Of Contents.
Segment Analysis
Ferrous metals contributed 70.82% of the 2025 throughput, driven by demand for rebar, beams, and automotive sheet. Non-ferrous metals are anticipated to grow at a CAGR of 6.22% through 2031, supported by applications such as data-center cabling, electric vehicle enclosures, and near-total battery collection in North America and Europe. Copper scrap prices rose by 18% in 2025 due to a 2.5 million-ton mine shortfall combined with strong electrification demand, boosting the premium segment of the scrap metal recycling market. Aluminum collection remains robust under beverage-can take-back laws, though lacquer contamination limits secondary alloy yields to 85% of virgin ingot levels. Lead batteries set the efficiency standard with a 99% collection rate in the United States, while titanium continues to serve niche, high-margin aerospace applications.
Grade premiums are shaping market trends. Certified low-copper ferrous scrap fetches up to USD 50 per ton more, enabling sensor-based sorting investments among top-tier yards. Non-ferrous processors observe similar trends: mill-grade aluminum trades USD 150 per ton higher than mixed turnings, and No. 1 copper achieves a 4% spot premium over No. 2 copper during peak deficit periods. As AI detection technology becomes more widespread, these price gaps are expected to narrow. However, early adopters are already capitalizing on the most lucrative opportunities within the scrap metal recycling market.
The Scrap Metal Recycling Market Report is Segmented by Metal Type (Ferrous (Iron, and Steel) Non-Ferrous (Copper, Aluminum, Lead, and Other Metal Types)), End-Use Industry (Construction, Automotive, Electrical and Electronics, Manufacturing and Industrial, and More), and Geography (Asia-Pacific, North America, Europe, South America, and Middle-East and Africa). The Market Forecasts are Provided in Terms of Volume (Tons).
Geography Analysis
Asia-Pacific accounted for 52.22% of the 2025 market volume and is expected to grow at a CAGR of 6.73% through 2031. China's domestic export ban redirected 8 million tons of scrap to coastal electric arc furnaces (EAFs), tightening supply in Japan and South Korea. Despite this, Japan exported 6.2 million tons, though this figure was 15% lower than its 2023 baseline. South Korea's new 2 million-ton POSCO furnace, equipped with AI sorters, has increased demand for auto-grade feed. Vietnam, Indonesia, and Malaysia are following similar trajectories, with capacity expansions absorbing surplus feeds from long-haul routes and contributing to the growth of the local scrap metal recycling market.
In North America, the United States processed 70 million tons in 2025, supported by stringent automotive take-back regulations and aging infrastructure demolitions. Commercial Metals Company operates 40 yards across the United States and Mexico. Canada primarily exported scrap to U.S. buyers, while Mexico's USMCA rules facilitated the movement of 2 million tons to Ternium's Monterrey complex. Nucor's expansion in the U.S. Midwest further tightened regional flows, highlighting the role of integrated networks in stabilizing prices within the scrap metal recycling market.
In Europe, the Circular Economy Action Plan mandates 70% demolition-waste recovery by 2030, ensuring a consistent scrap supply for long-product and flat-product mills. ArcelorMittal's partnership with Nippon Steel secures 2 million tons of captive feed. Turkey's import demand declined after licensing restrictions halved overseas sales, prompting Nordic mini-mills to rely more on regional scrap. Russia, under payment sanctions, continues to reinforce regional imbalances that impact the European scrap metal recycling market.
- AIM Recycling
- ArcelorMittal
- Aurubis AG
- Baosteel Group Corporation
- CMR Green Technologies Ltd
- COHEN
- Commercial Metals Company (CMC)
- Dowa Holdings Co. Ltd
- European Metal Recycling Ltd.
- Gerdau S/A
- Greenwave Technology Solutions Inc.
- Norton Aluminium
- OmniSource, LLC
- Remondis SE & CO. KG
- Sims Limited
- SL Recycling
- Tata Steel Limited
- The David J. Joseph Company (Nucor Corporation)
- TKC Metal Recycling Inc.
- Tom Martin Company Ltd
- Total Metal Recycling, Inc.
Additional Benefits:
- The market estimate (ME) sheet in Excel format
- 3 months of analyst support
TABLE OF CONTENTS
1 Introduction
- 1.1 Study Assumptions and Market Definition
- 1.2 Scope of the Study
2 Research Methodology
3 Executive Summary
4 Market Landscape
- 4.1 Market Overview
- 4.2 Market Drivers
- 4.2.1 Rapid EAF capacity additions in India, MENA, and Southeast Asia
- 4.2.2 Vertically-integrated mill M&A to secure captive scrap
- 4.2.3 AI-guided LIBS and hyperspectral sorting lifting recovery yield more than 98%
- 4.2.4 OEM closed-loop contracts for certified low-residual scrap
- 4.2.5 OECD push for open scrap trade to hit 2050 net-zero steel targets
- 4.3 Market Restraints
- 4.3.1 Rising residual-copper contamination limits EAF feed quality
- 4.3.2 Wave of national export-restriction laws shrinking tradable pool
- 4.3.3 Scrap price volatility widening hedge costs for SMEs
- 4.4 Value Chain Analysis
- 4.5 Porter's Five Forces
- 4.5.1 Bargaining Power of Suppliers
- 4.5.2 Bargaining Power of Buyers
- 4.5.3 Threat of New Entrants
- 4.5.4 Threat of Substitutes
- 4.5.5 Degree of Competition
5 Market Size and Growth Forecasts (Volume)
- 5.1 By Metal Type
- 5.1.1 Ferrous
- 5.1.1.1 Iron
- 5.1.1.2 Steel
- 5.1.2 Non-Ferrous
- 5.1.2.1 Copper
- 5.1.2.2 Aluminum
- 5.1.2.3 Lead
- 5.1.2.4 Other Metal Types
- 5.1.1 Ferrous
- 5.2 By End-use Industry
- 5.2.1 Construction
- 5.2.2 Automotive
- 5.2.3 Electrical and Electronics
- 5.2.4 Manufacturing and Industrial
- 5.2.5 Consumer Appliances
- 5.2.6 Aerospace and Defense
- 5.2.7 Other End-use Industries
- 5.3 By Geography
- 5.3.1 Asia-Pacific
- 5.3.1.1 China
- 5.3.1.2 India
- 5.3.1.3 Japan
- 5.3.1.4 South Korea
- 5.3.1.5 Malaysia
- 5.3.1.6 Thailand
- 5.3.1.7 Indonesia
- 5.3.1.8 Vietnam
- 5.3.1.9 Rest of Asia-Pacific
- 5.3.2 North America
- 5.3.2.1 United States
- 5.3.2.2 Canada
- 5.3.2.3 Mexico
- 5.3.3 Europe
- 5.3.3.1 Germany
- 5.3.3.2 United Kingdom
- 5.3.3.3 France
- 5.3.3.4 Italy
- 5.3.3.5 Spain
- 5.3.3.6 Turkey
- 5.3.3.7 NORDIC Countries
- 5.3.3.8 Russia
- 5.3.3.9 Rest of Europe
- 5.3.4 South America
- 5.3.4.1 Brazil
- 5.3.4.2 Argentina
- 5.3.4.3 Rest of South America
- 5.3.5 Middle-East and Africa
- 5.3.5.1 Saudi Arabia
- 5.3.5.2 Qatar
- 5.3.5.3 United Arab Emirates
- 5.3.5.4 Egypt
- 5.3.5.5 South Africa
- 5.3.5.6 Rest of Middle-East and Africa
- 5.3.1 Asia-Pacific
6 Competitive Landscape
- 6.1 Market Concentration
- 6.2 Strategic Moves
- 6.3 Market Share (%)/ Ranking Analysis
- 6.4 Company Profiles (includes Global level Overview, Market level overview, Core Segments, Financials as available, Strategic Information, Products and Services, and Recent Developments)
- 6.4.1 AIM Recycling
- 6.4.2 ArcelorMittal
- 6.4.3 Aurubis AG
- 6.4.4 Baosteel Group Corporation
- 6.4.5 CMR Green Technologies Ltd
- 6.4.6 COHEN
- 6.4.7 Commercial Metals Company (CMC)
- 6.4.8 Dowa Holdings Co. Ltd
- 6.4.9 European Metal Recycling Ltd.
- 6.4.10 Gerdau S/A
- 6.4.11 Greenwave Technology Solutions Inc.
- 6.4.12 Norton Aluminium
- 6.4.13 OmniSource, LLC
- 6.4.14 Remondis SE & CO. KG
- 6.4.15 Sims Limited
- 6.4.16 SL Recycling
- 6.4.17 Tata Steel Limited
- 6.4.18 The David J. Joseph Company (Nucor Corporation)
- 6.4.19 TKC Metal Recycling Inc.
- 6.4.20 Tom Martin Company Ltd
- 6.4.21 Total Metal Recycling, Inc.
7 Market Opportunities and Future Outlook
- 7.1 White-space and Unmet-Need Assessment
 廢棄電池:市場佔有率分析、產業趨勢與統計、成長預測(2026-2031)
 金屬廢料回收市場:2026-2032年全球市場預測(依材料、廢棄物來源、回收設施、加工步驟、回收技術及最終用途產業分類)
 金屬廢料回收市場:依金屬類型、來源、應用和地區分類
 2026-2034年全球鉛酸蓄電池廢棄物市場規模、佔有率、趨勢與成長分析報告金屬廢料回收市場規模、佔有率、成長及全球產業分析:按類型和應用分類,區域洞察及2026-2034年預測
 2026年全球廢金屬回收市場報告
 廢金屬回收市場規模、佔有率和成長分析(按金屬類型、廢料來源、最終用途產業和地區分類)—產業預測(2026-2033 年)
 鉛酸蓄電池廢棄物市場-全球產業規模、佔有率、趨勢、機會和預測,按電池類型(富液式、密封式)、產品類型(鉛酸、硫酸)、來源(汽車、UPS)、地區和競爭格局分類,2020-2030年預測
 全球金屬廢料回收市場:預測至2032年-依金屬類型、來源、回收方法、技術、最終用戶及地區進行分析
 2025-2029年全球廢金屬回收市場