

 |
市場調查報告書
商品編碼
2035050
日本風力發電:市場佔有率分析、產業趨勢與統計及成長預測(2026-2031)Japan Wind Energy - Market Share Analysis, Industry Trends & Statistics, Growth Forecasts (2026 - 2031) |
||||||
※ 本網頁內容可能與最新版本有所差異。詳細情況請與我們聯繫。
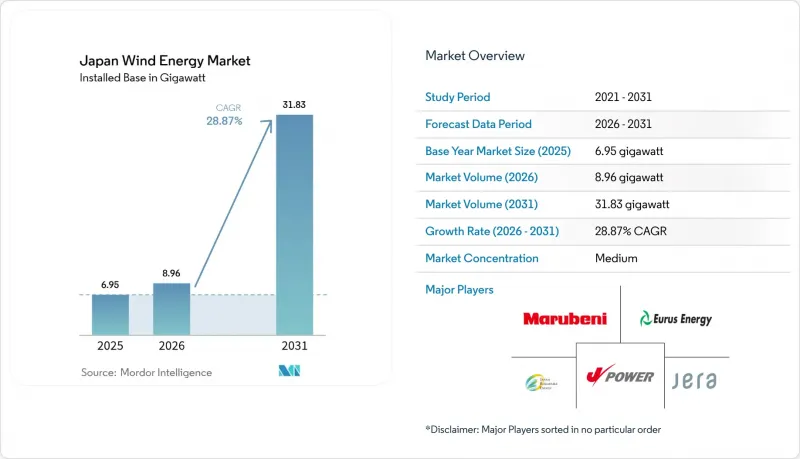
據估計,日本風電市場規模在 2026 年將達到 8.96 吉瓦,高於 2025 年的 6.95 吉瓦,預計到 2031 年將達到 31.83 吉瓦。
預計從 2026 年到 2031 年,其複合年成長率將達到 28.87%。
日本致力於減少對石化燃料的依賴,並力爭在2050年實現碳中和,這項政策承諾支撐了日本離岸風電的成長。此外,第七個能源戰略計畫也為此提供了推動,該計畫的目標是到2040年使可再生能源佔日本國內電力結構的40%至50%。離岸風力發電競標、主權轉型債券和購電協議(PPA)正在吸引新的資本,而國內零件供應系統的協調則降低了進口風險並縮短了專案建設週期。浮體式平台技術的進步使可開發海域面積擴大了十倍,從而可以利用更深的水域進行未來的產能擴張。另一方面,由於風能資源豐富的北部地區電網擁塞以及相關人員的反對,短期內的安裝速度受到限制。
日本風力發電市場趨勢與展望
離岸風電競標輪次激增
在2024年12月舉行的第三次競標中,青森南部和吉田海域共授予1吉瓦的裝機容量,價格為每千瓦時3日元,並強制要求在2030年6月前投入運營。 2025年1月修訂的競標規則引入了物價指數掛鉤機制和提前營運獎勵,以抵銷成本上漲風險。這些調整反映了監管機構在擴大競標範圍的同時,保持價格競爭力的彈性。計劃於2025年舉行的第四次競標將檢驗改進後的規則能否在不影響本地採購需求的前提下,加快發電容量的分配。這種模式將使競標成為日本風電市場可預測的成長引擎。
陸域風電:降低平準化電成本及升級風扇
裝置容量為147兆瓦的阿武隈風力發電廠(配備46台GE Vernova 3.2兆瓦風力發電機)於2025年4月投入運作,該專案展示了大型風力發電機如何降低每兆瓦的配套設備成本。維斯塔斯、三菱電機和富士電機在國內開關設備和半導體領域的合作,強化了供應鏈,降低了對進口的依賴。由NEDO資助的浮體式垂直軸風力發電機原型機,即使在深海環境下也實現了成本降低,從而促進了其更廣泛的應用。這些因素共同提高了專案的內部報酬率,加速了向更大、更有效率的風力發電機的過渡,並推動了日本風電市場的發展。
東北和北海道電網擁塞和限電風險
2023會計年度,可再生能源棄風量達1.76太瓦時(TWh),其中九州地區的棄風率為6.7%。風能資源豐富的北海道和東北地區遠離需求中心,且本州高壓輸電網的加固工程預計到2030年仍無法完成。優先向核能發電廠輸送電力的做法,使得高峰期風電可用容量面臨壓力。儘管丸紅株式會社在北海道安裝的25兆瓦/103.7兆瓦時電池儲能系統起到了一定的緩解作用,但北海道整體的儲能需求仍超過2吉瓦(GW)。持續的輸電網擁塞威脅著收益的穩定性,並導致日本風電市場新進者的資金籌措進程受阻。
細分市場分析
預計到2031年,離岸風力發電裝置容量將從幾乎為零成長至約12.1吉瓦,日本風電市場佔有率預計將從2025年的4.88%成長至2030年代末的近39%。在第三輪招標中,總合1065吉瓦的訂單以市電平價價格成交,選用的是15兆瓦級風力發電機組,這將使系統平衡成本降低約五分之一。隨著《專屬經濟區法》於2025年3月生效,商業化浮動式風力發電將獲得法律支持,從而釋放日本海和太平洋海溝中150吉瓦的深海開發潛力。
開發商仍然優先考慮陸上風電場的改造升級。無需徵用新土地,即可用4-5兆瓦級的設備替換上世紀90年代安裝的1.2吉瓦風力發電機組,而且併網也已就緒。然而,秋田縣和青森縣的臨時停工,以及與候鳥遷徙路線相關的環境評估,使得陸域風電計畫儲備量僅為800兆瓦。離岸風電計畫則面臨國內重型起重船短缺的問題。國內僅有三艘此類船舶可用,而歐洲則有25艘,迫使開發商必須以高昂的日租金從韓國和中國租用船舶。
《日本風力發電市場報告》按位置(陸上和海上)、風機輸出功率(小於3兆瓦、3-6兆瓦和大於6兆瓦)以及應用領域(公用事業規模、商業和工業以及區域項目)進行細分。市場規模和預測以裝置容量(吉瓦)為單位呈現。
其他好處:
- Excel格式的市場預測(ME)表
- 3個月的分析師支持
目錄
第1章:引言
- 研究假設和市場定義
- 調查範圍
第2章:調查方法
第3章執行摘要
第4章 市場狀況
- 市場概覽
- 市場促進因素
- 離岸風力發電競標輪次激增
- 陸域風力發電的平準化電成本降低,渦輪機性能提高
- 透過發行綠色債券流入的資金
- 資料中心和半導體叢集之間的公司間購電協議 (PPA)。
- 日本開放專屬經濟區(EEZ)用於浮動式風力發電
- 政府的氫能和氨能戰略正在提振風力發電需求。
- 市場限制因素
- 根據GX藍圖擴建燃氣發電設施
- 東北和北海道電網擁塞和限電風險
- 颱風導致營運維護成本增加
- 由於相關人員和當地相關人員了。
- 供應鏈分析
- 監理情勢
- 技術展望(浮體式基礎,15MW 風力發電機)
- 波特五力模型
- 新進入者的威脅
- 供應商的議價能力
- 買方的議價能力
- 替代品的威脅
- 競爭公司之間的競爭
- PESTEL 分析
第5章 市場規模與成長預測
- 按地區
- 陸上
- 離岸
- 按渦輪機輸出
- 3兆瓦或以下
- 3~6 MW
- 超過6兆瓦
- 透過使用
- 公用事業規模
- 商業和工業用途
- 區域項目
- 組件分解(定性分析)
- 機艙/渦輪機
- 刀刃
- 塔
- 發電機和齒輪箱
- 系統平衡
第6章 競爭情勢
- 市場集中度
- 策略性舉措(併購、合作、購電協議)
- 市場佔有率分析(主要公司的市場排名和佔有率)
- 公司簡介
- Vestas A/S
- Siemens Gamesa Renewable Energy
- Mitsubishi Heavy Industries
- GE Vernova
- Hitachi Energy
- JERA
- Eurus Energy Holdings
- Electric Power Development(J-Power)
- Sumitomo Corp.
- Marubeni Corp.
- Japan Renewable Energy(JRE)
- Cosmo Eco Power
- Toshiba Energy Systems
- Pattern Energy Japan
- Northland Power Japan
- Orsted Japan
- RWE Renewables Japan
- BP Offshore Wind Japan
- Shell Japan Renewables
- Inpex Renewable Energy
第7章 市場機會與未來展望
Japan Wind Energy Market size in 2026 is estimated at 8.96 gigawatt, growing from 2025 value of 6.95 gigawatt with 2031 projections showing 31.83 gigawatt, growing at 28.87% CAGR over 2026-2031.
Growth rests on Japan's policy commitment to curb fossil-fuel dependence and achieve carbon neutrality by 2050, supported by the 7th Strategic Energy Plan that targets 40-50% renewables in the national power mix by 2040. Offshore wind auctions, sovereign transition bonds, and corporate power-purchase agreements (PPAs) channel new capital, while domestic component alliances reduce import risks and shorten project timelines. Floating-platform breakthroughs enlarge the area available for development by a factor of ten, unlocking deeper waters for future capacity. At the same time, grid congestion in wind-rich northern regions and stakeholder opposition in fishing communities temper short-term installation rates.
Japan Wind Energy Market Trends and Insights
Surge in Offshore-Wind Auction Rounds
Round 3 auctions in December 2024 awarded 1 GW across Aomori South and Yuza at JPY 3/kWh with mandated start-up by June 2030. Revised auction rules in January 2025 introduced price-indexation and early-operation incentives to offset cost-inflation risk.These changes signal regulatory agility that preserves competitive pricing while broadening bidder participation. Round 4, slated for 2025, will test whether rule refinements can accelerate capacity awards without compromising local-content requirements. The approach positions auctions as a predictable growth engine for the Japan wind energy market.
Declining Onshore LCOE and Turbine Upgrades
The 147 MW Abukuma wind farm, commissioned in April 2025 with 46 GE Vernova 3.2 MW units, shows how larger turbines cut balance-of-plant costs per megawatt. Domestic switchgear and semiconductor tie-ups between Vestas, Mitsubishi Electric, and Fuji Electric deepen the supply chain and lower import exposure. NEDO-funded floating vertical-axis prototypes extend cost reductions into deep-water environments, supporting broader deployment. Together, these factors lift project internal rates of return and quicken the shift toward larger, more efficient machines, advancing the Japan wind energy market.
Grid Congestion & Curtailment Risk in Tohoku/Hokkaido
Renewable curtailment reached 1.76 TWh in FY 2023, with Kyushu recording a 6.7% rate. Wind-rich Hokkaido and Tohoku lie far from demand hubs, and high-voltage upgrades to Honshu will not finish before 2030. Priority dispatch for nuclear reactors squeezes available capacity in peak-wind seasons. Although Marubeni's 25 MW/103.7 MWh battery system in Hokkaido offers partial relief, statewide storage needs exceed 2 GW. Persistent congestion threatens revenue stability and delays financing for new entrants in the Japan wind energy market.
Other drivers and restraints analyzed in the detailed report include:
- Capital Inflows from Green-Bond Issuances
- Corporate PPAs from Data-Centre & Semiconductor Clusters
- Typhoon-Driven O&M Cost Inflation
For complete list of drivers and restraints, kindly check the Table Of Contents.
Segment Analysis
Offshore capacity is forecast to climb from a negligible base to roughly 12.1 GW by 2031, raising its Japan wind energy market share from 4.88% in 2025 to nearly 39% at the end of the decade. Round 3 awards totaling 1.065 GW cleared at grid-parity prices and specified 15 MW turbines that compress balance-of-system costs by roughly one-fifth. Commercial floating wind receives a legal boost from March 2025 EEZ legislation, which unlocks 150 GW of deep-water potential in the Sea of Japan and Pacific trenches.
Developers still prize onshore repowering opportunities: 1.2 GW of 1990s-era turbines can be swapped for 4-5 MW machines without adding new land footprints, and grid taps are already in place. Yet local moratoriums in Akita and Aomori and environmental reviews on migratory-bird routes hold the onshore pipeline at 800 MW. Offshore projects must contend with a domestic shortage of heavy-lift jack-up vessels; only 3 are available versus 25 in Europe, pushing developers to charter Korean or Chinese assets at premium day rates.
The Japan Wind Energy Market Report is Segmented by Location (Onshore and Offshore), Turbine Capacity (Less Than 3 MW, 3 To 6 MW, and Above 6 MW), and Application (Utility-Scale, Commercial and Industrial, and Community Projects). The Market Size and Forecasts are Provided in Terms of Installed Capacity (GW).
List of Companies Covered in this Report:
- Vestas A/S
- Siemens Gamesa Renewable Energy
- Mitsubishi Heavy Industries
- GE Vernova
- Hitachi Energy
- JERA
- Eurus Energy Holdings
- Electric Power Development (J-Power)
- Sumitomo Corp.
- Marubeni Corp.
- Japan Renewable Energy (JRE)
- Cosmo Eco Power
- Toshiba Energy Systems
- Pattern Energy Japan
- Northland Power Japan
- Orsted Japan
- RWE Renewables Japan
- BP Offshore Wind Japan
- Shell Japan Renewables
- Inpex Renewable Energy
Additional Benefits:
- The market estimate (ME) sheet in Excel format
- 3 months of analyst support
TABLE OF CONTENTS
1 Introduction
- 1.1 Study Assumptions & Market Definition
- 1.2 Scope of the Study
2 Research Methodology
3 Executive Summary
4 Market Landscape
- 4.1 Market Overview
- 4.2 Market Drivers
- 4.2.1 Surge in offshore-wind auction rounds
- 4.2.2 Declining onshore LCOE and turbine upgrades
- 4.2.3 Capital inflows from green-bond issuances
- 4.2.4 Corporate PPAs from data-centre & semiconductor clusters
- 4.2.5 Opening of Japan's EEZ for floating wind
- 4.2.6 National hydrogen-ammonia strategy boosting wind demand
- 4.3 Market Restraints
- 4.3.1 Gas-fired capacity additions under the GX roadmap
- 4.3.2 Grid congestion & curtailment risk in Tohoku/Hokkaido
- 4.3.3 Typhoon-driven O&M cost inflation
- 4.3.4 Fishery & local-stakeholder opposition delaying permits
- 4.4 Supply-Chain Analysis
- 4.5 Regulatory Landscape
- 4.6 Technological Outlook (floating foundations, 15-MW turbines)
- 4.7 Porters Five Forces
- 4.7.1 Threat of New Entrants
- 4.7.2 Bargaining Power of Suppliers
- 4.7.3 Bargaining Power of Buyers
- 4.7.4 Threat of Substitutes
- 4.7.5 Competitive Rivalry
- 4.8 PESTLE Analysis
5 Market Size & Growth Forecasts
- 5.1 By Location
- 5.1.1 Onshore
- 5.1.2 Offshore
- 5.2 By Turbine Capacity
- 5.2.1 Up to 3 MW
- 5.2.2 3 to 6 MW
- 5.2.3 Above 6 MW
- 5.3 By Application
- 5.3.1 Utility-scale
- 5.3.2 Commercial and Industrial
- 5.3.3 Community Projects
- 5.4 By Component (Qualitative Analysis)
- 5.4.1 Nacelle/Turbine
- 5.4.2 Blade
- 5.4.3 Tower
- 5.4.4 Generator and Gearbox
- 5.4.5 Balance-of-System
6 Competitive Landscape
- 6.1 Market Concentration
- 6.2 Strategic Moves (M&A, Partnerships, PPAs)
- 6.3 Market Share Analysis (Market Rank/Share for key companies)
- 6.4 Company Profiles (includes Global level Overview, Market level overview, Core Segments, Financials as available, Strategic Information, Products & Services, and Recent Developments)
- 6.4.1 Vestas A/S
- 6.4.2 Siemens Gamesa Renewable Energy
- 6.4.3 Mitsubishi Heavy Industries
- 6.4.4 GE Vernova
- 6.4.5 Hitachi Energy
- 6.4.6 JERA
- 6.4.7 Eurus Energy Holdings
- 6.4.8 Electric Power Development (J-Power)
- 6.4.9 Sumitomo Corp.
- 6.4.10 Marubeni Corp.
- 6.4.11 Japan Renewable Energy (JRE)
- 6.4.12 Cosmo Eco Power
- 6.4.13 Toshiba Energy Systems
- 6.4.14 Pattern Energy Japan
- 6.4.15 Northland Power Japan
- 6.4.16 Orsted Japan
- 6.4.17 RWE Renewables Japan
- 6.4.18 BP Offshore Wind Japan
- 6.4.19 Shell Japan Renewables
- 6.4.20 Inpex Renewable Energy
7 Market Opportunities & Future Outlook
- 7.1 White-space & Unmet-need Assessment
- 7.2 Floating wind in deep-water EEZ blocks
- 7.3 Green-hydrogen coupling & coastal ammonia hubs
- 7.4 Repowering ageing onshore fleets (Greater than 20 yrs)
- 7.5 Co-location with battery storage & data centres
 風力發電基礎市場規模、佔有率和成長分析:按基礎類型、渦輪機朝向、安裝類型、應用和地區分類-2026-2033年產業預測
 德國風力發電:市場佔有率分析、產業趨勢與統計及成長預測(2026-2031)
 風力發電市場報告:按組件、額定功率、安裝狀態、渦輪機類型、應用和地區分類,2026-2034 年
 風力發電基礎市場:依渦輪機朝向、安裝類型和應用分類-2026-2032年全球預測
 2026年全球風力發電市場報告2026年全球風力發電設備物流市場報告
 風力發電基礎市場-全球產業規模、佔有率、趨勢、機會、預測:按選址、基礎類型、地區和競爭格局分類,2021-2031年
 全球風能市場:依組件、安裝地點、應用和地區劃分-市場規模、產業動態、機會分析和預測(2026-2035 年)風力發電轉換系統市場按組件、技術、安裝類型、功率容量、應用和最終用戶分類,全球預測(2026-2032)全球風能市場-按類型(海上和陸上)、最終用戶(工業、商業和住宅)、地區和競爭格局分類的產業規模、佔有率、趨勢、機會和預測(2021-2031年預測)