


 |
市場調查報告書
商品編碼
1940765
美國整車運輸 (FTL):市場佔有率分析、產業趨勢與統計、成長預測 (2026-2031)United States Full-Truck-Load (FTL) - Market Share Analysis, Industry Trends & Statistics, Growth Forecasts (2026 - 2031) |
||||||
※ 本網頁內容可能與最新版本有所差異。詳細情況請與我們聯繫。
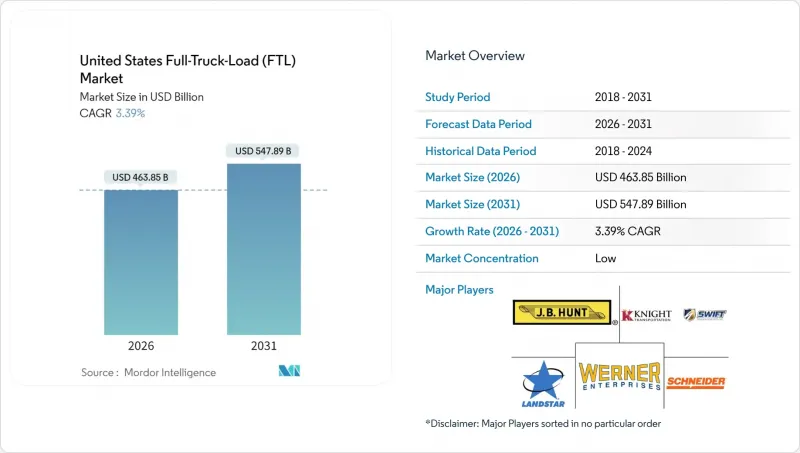
美國整車運輸 (FTL) 市場預計將從 2025 年的 4,486.5 億美元成長到 2026 年的 4,638.5 億美元,預計到 2031 年將達到 5,478.9 億美元,2026 年至 2031 年的複合年成長率為 3.39%。
這一成長得益於貨運結構日趨穩健,電子商務包裹運輸、近岸製造以及專用合約運輸的興起共同塑造了這一結構。儘管面臨司機短缺和柴油價格持續波動的問題,承運商仍在不斷調整其網路,以適應能夠按計劃為配送配銷中心補貨的密集配送走廊。聯邦基礎設施支出確保了建築材料的持續供應,而大麻合法化和藥物低溫運輸要求則催生了價格較高的細分市場。在美國整車運輸 (FTL) 市場,策略性路線最佳化、超過 90% 的資產運轉率以及技術驅動的調度管理已不再是差異化因素,而是基本要求。
美國整車運輸 (FTL) 市場趨勢與洞察
電子商務快速擴展到小批量商品領域。
亞馬遜快速擴張的履約中心和更廣泛的全通路轉型,使得上游配銷中心與最後一公里轉運站之間的整車運輸 (FTL) 路線持續運作。可預測的補貨計劃使承運商能夠簽訂專屬路線契約,目前 FreightPower 平台上超過 95% 的貨運都採用甩掛運輸模式。退貨量的成長也催生了對逆向物流的需求,從而促進了均衡的回程傳輸和更高的周轉率。這些因素共同支撐了美國整車運輸 (FTL) 市場對自有車隊的可靠性預期。
製造業的回歸與近岸外包趨勢
520億美元的《晶片與科學法案》加速了美國東南部和西南部半導體製造廠的建設,導致高價值設備和建築材料持續湧入。墨西哥近岸汽車生產重振了跨境運輸路線,如今蒙特雷、拉雷多和亞特蘭大之間已開通了多式聯運。運輸距離縮短但運輸頻率增加,刺激了對專用拖車的需求,並提升了美國整車運輸市場的整體規模。
司機短缺和勞動成本飆升
Schneider公司2024年第三季的獨立車隊規模年減12%,主要原因是獨立承包商的退出,反映出整個產業的創業能力正在萎縮。設備收回率的上升已將信用風險推至2008年的水平,導致貨運量轉向成本更高的公司自有司機。巨額賠償判決的風險導致保險費飆升,使大型貨運公司每年的營運成本增加1,000萬美元。人工智慧驅動的招募和健康管理工具的投資收益高達49%,但勞動力短缺仍持續對美國整車運輸(FTL)市場的長途運輸能力造成壓力。
細分市場分析
預計到2025年,製造業將占美國整車運輸(FTL)市場的31.55%,並在2026年至2031年間維持4.03%的複合年成長率,鞏固其作為關鍵產業和運輸量成長引擎的地位。半導體製造廠的建設、汽車製造業的回流以及機械設備的升級改造,正在推動中西部和東南部地區運輸路線密度的增加。在可預測的原料流入和成品流出的推動下,預計美國製造業相關的整車運輸市場在預測期內將成長超過305億美元。專用平板車和溫控設施對於精密零件的運輸變得越來越重要,承運商也因此獲得了更高的運費。即時可視性和準時交貨的可靠性是實現競爭優勢的關鍵,這推動了對人工智慧路線規劃和配備感測器的拖車的投資。因此,美國整車運輸 (FTL) 行業的資產組合正在向專用車輛轉變,這將提高盈利並增強承運商的競爭力。
除製造業外,由於聯邦基礎設施計劃和強勁的住宅需求,建設業的貨運量呈上升趨勢。批發和零售貿易正在利用交叉轉運網路整合電商訂單,石油、天然氣和礦業的物流業務正在逐步穩定,並呈現重新部署的節奏。季節性農業生產支撐著靈活的運力模式,而新興的大麻物流正透過運輸高利潤、監管複雜的貨物,進一步實現貨運結構的多元化。
其他福利:
- Excel格式的市場預測(ME)表
- 分析師支持(3個月)
目錄
第1章 引言
- 研究假設和市場定義
- 調查範圍
第2章調查方法
第3章執行摘要
第4章 市場情勢
- 市場概覽
- 按經濟活動分類的GDP分配
- 按經濟活動分類的GDP成長
- 經濟表現及概況
- 電子商務產業的趨勢
- 製造業趨勢
- 運輸和倉儲業GDP
- 物流績效
- 道路長度
- 出口趨勢
- 進口趨勢
- 燃油價格趨勢
- 卡車運輸營運成本
- 卡車運輸車隊規模(按類型)
- 主要卡車供應商
- 公路貨運量趨勢
- 公路貨運價格趨勢
- 透過交通方式分享
- 通貨膨脹
- 法律規範
- 價值鍊和通路分析
- 市場促進因素
- 爆炸性成長的電子商務交易正逐漸縮小規模
- 製造業回流日本和遷往鄰近地區的趨勢
- 基礎設施投資和就業法案貨運獎勵策略
- 專用合約運輸的成長
- 大麻供應合法化的趨勢
- 擴大低溫運輸藥品供應
- 市場限制
- 駕駛人和勞動成本上升
- 柴油價格波動
- 都市區擁擠收費區
- 缺乏公共電動卡車充電通道
- 市場創新
- 波特五力分析
- 新進入者的威脅
- 買方的議價能力
- 供應商的議價能力
- 替代品的威脅
- 競爭對手之間的競爭
第5章 市場規模與成長預測
- 終端用戶產業
- 農業、漁業、林業
- 建設業
- 製造業
- 石油天然氣、採礦和採石
- 批發和零售
- 其他
- 目的地
- 國內的
- 國際的
第6章 競爭情勢
- 市場集中度
- 關鍵策略舉措
- 市佔率分析
- 公司簡介
- ArcBest
- CH Robinson
- Covenant Logistics Group Inc.
- CR England Inc.
- DHL Group
- Hirschbach Motor Lines Inc.
- JB Hunt Transport, Inc.
- Knight-Swift Transportation Holdings Inc.
- Landstar System Inc.
- Marten Transport Ltd.
- PAM Transport Inc.
- Penske Logistics
- Prime Inc.
- R+L Carriers
- Ryder System, Inc.
- Schneider National Inc.
- TFI International Inc.
- TransAm Truck Lines Inc.
- United Parcel Service of America, Inc.(UPS)
- Werner Enterprises Inc.
第7章 市場機會與未來展望
The United States full-truck-load market is expected to grow from USD 448.65 billion in 2025 to USD 463.85 billion in 2026 and is forecast to reach USD 547.89 billion by 2031 at 3.39% CAGR over 2026-2031.
This growth arises from a resilient freight mix shaped by e-commerce parcelization, near-shore manufacturing, and the escalating use of dedicated contract carriage. Carriers continue adjusting networks to serve dense fulfillment corridors that replenish distribution centers on predictable schedules, even as driver shortages and diesel-price volatility persist. Federal infrastructure spending keeps construction material flows lively, while cannabis legalization and pharmaceutical cold-chain requirements create premium-priced niches. Strategic lane optimization, asset utilization above 90%, and technology-enabled dispatching are now baseline expectations rather than differentiators in the United States Full-Truck-Load market.
United States Full-Truck-Load (FTL) Market Trends and Insights
Explosive E-commerce Parcelization
Amazon's fast-growing fulfillment estate and the wider omnichannel pivot keep full-truck-load lanes busy between upstream distribution centers and last-mile cross-dock sites. Predictable replenishment schedules enable carriers to lock in dedicated routing contracts, with drop-and-hook models now exceeding 95% of FreightPower platform shipments. Higher return volumes also create reverse-logistics demand, supporting balanced backhauls and superior asset turns. These dynamics underpin service reliability expectations that favor asset-based fleets in the United States Full-Truck-Load market.
Manufacturing Reshoring and Near-shore Trends
The USD 52 billion CHIPS and Science Act catalyzes semiconductor plant construction across the Southeast and Southwest, spawning continuous inbound flows of high-value equipment and construction inputs. Near-shore automotive production in Mexico feeds cross-border corridors where intermodal options now link Monterrey, Laredo, and Atlanta. Shorter yet more frequent hauls lift trip counts, stimulate specialized trailer demand, and lift overall volumes in the United States Full-Truck-Load market.
Driver Shortage and Escalating Labor Costs
Owner-operator exits trimmed Schneider's independent fleet by 12% year-over-year in Q3 2024, mirroring an industry-wide contraction in entrepreneurial capacity. Credit stress resembles 2008 levels as equipment repossessions rise, shifting volume to costlier company drivers. Insurance premiums surge amid nuclear verdict exposure, adding USD 10 million to annual overhead at large carriers. AI-based recruiting and wellness tools show a 49% return on investment, yet the labor gap still depresses long-haul capacity in the United States Full-Truck-Load market.
Other drivers and restraints analyzed in the detailed report include:
- Infrastructure Investment and Jobs Act Freight Stimulus
- Growth in Dedicated Contract Carriage
- Diesel-Price Volatility
For complete list of drivers and restraints, kindly check the Table Of Contents.
Segment Analysis
Manufacturing held 31.55% of the United States Full-Truck-Load market share in 2025 and is pacing for a 4.03% CAGR between 2026-2031, cementing its status as both volume anchor and growth engine. Semiconductor plant construction, automotive reshoring, and machinery upgrades widen lane density across the Midwest and Southeast. The United States Full-Truck-Load market size tied to manufacturing is anticipated to add more than USD 30.5 billion over the forecast horizon, supported by predictable raw-material inflows and finished-goods outflows. Dedicated flatbed and temperature-controlled equipment gains prominence for sensitive components, a niche where carriers command premium rates. Competitive differentiation hinges on real-time visibility and just-in-time reliability, prompting investment in AI route-planning and sensor-equipped trailers. The United States Full-Truck-Load industry, therefore, witnesses asset mixtures tilting toward specialized rigs that lift yields and bolster carrier.
Outside manufacturing, construction sustains elevated volume on the back of federal infrastructure projects and robust residential demand. Wholesale & retail trade leverages cross-dock networks for e-commerce order pooling, while oil, gas, and mining lanes stay stable on equipment repositioning rhythms. Agriculture's seasonal output supports flexible capacity models, and emerging cannabis logistics further diversifies load mixes with high-margin, compliance-heavy freight.
The United States Full-Truck-Load (FTL) Market Report is Segmented by End User Industry (Agriculture, Fishing, and Forestry, Construction, Manufacturing, Oil and Gas, Mining and Quarrying, Wholesale and Retail Trade, and Others), and Destination (Domestic and International). The Market Forecasts are Provided in Terms of Value (USD).
List of Companies Covered in this Report:
- ArcBest
- C.H. Robinson
- Covenant Logistics Group Inc.
- CR England Inc.
- DHL Group
- Hirschbach Motor Lines Inc.
- J.B. Hunt Transport, Inc.
- Knight-Swift Transportation Holdings Inc.
- Landstar System Inc.
- Marten Transport Ltd.
- P.A.M. Transport Inc.
- Penske Logistics
- Prime Inc.
- R+L Carriers
- Ryder System, Inc.
- Schneider National Inc.
- TFI International Inc.
- TransAm Truck Lines Inc.
- United Parcel Service of America, Inc. (UPS)
- Werner Enterprises Inc.
Additional Benefits:
- The market estimate (ME) sheet in Excel format
- 3 months of analyst support
TABLE OF CONTENTS
1 Introduction
- 1.1 Study Assumptions and Market Definition
- 1.2 Scope of the Study
2 Research Methodology
3 Executive Summary
4 Market Landscape
- 4.1 Market Overview
- 4.2 GDP Distribution by Economic Activity
- 4.3 GDP Growth by Economic Activity
- 4.4 Economic Performance and Profile
- 4.4.1 Trends in E-Commerce Industry
- 4.4.2 Trends in Manufacturing Industry
- 4.5 Transport and Storage Sector GDP
- 4.6 Logistics Performance
- 4.7 Length of Roads
- 4.8 Export Trends
- 4.9 Import Trends
- 4.10 Fuel Pricing Trends
- 4.11 Trucking Operational Costs
- 4.12 Trucking Fleet Size by Type
- 4.13 Major Truck Suppliers
- 4.14 Road Freight Tonnage Trends
- 4.15 Road Freight Pricing Trends
- 4.16 Modal Share
- 4.17 Inflation
- 4.18 Regulatory Framework
- 4.19 Value Chain and Distribution Channel Analysis
- 4.20 Market Drivers
- 4.20.1 Explosive E-Commerce Parcelization
- 4.20.2 Manufacturing Reshoring and Near-Shore Trends
- 4.20.3 Infrastructure Investment and Jobs Act Freight Stimulus
- 4.20.4 Growth in Dedicated Contract Carriage
- 4.20.5 Cannabis-Supply Legalization Wave
- 4.20.6 Cold-Chain Pharma Expansion
- 4.21 Market Restraints
- 4.21.1 Driver Shortage and Escalating Labor Costs
- 4.21.2 Diesel-Price Volatility
- 4.21.3 Urban Congestion-Pricing Zones
- 4.21.4 Limited Public EV-Truck Charging Corridors
- 4.22 Technology Innovations in the Market
- 4.23 Porter's Five Forces Analysis
- 4.23.1 Threat of New Entrants
- 4.23.2 Bargaining Power of Buyers
- 4.23.3 Bargaining Power of Suppliers
- 4.23.4 Threat of Substitutes
- 4.23.5 Competitive Rivalry
5 Market Size and Growth Forecasts (Value, USD)
- 5.1 End User Industry
- 5.1.1 Agriculture, Fishing, and Forestry
- 5.1.2 Construction
- 5.1.3 Manufacturing
- 5.1.4 Oil and Gas, Mining and Quarrying
- 5.1.5 Wholesale and Retail Trade
- 5.1.6 Others
- 5.2 Destination
- 5.2.1 Domestic
- 5.2.2 International
6 Competitive Landscape
- 6.1 Market Concentration
- 6.2 Key Strategic Moves
- 6.3 Market Share Analysis
- 6.4 Company Profiles (Includes Global Level Overview, Market Level Overview, Core Segments, Financials as Available, Strategic Information, Market Rank/Share for Key Companies, Products and Services, and Recent Developments)
- 6.4.1 ArcBest
- 6.4.2 C.H. Robinson
- 6.4.3 Covenant Logistics Group Inc.
- 6.4.4 CR England Inc.
- 6.4.5 DHL Group
- 6.4.6 Hirschbach Motor Lines Inc.
- 6.4.7 J.B. Hunt Transport, Inc.
- 6.4.8 Knight-Swift Transportation Holdings Inc.
- 6.4.9 Landstar System Inc.
- 6.4.10 Marten Transport Ltd.
- 6.4.11 P.A.M. Transport Inc.
- 6.4.12 Penske Logistics
- 6.4.13 Prime Inc.
- 6.4.14 R+L Carriers
- 6.4.15 Ryder System, Inc.
- 6.4.16 Schneider National Inc.
- 6.4.17 TFI International Inc.
- 6.4.18 TransAm Truck Lines Inc.
- 6.4.19 United Parcel Service of America, Inc. (UPS)
- 6.4.20 Werner Enterprises Inc.
7 Market Opportunities and Future Outlook
- 7.1 White-Space and Unmet-Need Assessment
 2026年全球林業產品卡車運輸市場報告
 油氣壓力變送器市場:依壓力類型、測量原理、技術、安裝方式、壓力範圍、接觸介質材質、應用、最終用戶產業分類,全球預測(2026-2032年)
 半導體製造領域水資源回收市場分析及預測(至2035年):依類型、產品類型、服務、技術、組件、應用、製程、最終用戶、安裝類型及解決方案分類
 2026-2034年全球高空作業車市場規模、佔有率、趨勢及成長分析報告
 全球晶片製造本土化市場:預測(至2034年)-按晶片類型、本土化階段、製程技術、最終用戶和地區分類的分析
 2026-2030年全球整車運輸(FTL)市場整車運輸 (FTL) 服務市場:2026-2032 年全球預測(按合約類型、服務類型、客戶規模、承運商類型、設備類型、應用程式和最終用戶產業分類)
 印度整車運輸 (FTL):佔有率分析、產業趨勢、統計數據、成長預測 (2026-2031)
 包裹運輸市場規模、佔有率和成長分析(按服務、負載容量、營運類型、最終用途和地區分類)-2026-2033年產業預測
 小包裹市場:按運輸重量、最終用途行業和地區分類