


 |
市場調查報告書
商品編碼
1940706
非洲玻璃瓶和容器:市場佔有率分析、行業趨勢和統計數據、成長預測(2026-2031 年)Africa Glass Bottles And Containers - Market Share Analysis, Industry Trends & Statistics, Growth Forecasts (2026 - 2031) |
||||||
※ 本網頁內容可能與最新版本有所差異。詳細情況請與我們聯繫。
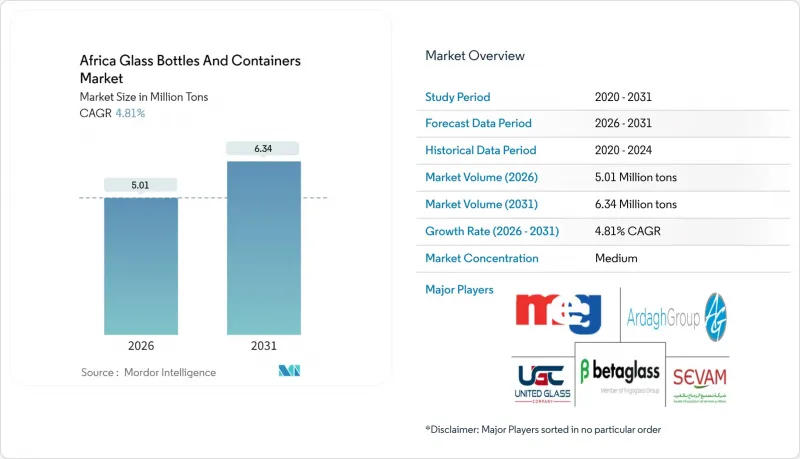
2025年非洲玻璃瓶和容器市場價值為478萬噸,預計從2026年的501萬噸成長到2031年的634萬噸,在預測期(2026-2031年)內複合年成長率為4.81%。
飲料消費的加速成長、可再生材料監管的日益嚴格以及都市區的壯大,共同支撐著市場成長;同時,非洲大陸自由貿易協定(AfCFTA)帶來的貿易便利化,也推動了高階包裝產品的潛在供應和出口成長。儘管市場競爭較為溫和,熔爐產能主要由少數區域領導企業掌控,但新參與企業正利用技術創新和在地化供應鏈來拓展市場。儘管能源價格和外匯波動帶來了日益成長的成本壓力,但終端用戶的偏好正逐漸轉向透明、輕盈、高階的玻璃瓶,以強化品牌形象。在此背景下,非洲玻璃瓶和容器市場持續超越整體包裝產業的成長軌跡,鞏固了其作為飲料、食品和化妝品品牌提升產品品質和永續性策略管道的地位。
非洲玻璃瓶及容器市場趨勢及洞察
飲料消費量不斷成長,對高檔包裝的需求也隨之增加。
2021年,非洲飲料產量達到1.41億百公升,以7%的成長率超越其他地區。這一產量成長推動了非洲玻璃瓶及容器市場的擴張,其主要驅動力來自跨國裝瓶商的日益增多以及當地精釀啤酒廠包裝品質的提升。光是南非一國就生產了3,100萬百升,並新增了一條釀造生產線,以滿足高階拉格啤酒的生產需求。同時,可口可樂飲料非洲公司在奈米比亞投資5,000萬美元,使其玻璃瓶產能提升30%,達到每小時2.7萬瓶。透明度、重量和產品真實性等高階因素促使消費者在都市區通路更傾向於選擇玻璃瓶而非PET瓶。同樣,這些特性也有助於延長透過低關稅的非洲大陸自由貿易區(AfCFTA)出口的酒精飲料的保存期限。因此,品牌擁有者將非洲玻璃瓶及容器市場視為一種能夠提升利潤且符合其永續性的包裝選擇。
監管機構推動使用食品級、可回收包裝
在關鍵地區,生產者延伸責任制(EPR)法規正在不斷加強,優先考慮閉合迴路包裝的材料選擇。南非的EPR框架於2021年5月生效,目標是到2026年達到65%的玻璃回收率。肯亞緊隨其後,於2022年頒布了《永續廢棄物管理法》,強制要求透過由環境管理局(NEMA)監督的四年計畫來落實該法規。摩洛哥的ONSSA標準要求食品包裝上使用雙語標籤,而埃及的合格評定計劃則包括對進口產品進行上市前檢驗。玻璃天然符合可回收性閾值,並且避免了塑膠面臨的遷移風險,確保了其長期效用。產業協會FEVE支持此政策方向,並強調設計完善的EPR系統能夠比押金制度實現更高的閉合迴路回收率。
輕質PET和鋁製容器的普及
輕質寶特瓶和鋁罐的市場佔有率正在被蠶食,由於運輸和處理成本降低,它們受到成本壓力較大的飲料填充商的青睞。奈及利亞的經濟動盪促使多家跨國公司採用更便宜的材料,例如,一些主要碳酸飲料品牌近期調整了產品組合。如今,阻隔塗層PET的氧氣透過率接近玻璃,而罐體製造商正利用現有的回收網路,將鋁定位為一種循環利用的選擇。玻璃製造商也推出了輕量化創新產品,例如180克裝的酒瓶,但大規模生產的規模化難度和資本密集度限制了其快速擴張。這種拉鋸戰限制了非洲玻璃瓶和容器市場近期的成長前景。
細分市場分析
到2025年,飲料業將佔非洲玻璃瓶和容器市場的62.12%,其中啤酒、葡萄酒和碳酸飲料是推動總產量成長的主要因素,因為它們優先考慮材料的阻隔性能和高階展示效果。啤酒仍是最大的消費品類,主要得益於南非3,100萬百公升的年產量和奈及利亞不斷擴大的產能。同時,烈酒生產商使用厚重的燧石瓶來強化品牌形象。碳酸飲料生產商正在投資可回收玻璃容器的循環系統,以滿足消費者對永續性的期望並保護飲料的風味。
預計到2031年,化妝品和個人護理品產業將以5.14%的複合年成長率成長,成為終端用戶中成長最快的產業,而其基準較低。可支配收入的成長推動了對裝在精美透明和彩色玻璃容器中的精華液、香水和高價值護膚品的需求。內羅畢和約翰尼斯堡的本土美妝企業家正在採用小瓶包裝以方便電商配送,這進一步刺激了非洲玻璃瓶和容器市場的需求。食品、醫藥和化學工業的需求保持穩定但相對小規模,這反映了優先考慮本地生產的監管規定和庫存策略。
非洲玻璃瓶和容器市場報告按最終用戶(飲料[酒精飲料(啤酒、葡萄酒、烈酒等)、非酒精飲料(碳酸軟性飲料(CSD)、乳製品飲料等)]、食品[果醬、果凍、調味品、醬料等]、化妝品和個人護理用品等)、顏色(無色、琥珀色、綠色等)和國家/地區進行細分。市場預測以噸為單位。
其他福利:
- Excel格式的市場預測(ME)表
- 3個月的分析師支持
目錄
第1章 引言
- 研究假設和市場定義
- 調查範圍
第2章調查方法
第3章執行摘要
第4章 市場情勢
- 市場概覽
- 市場促進因素
- 飲料消費量不斷成長,對高檔包裝的需求也隨之增加。
- 力推食品級、可回收包裝
- 都市區中產階級的壯大推動了啤酒和碳酸飲料消費量的成長。
- 非洲大陸自由貿易區(AfCFTA)內玻璃包裝產品的區域內貿易趨勢
- 精釀酒精和手工烈酒的蓬勃發展(對高檔玻璃製品的短期需求)
- 歐盟碳邊境調節機制(CBAM)對低碳出口包裝施加壓力
- 市場限制
- 輕質PET和鋁製容器的普及
- 高能源投入與電力可靠性成本
- 玻璃屑收集和回收基礎設施不足
- 外匯波動風險與堿灰進口關稅
- 產業供應鏈分析
- 非洲容器玻璃熔爐產能及位置
- 工廠選址及投產
- 生產能力
- 爐型
- 所產玻璃的顏色
- 貨櫃玻璃進出口資料-涵蓋主要進出口目的地
- 進口量及進口額(2021-2024 年)
- 出口量/出口額(2021-2024)
- 波特五力分析
- 新進入者的威脅
- 供應商的議價能力
- 買方的議價能力
- 替代品的威脅
- 競爭對手之間的競爭
- 原料分析
- 玻璃包裝的回收趨勢
- 玻璃包裝需求與供給分析
第5章 市場規模與成長預測
- 最終用戶
- 飲料
- 酒精飲料
- 啤酒
- 葡萄酒
- 烈酒
- 其他酒精飲料(蘋果酒和其他發酵飲料)
- 不含酒精的飲料
- 果汁
- 碳酸軟性飲料(CSD)
- 乳製品飲料
- 其他非酒精飲料
- 酒精飲料
- 食品(果醬、果凍、橘子醬、蜂蜜、香腸、調味品、食用油、醃菜)
- 化妝品和個人保健產品
- 藥品(不含管瓶和安瓿瓶)
- 香水
- 飲料
- 按顏色
- 綠色的
- 琥珀色
- 無色透明
- 其他顏色
- 按國家/地區
- 埃及
- 奈及利亞
- 肯亞
- 摩洛哥
- 南非
- 其他非洲地區
第6章 競爭情勢
- 市場集中度
- 策略趨勢與發展
- 公司市佔率分析(基於當前產能)
- 公司簡介
- Ardagh Group SA
- Middle East Glass Manufacturing Company SAE
- Beta Glass PLC
- Isanti Glass 1(Pty)Ltd
- Kandil Glass
- Saverglass SAS
- Consol Glass Pty Ltd
- African Glass Limited
- The National Company for Glass and Crystal SAE
- Verallia Packaging SAS
- Gerresheimer AG
- Arab Pharmaceutical Glass Company SAE
- Dalgen Packaging CC
- Nampak Limited
- OI Glass, Inc.
- United Glass Containers Company(UGC)
- Societe d'Exploitation de Verreries au Maroc(SEVAM)
第7章 市場機會與未來展望
The Africa Glass Bottles And Containers Market was valued at 4.78 Million tons in 2025 and estimated to grow from 5.01 Million tons in 2026 to reach 6.34 Million tons by 2031, at a CAGR of 4.81% during the forecast period (2026-2031).
Accelerating beverage consumption, regulatory momentum for recyclable materials, and an expanding urban middle-class underpin the upswing, while trade facilitation under AfCFTA broadens addressable volumes and premium-packaged export flows. Competitive intensity remains moderate because a handful of regional leaders control furnace capacity, yet new entrants leverage technological upgrades and localized supply chains to chip away at incumbents. End-user preferences increasingly tilt toward clear and lightweight premium bottles that reinforce brand image, even as energy prices and foreign-exchange volatility add cost pressure. Against this backdrop, the Africa glass bottles and containers market continues to outpace overall packaging growth trajectories, confirming its role as a strategic channel for beverage, food, and cosmetics brands aiming to signal product quality and sustainability.
Africa Glass Bottles And Containers Market Trends and Insights
Rising beverage consumption and premium-packaging demand
Africa's beverage output hit 141 million hectoliters in 2021, a 7% jump that outpaced all other regions. This volume growth anchors the expansion of the Africa glass bottles and containers market as multinational bottlers deepen footprints and local craft brewers upgrade presentation. South Africa alone produced 31 million hectoliters and has added new brewing lines to support premium lager variants, while Coca-Cola Beverages Africa invested USD 50 million in Namibia to lift throughput 30% at 27,000 bph, all packed in glass.Premium cues tied to clarity, weight, and perceived product integrity nudge consumers toward glass over PET in urban channels, and the same attributes bolster shelf-life for alcohol exports that now traverse tariff-light AfCFTA corridors. Consequently, brand owners view the Africa glass bottles and containers market as a margin-accretive packaging choice that aligns with sustainability commitments.
Regulatory push for food-grade, recyclable packaging
Extended Producer Responsibility (EPR) rules are tightening across key geographies, reshaping material selection in favor of closed-loop compatible containers. South Africa's EPR framework became effective in May 2021 and targets a 65% glass-recycling rate by 2026. Kenya followed with the Sustainable Waste Management Act 2022, mandating four-year compliance plans overseen by NEMA. Morocco's ONSSA standards require food-grade packaging with bilingual labeling, while Egypt's conformity program screens imports before market entry. Glass naturally satisfies recyclability thresholds and avoids migration risks that plastics face, cementing its long-term relevance. Industry association FEVE underscores that well-designed EPR schemes deliver higher closed-loop rates than deposit systems, validating policy direction.
Proliferation of PET and aluminium lightweight formats
Lightweight PET bottles and aluminum cans erode share by offering freight and handling savings that resonate with cost-squeezed beverage fillers. Economic turbulence in Nigeria prompted several multinationals to opt for cheaper substrates, an example being recent portfolio shifts by large CSD brands. Barrier-coated PET now achieves near-glass oxygen transmission rates, while can-makers leverage established recycling networks to position aluminum as a circular option. Glass suppliers counter with lightweighting breakthroughs such as 180 g spirit bottles, yet mass-production scalability and capital intensity temper rapid rollouts. The tug-of-war narrows the short-term growth outlook for the Africa glass bottles and containers market.
Other drivers and restraints analyzed in the detailed report include:
- Urban middle-class expansion boosting beer and CSD volumes
- AfCFTA-driven intra-Africa trade in glass-packaged goods
- High energy-input and power-reliability costs
For complete list of drivers and restraints, kindly check the Table Of Contents.
Segment Analysis
Beverage applications captured 62.12% of the Africa glass bottles and containers market size in 2025, underpinning overall tonnage because beer, wine, and carbonated drinks prize the material's barrier performance and premium shelf appeal. Beer remains the largest consumer on the back of South Africa's 31 million hectoliters output and Nigeria's capacity additions, while spirits leverage heavy flint bottles to reinforce brand stature. Carbonated soft-drink bottlers are investing in returnable-glass loops to align with consumer sustainability expectations and to safeguard flavor integrity.
Cosmetics and personal care, though starting from a lower baseline, are forecast to grow at a 5.14% CAGR through 2031, the fastest among end-users. Rising disposable incomes spur demand for serums, fragrances, and high-value skincare packaged in ornate flint or colored glass. Local beauty entrepreneurs in Nairobi and Johannesburg adopt smaller bottle formats to facilitate e-commerce fulfillment, creating ancillary demand pockets within the Africa glass bottles and containers market. Food, pharmaceutical, and chemical niches provide stable but comparatively lower volumes, reflecting regulated specifications and inventory strategies favoring local production runs.
The Africa Glass Bottles and Containers Market Report is Segmented by End-User (Beverages [Alcoholic {Beer, Wine, Spirits, and More}, and Non-Alcoholic {Carbonated Drinks (CSDs), Dairy Product Based Drinks, and More}], Food [Jam and Jelly, Condiments and Sauces, and More], Cosmetics and Personal Care, and More), Color (Flint, Amber, Green, and More) and Country. The Market Forecasts are Provided in Terms of Volume (Tons).
List of Companies Covered in this Report:
- Ardagh Group S.A.
- Middle East Glass Manufacturing Company S.A.E.
- Beta Glass PLC
- Isanti Glass 1 (Pty) Ltd
- Kandil Glass
- Saverglass SAS
- Consol Glass Pty Ltd
- African Glass Limited
- The National Company for Glass and Crystal S.A.E.
- Verallia Packaging S.A.S.
- Gerresheimer AG
- Arab Pharmaceutical Glass Company S.A.E.
- Dalgen Packaging CC
- Nampak Limited
- O-I Glass, Inc.
- United Glass Containers Company (UGC)
- Societe d'Exploitation de Verreries au Maroc (SEVAM)
Additional Benefits:
- The market estimate (ME) sheet in Excel format
- 3 months of analyst support
TABLE OF CONTENTS
1 INTRODUCTION
- 1.1 Study Assumptions and Market Definition
- 1.2 Scope of the Study
2 RESEARCH METHODOLOGY
3 EXECUTIVE SUMMARY
4 MARKET LANDSCAPE
- 4.1 Market Overview
- 4.2 Market Drivers
- 4.2.1 Rising beverage consumption and premium-packaging demand
- 4.2.2 Regulatory push for food-grade, recyclable packaging
- 4.2.3 Urban middle-class expansion boosting beer and CSD volumes
- 4.2.4 AfCFTA-driven intra-Africa trade in glass-packaged goods
- 4.2.5 Craft alcohol and artisan spirits boom (short-run premium glass)
- 4.2.6 EU CBAM pressure on low-carbon export packaging
- 4.3 Market Restraints
- 4.3.1 Proliferation of PET and aluminium lightweight formats
- 4.3.2 High energy-input and power-reliability costs
- 4.3.3 Poor cullet-collection and recycling infrastructure
- 4.3.4 FX volatility and soda-ash import tariffs
- 4.4 Industry Supply-Chain Analysis
- 4.5 Container Glass Furnace Capacity and Locations in Africa
- 4.5.1 Plant Locations and Year of Commencement
- 4.5.2 Production Capacities
- 4.5.3 Types of Furnaces
- 4.5.4 Color of Glass Produced
- 4.6 Export-Import Data of Container Glass - Covering Key Import and Export Destinations
- 4.6.1 Import Volume & Value, 2021-2024
- 4.6.2 Export Volume & Value, 2021-2024
- 4.7 Porter's Five Forces Analysis
- 4.7.1 Threat of New Entrants
- 4.7.2 Bargaining Power of Suppliers
- 4.7.3 Bargaining Power of Buyers
- 4.7.4 Threat of Substitutes
- 4.7.5 Competitive Rivalry
- 4.8 Raw Material Analysis
- 4.9 Recycling Trends for Glass Packaging
- 4.10 Demand vs Supply Analysis for Glass Packaging
5 MARKET SIZE AND GROWTH FORECASTS (VOLUME)
- 5.1 By End-user
- 5.1.1 Beverages
- 5.1.1.1 Alcoholic
- 5.1.1.1.1 Beer
- 5.1.1.1.2 Wine
- 5.1.1.1.3 Spirits
- 5.1.1.1.4 Other Alcoholic Beverages (Cider and Other Fermented Drinks)
- 5.1.1.2 Non-Alcoholic
- 5.1.1.2.1 Juices
- 5.1.1.2.2 Carbonated Drinks (CSDs)
- 5.1.1.2.3 Dairy Product Based Drinks
- 5.1.1.2.4 Other Non-Alcoholic Beverages
- 5.1.1.1 Alcoholic
- 5.1.2 Food (Jam, Jelly, Marmalades, Honey, Sausages and Condiments, Oil, Pickles)
- 5.1.3 Cosmetics and Personal Care
- 5.1.4 Pharmaceuticals (excluding Vials and Ampoules)
- 5.1.5 Perfumery
- 5.1.1 Beverages
- 5.2 By Color
- 5.2.1 Green
- 5.2.2 Amber
- 5.2.3 Flint
- 5.2.4 Other Colors
- 5.3 By Country
- 5.3.1 Egypt
- 5.3.2 Nigeria
- 5.3.3 Kenya
- 5.3.4 Morocco
- 5.3.5 South Africa
- 5.3.6 Rest of Africa
6 COMPETITIVE LANDSCAPE
- 6.1 Market Concentration
- 6.2 Strategic Moves and Developments
- 6.3 Company Market Share Analysis, (Based on Latest Production Capacity)
- 6.4 Company Profiles (includes Global level Overview, Market level overview, Core Segments, Financials as available, Strategic Information, Market Rank/Share for key companies, Products and Services, and Recent Developments)
- 6.4.1 Ardagh Group S.A.
- 6.4.2 Middle East Glass Manufacturing Company S.A.E.
- 6.4.3 Beta Glass PLC
- 6.4.4 Isanti Glass 1 (Pty) Ltd
- 6.4.5 Kandil Glass
- 6.4.6 Saverglass SAS
- 6.4.7 Consol Glass Pty Ltd
- 6.4.8 African Glass Limited
- 6.4.9 The National Company for Glass and Crystal S.A.E.
- 6.4.10 Verallia Packaging S.A.S.
- 6.4.11 Gerresheimer AG
- 6.4.12 Arab Pharmaceutical Glass Company S.A.E.
- 6.4.13 Dalgen Packaging CC
- 6.4.14 Nampak Limited
- 6.4.15 O-I Glass, Inc.
- 6.4.16 United Glass Containers Company (UGC)
- 6.4.17 Societe d'Exploitation de Verreries au Maroc (SEVAM)
7 MARKET OPPORTUNITIES AND FUTURE OUTLOOK
- 7.1 White-space and Unmet-Need Assessment
 玻璃瓶和容器:市場佔有率分析、行業趨勢和統計數據、成長預測(2026-2031)
 玻璃瓶和容器市場規模、佔有率和成長分析(按產品、應用、顏色、最終用途產業和地區分類)—產業預測(2026-2033 年)
 2025-2029年全球玻璃瓶與容器市場英國玻璃瓶和容器:市場佔有率分析、行業趨勢和成長預測(2025-2030 年)中東和非洲玻璃瓶和容器市場佔有率分析、行業趨勢、統計數據和成長預測(2025-2030)亞太地區玻璃瓶和容器:市場佔有率分析、行業趨勢和統計、成長預測(2025-2030 年)拉丁美洲玻璃瓶和容器:市場佔有率分析、行業趨勢和成長預測(2025-2030)歐洲玻璃瓶和容器:市場佔有率分析、行業趨勢和成長預測(2025-2030)
 玻璃瓶及容器市場機會、成長動力、產業趨勢分析及 2025 - 2034 年預測
 全球玻璃瓶和容器市場