


 |
市場調查報告書
商品編碼
1913347
逆向物流市場機會、成長要素、產業趨勢分析及預測(2026年至2035年)Reverse Logistics Market Opportunity, Growth Drivers, Industry Trend Analysis, and Forecast 2026 - 2035 |
||||||
全球逆向物流市場預計到 2025 年將達到 8,726 億美元,到 2035 年將達到 1.75 兆美元,年複合成長率為 7.3%。
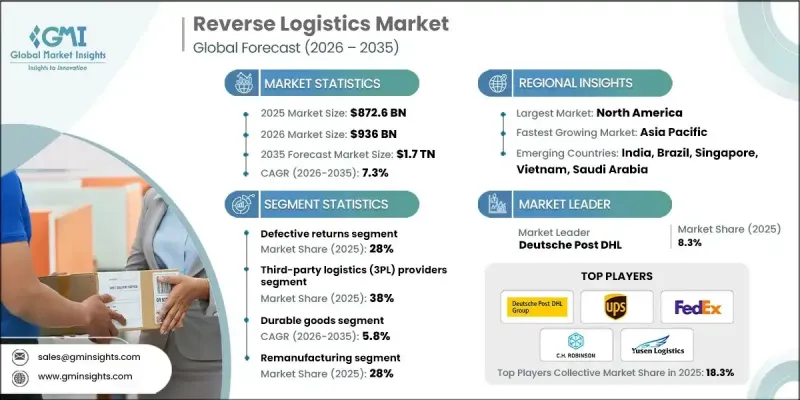
市場成長的驅動力在於企業日益重視環境責任,並致力於實現更廣泛的永續性目標。逆向物流透過系統性地收集、再利用和負責任地處置退貨產品,協助企業減少廢棄物,從而幫助企業降低環境影響,並加強其企業社會責任。永續性也正成為競爭優勢,消費者越來越支持那些實踐負責任商業營運的企業。數位商務的快速發展顯著增加了退貨量,因此需要一個高效率的系統來管理產品在供應鏈中的流動。簡化的退貨流程與客戶滿意度、品牌可靠性和長期客戶維繫密切相關。逆向物流還能透過回收退貨價值、提高材料利用效率和減少對新投入的依賴來支持成本控制。隨著企業追求循環經濟模式和業務永續營運,逆向物流作為一項戰略能力,在全球範圍內對零售、製造和分銷網路的重要性日益凸顯。
| 市場覆蓋範圍 | |
|---|---|
| 開始年份 | 2025 |
| 預測年份 | 2026-2035 |
| 起始值 | 8726億美元 |
| 預測金額 | 1.75兆美元 |
| 複合年成長率 | 7.3% |
預計到2025年,缺陷退貨將佔總退貨量的28%。大量不合格產品持續推動逆向物流,尤其是在技術主導和消費導向產業。各組織正擴大利用先進的診斷工具和供應商協作工具來控制缺陷相關的成本。隨著監管審查力度加大和透明度要求提高,產品召回事件也增加。
預計2026年至2035年,耐用消費品產業將以5.8%的複合年成長率成長。高回收率、可再生以及持續的次市場需求是推動其強勁成長的主要因素。此外,由於合規要求、生命週期管理和環境因素的影響,與消費品相關的逆向物流活動也不斷擴展。
美國逆向物流市場預計到2025年將達到1,600億美元,並有望在2035年前保持強勁成長。高回收率推動了對自動化、數據驅動分類和更快處理週期的投資。許多公司正在將逆向物流業務外包,以提高效率和客戶體驗,而永續性和ESG(環境、社會和治理)舉措也持續推動再利用和回收專案的加速發展。
目錄
第1章調查方法
第2章執行摘要
第3章業界考察
- 生態系分析
- 供應商情況
- 利潤率分析
- 成本結構
- 每個階段的附加價值
- 影響價值鏈的因素
- 中斷
- 產業影響因素
- 促進要素
- 由於網路購物的成長,電子商務退貨率上升
- 廢棄物管理和回收的監管要求
- 人們對永續性和循環經濟的日益關注
- 從退貨和可再生材料中回收成本的潛力
- 技術進步:人工智慧、物聯網和區塊鏈在追蹤和自動化領域的應用
- 產業潛在風險與挑戰
- 退貨運輸和處理成本高昂
- 多通路退貨管理的複雜性
- 市場機遇
- 與綠色物流和碳足跡減少舉措相結合
- 翻新和二手市場的擴張
- 引進智慧逆向物流解決方案(人工智慧、預測分析)
- 製造商、零售商和回收公司之間的合作
- 成長潛力分析
- 監管環境
- 北美洲
- 美國-《資源保護與回收法》(RCRA)與《生產者延伸責任法》(EPR)
- 加拿大—《加拿大環境保護法》(CEPA)和省級生產者責任延伸計劃
- 歐洲
- 英國- 廢棄電子電氣設備 (WEEE) 法規
- 德國 - 循環經濟法 (Kreislaufwirtschaftsgesetz)
- 法國-循環經濟廢棄物減量法案(AGEC法案)
- 義大利 - 環境法(第 152/2006 號法令)
- 西班牙—廢棄物和污染土壤法
- 亞太地區
- 中國——生產者延伸責任制和固態廢棄物污染防治法
- 日本-家用電器回收法和汽車回收法
- 印度 - 電子廢棄物管理規則和塑膠廢棄物管理規則
- 拉丁美洲
- 巴西 - 國家固態廢棄物政策 (PNRS)
- 墨西哥 -廢棄物預防和綜合管理總法 (LGPGIR)
- 阿根廷 - 綜合廢棄物管理法
- 中東和非洲
- 阿拉伯聯合大公國 - 聯邦廢棄物管理法
- 南非 - 國家環境管理:廢棄物法
- 沙烏地阿拉伯 -廢棄物管理法規
- 北美洲
- 波特五力分析
- PESTEL 分析
- 科技與創新趨勢
- 當前技術趨勢
- 新興技術
- 成本細分分析
- 開發成本結構
- 研發費用分析
- 行銷和銷售成本
- 專利分析
- 永續性和環境方面
- 永續實踐
- 減少廢棄物策略
- 生產中的能源效率
- 環保舉措
- 回報行為和回報率的趨勢
- 按產業和產品類型分析回報率
- 寬鬆的退貨政策對逆向物流量的影響
- 季節性和促銷活動帶來的收益波動
- 逆向物流營運中的風險狀況
- 未來營運模式與產業演變
- 基於平台的逆向物流生態系統
- 去中心化和按需退貨處理
- 零廢棄物政策的長期影響
第4章 競爭情勢
- 介紹
- 公司市佔率分析
- 北美洲
- 歐洲
- 亞太地區
- 拉丁美洲
- 中東和非洲
- 主要市場公司的競爭分析
- 競爭定位矩陣
- 戰略展望矩陣
- 重大進展
- 併購
- 夥伴關係與合作
- 新產品發布
- 企業擴張計畫和資金籌措
第5章 依製造流程分類的市場估算與預測,2021-2034年
- 退貨管理
- 再製造
- 回收利用
- 處理
- 其他
6. 2021-2034年按收入分類的市場估計與預測
- 瑕疵退貨
- 徵收的收入
- B2B 和商業回報
- 可修復退貨
- 生命終點回歸
- 其他
7.服務供應商市場估算與預測,2021-2034 年
- 內部逆向物流
- 第三方物流(3PL) 供應商
- 回收公司
- 廢棄物管理公司
第8章 按類別分類的市場估計和預測,2022-2035年
- 耐久性消費品
- 消耗品
- 工業設備
- 包裝材料
- 其他
第9章 依最終用途分類的市場估計與預測,2021-2034年
- 零售與電子商務
- 電子設備
- 車
- 製藥
- 製造業
- 其他
第10章 2022-2035年各地區市場估計與預測
- 北美洲
- 美國
- 加拿大
- 歐洲
- 德國
- 英國
- 法國
- 義大利
- 西班牙
- 俄羅斯
- 北歐國家
- 葡萄牙
- 克羅埃西亞
- 比荷盧經濟聯盟
- 亞太地區
- 中國
- 印度
- 日本
- 澳洲
- 韓國
- 新加坡
- 泰國
- 印尼
- 越南
- 拉丁美洲
- 巴西
- 墨西哥
- 阿根廷
- 哥倫比亞
- 中東和非洲
- 南非
- 沙烏地阿拉伯
- 阿拉伯聯合大公國
- 土耳其
第11章 公司簡介
- 世界玩家
- Deutsche Post DHL
- United Parcel Service(UPS)
- FedEx
- CMA CGM
- DB Schenker
- CEVA Logistics
- XPO Logistics
- Ryder System
- CH Robinson Worldwide
- Yusen Logistics
- Kintetsu World Express
- Ingram Micro Commerce &Lifecycle Services
- Logistics Plus
- 區域玩家
- NFI Industries
- Pitney Bowes
- Blue Dart Express
- Safexpress
- Reverse Logistics
- Stena Recycling
- R2 Logistics
- Inmar Intelligence
- Emerging/Disruptor Players
- Happy Returns(a PayPal company)
- Optoro
- ReverseLogix
- Apto Solutions
- Forterra Solutions
- Core Logistic
- Softbox Systems
- R2 Logistics
- Forterra Solutions
The Global Reverse Logistics Market was valued at USD 872.6 billion in 2025 and is estimated to grow at a CAGR of 7.3% to reach USD 1.75 trillion by 2035.
Market growth is driven by stronger corporate focus on environmental responsibility and alignment with broader sustainability objectives. Reverse logistics supports waste reduction by enabling structured recovery, reuse, and responsible disposal of returned products, helping organizations reduce environmental impact while strengthening corporate responsibility commitments. Sustainability has also become a competitive differentiator, as consumers increasingly favor companies that demonstrate responsible operational practices. The rapid expansion of digital commerce has significantly increased return volumes, intensifying the need for efficient systems to manage product movement back through the supply chain. Streamlined return handling is now closely tied to customer satisfaction, brand trust, and long-term retention. Reverse logistics also supports cost control by recovering value from returned goods, improving material efficiency, and reducing reliance on new inputs. As companies pursue circular economy models and operational resilience, reverse logistics has become a strategic function across retail, manufacturing, and distribution networks worldwide.
| Market Scope | |
|---|---|
| Start Year | 2025 |
| Forecast Year | 2026-2035 |
| Start Value | $872.6 Billion |
| Forecast Value | $1.75 Trillion |
| CAGR | 7.3% |
The defective returns segment held 28% share in 2025. High volumes of nonconforming products continue to drive reverse flows, particularly across technology-driven and consumer-focused industries. Organizations are increasingly applying advanced diagnostics and supplier collaboration tools to limit defect-related costs. Product recalls are also rising as regulatory oversight and transparency expectations continue to increase.
The durable goods segment is forecast to grow at a CAGR of 5.8% from 2026 to 2035. Strong performance is supported by higher return frequency, refurbishment potential, and sustained secondary market demand. Reverse logistics activity related to consumable products is also expanding, influenced by compliance requirements, lifecycle management, and environmental considerations.
U.S. Reverse Logistics Market reached USD 160 billion in 2025 and is expected to show strong growth through 2035. High return rates are driving investment in automation, data-driven sorting, and faster processing cycles. Many businesses are outsourcing reverse operations to improve efficiency and customer experience, while sustainability mandates and ESG initiatives continue to accelerate reuse and recovery programs.
Major companies operating in the Global Reverse Logistics Market include United Parcel Service (UPS), Deutsche Post DHL, FedEx, DB Schenker, CEVA Logistics, C.H. Robinson Worldwide, Yusen Logistics, Kintetsu World Express, NFI Industries, Optoro, and ReverseLogix. Companies in the Global Reverse Logistics Market are strengthening their competitive position through automation, digital platforms, and service integration. Investments in artificial intelligence and data analytics are improving return visibility, grading accuracy, and processing speed. Strategic partnerships with retailers and manufacturers help expand service scope and secure long-term contracts. Many providers are enhancing sustainability-focused offerings to support recycling, refurbishment, and resale initiatives. Geographic expansion and localized return centers are being used to reduce transportation costs and turnaround times. Firms are also differentiating through end-to-end solutions that integrate transportation, warehousing, and data management.
Table of Contents
Chapter 1 Methodology
- 1.1 Market scope and definition
- 1.2 Research design
- 1.2.1 Research approach
- 1.2.2 Data collection methods
- 1.3 Data mining sources
- 1.3.1 Global
- 1.3.2 Regional/Country
- 1.4 Base estimates and calculations
- 1.4.1 Base year calculation
- 1.4.2 Key trends for market estimation
- 1.5 Primary research and validation
- 1.5.1 Primary sources
- 1.6 Forecast
- 1.7 Research assumptions and limitations
Chapter 2 Executive Summary
- 2.1 Industry 360° synopsis, 2022 - 2035
- 2.2 Key market trends
- 2.2.1 Regional
- 2.2.2 Processes
- 2.2.3 Return
- 2.2.4 Service provider
- 2.2.5 Category
- 2.2.6 End use
- 2.3 TAM Analysis, 2026-2035
- 2.4 CXO perspectives: Strategic imperatives
- 2.4.1 Executive decision points
- 2.4.2 Critical success factors
- 2.5 Future outlook & strategic recommendations
Chapter 3 Industry Insights
- 3.1 Industry ecosystem analysis
- 3.1.1 Supplier landscape
- 3.1.2 Profit margin analysis
- 3.1.3 Cost structure
- 3.1.4 Value addition at each stage
- 3.1.5 Factor affecting the value chain
- 3.1.6 Disruptions
- 3.2 Industry impact forces
- 3.2.1.1 Growth drivers
- 3.2.1.2 Increasing e-commerce returns due to online shopping growth.
- 3.2.1.3 Regulatory mandates for waste management and recycling.
- 3.2.1.4 Rising focus on sustainability and circular economy adoption.
- 3.2.1.5 Cost recovery potential from returned goods and recyclable materials.
- 3.2.1.6 Technological advancements: AI, IoT, and blockchain for tracking and automation
- 3.2.2 Industry pitfalls and challenges
- 3.2.2.1 High operational costs for transportation and processing of returns.
- 3.2.2.2 Complexity in managing multi-channel returns.
- 3.2.3 Market opportunities
- 3.2.3.1 Integration with green logistics and carbon footprint reduction initiatives.
- 3.2.3.2 Expansion of refurbished and secondary markets.
- 3.2.3.3 Adoption of smart reverse logistics solutions (AI, predictive analytics).
- 3.2.3.4 Partnerships between manufacturers, retailers, and recycling firms.
- 3.3 Growth potential analysis
- 3.4 Regulatory landscape
- 3.4.1 North America
- 3.4.1.1 U.S. - Resource Conservation and Recovery Act (RCRA) & Extended Producer Responsibility (EPR) Laws
- 3.4.1.2 Canada - Canadian Environmental Protection Act (CEPA) & Provincial EPR Programs
- 3.4.2 Europe
- 3.4.2.1 UK - Waste Electrical and Electronic Equipment (WEEE) Regulations
- 3.4.2.2 Germany - Circular Economy Act (Kreislaufwirtschaftsgesetz)
- 3.4.2.3 France - Anti-Waste Law for a Circular Economy (AGEC Law)
- 3.4.2.4 Italy - Environmental Code (Legislative Decree 152/2006)
- 3.4.2.5 Spain - Waste and Contaminated Soils Law
- 3.4.3 Asia Pacific
- 3.4.3.1 China - Extended Producer Responsibility System & Solid Waste Pollution Prevention Law
- 3.4.3.2 Japan - Home Appliance Recycling Act & End-of-Life Vehicle Recycling Law
- 3.4.3.3 India - E-Waste Management Rules & Plastic Waste Management Rules
- 3.4.4 Latin America
- 3.4.4.1 Brazil - National Solid Waste Policy (PNRS)
- 3.4.4.2 Mexico - General Law for Waste Prevention and Integral Management (LGPGIR)
- 3.4.4.3 Argentina - Integrated Waste Management Law
- 3.4.5 Middle East & Africa
- 3.4.5.1 UAE - Federal Law on Waste Management
- 3.4.5.2 South Africa - National Environmental Management: Waste Act
- 3.4.5.3 Saudi Arabia - Waste Management Regulation
- 3.4.1 North America
- 3.5 Porter's analysis
- 3.6 PESTEL analysis
- 3.7 Technology and innovation landscape
- 3.7.1 Current technological trends
- 3.7.2 Emerging technologies
- 3.8 Cost breakdown analysis
- 3.8.1 Development cost structure
- 3.8.2 R&D cost analysis
- 3.8.3 Marketing & sales costs
- 3.9 Patent analysis
- 3.10 Sustainability and environmental aspects
- 3.10.1 Sustainable practices
- 3.10.2 Waste reduction strategies
- 3.10.3 Energy efficiency in production
- 3.10.4 Eco-friendly Initiatives
- 3.11 Returns behavior & return-rate dynamics
- 3.11.1 Return rate analysis by industry and product category
- 3.11.2 Impact of liberal return policies on reverse logistics volumes
- 3.11.3 Seasonal and promotional return fluctuations
- 3.12 Risk landscape in reverse logistics operations
- 3.13 Future operating models & industry evolution
- 3.13.1 Platform-based reverse logistics ecosystems
- 3.13.2 Decentralized and on-demand return processing
- 3.13.3 Long-term implications of zero-waste mandates
Chapter 4 Competitive Landscape, 2025
- 4.1 Introduction
- 4.2 Company market share analysis
- 4.2.1 North America
- 4.2.2 Europe
- 4.2.3 Asia Pacific
- 4.2.4 LATAM
- 4.2.5 MEA
- 4.3 Competitive analysis of major market players
- 4.4 Competitive positioning matrix
- 4.5 Strategic outlook matrix
- 4.6 Key developments
- 4.6.1 Mergers & acquisitions
- 4.6.2 Partnerships & collaborations
- 4.6.3 New Product Launches
- 4.6.4 Expansion Plans and funding
Chapter 5 Market Estimates & Forecast, By Processes, 2021 - 2034 ($Bn)
- 5.1 Key trends
- 5.2 Returns management
- 5.3 Remanufacturing
- 5.4 Recycling
- 5.5 Disposal
- 5.6 Others
Chapter 6 Market Estimates & Forecast, By Return, 2021 - 2034 ($Bn)
- 6.1 Key trends
- 6.2 Defective returns
- 6.3 Recalled returns
- 6.4 B2B returns and commercial returns
- 6.5 Repairable returns
- 6.6 End of life returns
- 6.7 Others
Chapter 7 Market Estimates & Forecast, By Service Provider, 2021 - 2034 ($Bn)
- 7.1 Key trends
- 7.2 In-house reverse logistics
- 7.3 Third-party logistics (3PL) Providers
- 7.4 Recycling companies
- 7.5 Waste management companies
Chapter 8 Market Estimates & Forecast, By Category, 2022 - 2035 (USD Mn)
- 8.1 Key trends
- 8.2 Durable Goods
- 8.3 Consumables
- 8.4 Industrial Equipment
- 8.5 Packaging Materials
- 8.6 Others
Chapter 9 Market Estimates & Forecast, By End Use, 2021 - 2034 ($Bn)
- 9.1 Key trends
- 9.2 Retail & E-commerce
- 9.3 Electronics
- 9.4 Automotive
- 9.5 Pharmaceuticals
- 9.6 Manufacturing
- 9.7 Others
Chapter 10 Market Estimates & Forecast, By Region, 2022 - 2035 (USD Mn)
- 10.1 Key trends
- 10.2 North America
- 10.2.1 US
- 10.2.2 Canada
- 10.3 Europe
- 10.3.1 Germany
- 10.3.2 UK
- 10.3.3 France
- 10.3.4 Italy
- 10.3.5 Spain
- 10.3.6 Russia
- 10.3.7 Nordics
- 10.3.8 Portugal
- 10.3.9 Croatia
- 10.3.10 Benelux
- 10.4 Asia Pacific
- 10.4.1 China
- 10.4.2 India
- 10.4.3 Japan
- 10.4.4 Australia
- 10.4.5 South Korea
- 10.4.6 Singapore
- 10.4.7 Thailand
- 10.4.8 Indonesia
- 10.4.9 Vietnam
- 10.5 Latin America
- 10.5.1 Brazil
- 10.5.2 Mexico
- 10.5.3 Argentina
- 10.5.4 Colombia
- 10.6 MEA
- 10.6.1 South Africa
- 10.6.2 Saudi Arabia
- 10.6.3 UAE
- 10.6.4 Turkey
Chapter 11 Company Profiles
- 11.1 Global Players
- 11.1.1 Deutsche Post DHL
- 11.1.2 United Parcel Service (UPS)
- 11.1.3 FedEx
- 11.1.4 CMA CGM
- 11.1.5 DB Schenker
- 11.1.6 CEVA Logistics
- 11.1.7 XPO Logistics
- 11.1.8 Ryder System
- 11.1.9 C.H. Robinson Worldwide
- 11.1.10 Yusen Logistics
- 11.1.11 Kintetsu World Express
- 11.1.12 Ingram Micro Commerce & Lifecycle Services
- 11.1.13 Logistics Plus
- 11.2 Regional Players
- 11.2.1 NFI Industries
- 11.2.2 Pitney Bowes
- 11.2.3 Blue Dart Express
- 11.2.4 Safexpress
- 11.2.5 Reverse Logistics
- 11.2.6 Stena Recycling
- 11.2.7 R2 Logistics
- 11.2.8 Inmar Intelligence
- 11.3 Emerging / Disruptor Players
- 11.3.1 Happy Returns (a PayPal company)
- 11.3.2 Optoro
- 11.3.3 ReverseLogix
- 11.3.4 Apto Solutions
- 11.3.5 Forterra Solutions
- 11.3.6 Core Logistic
- 11.3.7 Softbox Systems
- 11.3.8 R2 Logistics
- 11.3.9 Forterra Solutions
 逆向物流市場規模、佔有率、成長及全球產業分析:按類型、應用和地區分類,並提供 2026-2034 年的洞察和預測
 美國逆向物流:市場佔有率分析、產業趨勢與統計、成長預測(2026-2031)
 逆向物流市場報告:按退貨類型、服務、最終用戶和地區分類(2026-2034 年)
 2026-2030年全球逆向物流自動化軟體市場
 逆向供應鏈解決方案市場按服務類型、技術、流程步驟、通路類型、材料類型、最終用戶和應用分類-2026-2032年全球預測日本逆向物流市場報告(依退貨類型、服務、最終用戶和地區分類,2026-2034年)
 逆向物流市場規模、佔有率和成長分析(按退貨類型、服務、最終用戶產業和地區分類)-2026-2033年產業預測
 2032年農業價值鏈逆向物流市場預測:按產品類型、逆向物流類型、最終用戶和地區分類的全球分析可回收包裝市場預測至2032年:逆向物流-按材料、包裝類型、應用、最終用戶和地區分類的全球分析
 全球逆向物流市場