


 |
市場調查報告書
商品編碼
1939655
資料即服務 (DaaS):市場佔有率分析、產業趨勢與統計資料、成長預測 (2026-2031)Data As A Service - Market Share Analysis, Industry Trends & Statistics, Growth Forecasts (2026 - 2031) |
||||||
※ 本網頁內容可能與最新版本有所差異。詳細情況請與我們聯繫。
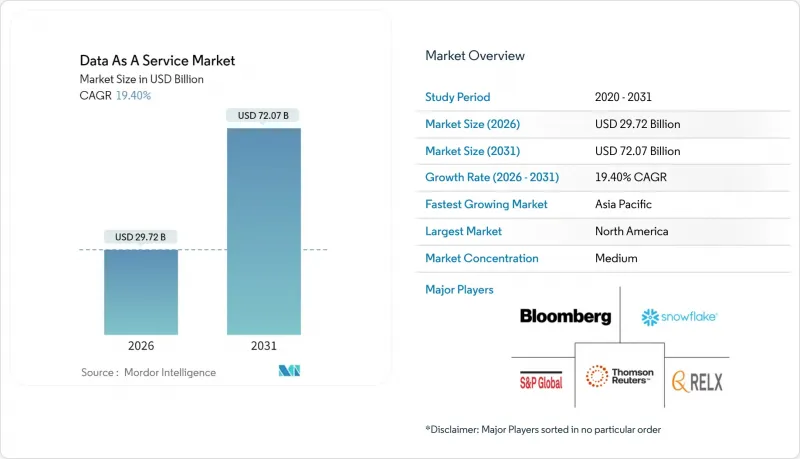
預計數據即服務 (DaaS) 市場將從 2025 年的 248.9 億美元成長到 2026 年的 297.2 億美元,到 2031 年將達到 720.7 億美元,2026 年至 2031 年的複合年成長率為 19.4%。
企業正在加速投入,以實現自身資料的商業化,採用API優先的交付方式,並支援需要可刷新外部資料集的AI模型。即時分析的潛力、雲端儲存成本的下降以及奈米資料集市場的興起,共同推動了潛在市場規模的擴大。經營團隊報告稱,這些投入帶來了可衡量的成果,91%的公司表示,分析投資顯著提高了效率和決策速度。產業成長仍不均衡:銀行、金融和保險(BFSI)產業率先採用,而醫療保健產業則實現了最快的成長。隨著企業在資料主權和成本控制之間尋求平衡,混合部署模式正在迅速普及。儘管北美仍然是最大的收入來源,但亞太地區在數據本地化法律和數位轉型計畫的推動下,正主導成長。
全球數據即服務 (DaaS) 市場趨勢與洞察
企業向數據驅動決策轉型
已實施統一資料平台的機構,其資訊搜尋速度提升了 3-5 倍,回應準確率提高了 50-70%。金融機構在強調其反詐欺計畫帶來的顯著成效的同時,也意識到自身在高階人工智慧應用場景方面的能力存在不足,因此加大了對強巨量資料基礎設施的投資。隨著經營團隊將資料視為策略性企業資產而非單純的 IT 產品,統一資料平台的採用速度正在加快。因此,投資正轉向能夠將內部記錄與外部高階資料來源即時整合的整合層。這一促進因素支撐了各行業對可擴展、與模式無關的服務的持續需求。
非結構化資料的爆炸性成長和對即時分析的需求
非結構化內容已佔企業資料的80%,但預算分配卻遠低於此,凸顯了其尚未開發的商業潛力。針對非結構化資料工具的創業投資資金,例如一項針對人工智慧資料管道的4000萬美元資金籌措,顯示了投資者對專用處理平台的信心。毫秒級的即時分析正在將行銷執行轉變為高度個人化,從而提升轉換率。已實施搜尋增強生成框架的組織報告稱,人工智慧錯誤資訊減少了70%至90%,這進一步強化了持續數據更新的商業價值。這些趨勢共同推動了數據即服務(DaaS)市場的擴張,並促進了對向量資料庫和串流管道的投資。
資料隱私和網路安全問題
到2024年中期,美國將有20個州頒布全面的隱私法,而擬議的聯邦立法則提案實施國家標準,這將增加合規成本。 46%的組織認為隱私是實現其資料品質目標的主要障礙。特定產業的法規增加了複雜性:醫療機構必須確保病患資料管理符合HIPAA(健康保險流通與責任法案)的要求,同時也要擴大雲端採用。基於司法管轄區的資料居住要求迫使醫療機構在多個地區維護資料副本,從而增加了營運成本。在自動化和策略即程式碼工具成熟之前,這些因素將阻礙雲端技術的普及,尤其是在監管嚴格的行業。
細分市場分析
到2025年,銀行、金融和保險(BFSI)產業將佔總收入的28.30%,其嚴格的合規要求和先進的詐欺偵測工作負載將支撐資料即服務(DaaS)市場的發展。醫療保健產業將成為各產業中成長最快的產業,複合年成長率(CAGR)將達到21.8%,這主要得益於醫院採用人工智慧輔助診斷和人群健康分析技術。 IT和電信公司正在整合資料集以最佳化網路,政府也正在擴展依賴安全資料交換的電子服務。製造業和能源產業的現有企業正在採用預測性維護模型,而這些模型需要持續的感測器資料供應。
預計到2024年,醫療機構在雲端服務方面的平均支出將達到3,800萬美元,對遷移結果的滿意度高達72%。電子健康記錄、影像庫和基因組學的整合正在推動對非結構化資料管道的需求。零售商正在利用即時數據流,透過個人化推薦擴展購物車規模;教育機構正在試點融合人工智慧的學習平台。這些多樣化的應用案例凸顯了數據即服務(DaaS)市場的策略重要性。
到2025年,公共雲端將佔總收入的53.40%,這得益於其成熟的安全認證和豐富的託管服務工具包。然而,混合雲和多重雲端方案將以22.2%的複合年成長率呈現最強勁的成長,因為企業會最佳化資料放置,以降低資料傳輸費用並滿足居住要求。在延遲和資料主權至關重要的產業,例如金融和國防,私有雲端仍然是一個可行的選擇。
鑑於工作負載的彈性和敏感度存在差異,90% 的企業計劃在 2027 年前採用混合策略。資料架構架構和跨平台控制層正日益普及,它們能夠實現流暢的資料移動,而無需依賴特定供應商。隨著成本計算器能夠量化資料傳輸成本,財務領導者正在推動相關政策,將分析表部署在更靠近 AI 運行時的位置。這些趨勢擴大了標榜配置中立的數據即服務 (DaaS) 市場平台的潛在基本客群。
區域分析
北美地區將佔2025年總收入的38.95%,這得益於資金雄厚的買家和強大的創投生態系統,後者正推動數據基礎設施的創新。光是AWS就服務約420萬全球客戶,充分展現了該地區雲端運算的成熟度。美國資料中心的電力消耗量將在2023年達到176太瓦時(TWh),並可能由於生成式人工智慧工作負載的激增,到2028年增至325-580太瓦時。加拿大對主權的重視推動了對符合其居住法律的國內市場節點的需求。該地區的政策組合正在促進支持安全多方分析的隱私增強技術的發展,從而推動了數據即服務(DaaS)市場的擴張。
亞太地區成長最快,年複合成長率高達24.0%,這主要得益於各國政府對數位走廊和雲端區域的大力投資。印度受益於其「數位印度」計畫和超大規模超大規模資料中心業者在該地區的業務擴張,而日本則已從微軟和亞馬遜雲端服務(AWS)獲得數十億美元的投資承諾,用於建立下一代資料中心。行動服務為該地區GDP貢獻了5.3%,並產生了大量的主導資料集。在資料居住規則的推動下,本地資料市場蓬勃發展,並影響全球服務供應商的部署選擇。
歐洲正經歷穩定成長,GDPR框架和永續性要求指導架構決策。 Global Switch等供應商承諾在2030年實現100%再生能源,使資料中心擴張與綠色能源目標保持一致。法國、德國和北歐國家憑藉其高彈性的電網和較低的PUE值(電源使用效率)吸引了大量資料中心容量。南美洲的成長主要集中在巴西,該國的財政激勵措施吸引了雲端服務提供者。同時,中東和非洲的資料中心部署則集中在金融科技中心。位置策略仍然是關鍵的採購標準,美國80%的資料中心負載集中在僅15個州,凸顯了集中風險。
其他福利:
- Excel格式的市場預測(ME)表
- 3個月的分析師支持
目錄
第1章 引言
- 市場定義與研究假設
- 調查範圍
第2章調查方法
第3章執行摘要
第4章 市場情勢
- 市場概覽
- 市場促進因素
- 企業向數據驅動決策轉型
- 非結構化資料的爆炸性成長和對即時分析的需求
- 雲端儲存/運算成本下降
- AI RAG框架中可刷新外部資料的需求
- 數據本地化法律將有助於促進區域數據市場的發展。
- API優先的「微資料集」貨幣化平台
- 市場限制
- 資料隱私和網路安全問題
- 數據品質和互通性差距
- 超大規模資料中心業者不斷上漲的出口費用給利潤率帶來壓力。
- 能源密集型數據管道的ESG監測
- 價值鏈分析
- 關鍵法規結構評估
- 關鍵相關人員影響評估
- 技術展望
- 波特五力分析
- 供應商的議價能力
- 消費者議價能力
- 新進入者的威脅
- 替代品的威脅
- 競爭對手之間的競爭
- 宏觀經濟因素的影響
第5章 市場規模與成長預測
- 按最終用戶行業分類
- BFSI
- 資訊科技/通訊
- 政府和公共部門
- 零售與電子商務
- 醫療保健和生命科學
- 製造業
- 能源與公共產業
- 教育
- 其他
- 按部署模式
- 公共雲端
- 私有雲端
- 混合/多重雲端
- 依資料類型
- 結構化資料
- 非結構化數據
- 半結構化數據
- 最終用戶公司規模
- 主要企業
- 小型企業
- 透過使用
- 即時營運分析
- 客戶和市場情報
- 風險與合規管理
- 供應鍊和物流最佳化
- 詐欺檢測和信用評分
- 產品和定價分析
- 其他
- 按地區
- 北美洲
- 美國
- 加拿大
- 墨西哥
- 南美洲
- 巴西
- 阿根廷
- 南美洲其他地區
- 歐洲
- 德國
- 英國
- 法國
- 義大利
- 西班牙
- 俄羅斯
- 其他歐洲地區
- 亞太地區
- 中國
- 日本
- 印度
- 韓國
- 澳洲和紐西蘭
- 亞太其他地區
- 中東和非洲
- 中東
- 沙烏地阿拉伯
- 阿拉伯聯合大公國
- 土耳其
- 其他中東地區
- 非洲
- 南非
- 奈及利亞
- 埃及
- 其他非洲地區
- 中東
- 北美洲
第6章 競爭情勢
- 市場集中度
- 策略趨勢
- 市佔率分析
- 公司簡介
- Bloomberg Finance LP
- Dow Jones and Company, Inc.
- Environmental Systems Research Institute, Inc.
- Equifax Inc.
- FactSet Research Systems Inc.
- IBM Corporation
- Oracle Corporation
- SAP SE
- Thomson Reuters Corporation
- Morningstar, Inc.
- Moody's Analytics, Inc.
- Mastercard Advisors LLC
- S&P Global Inc.
- RELX PLC(LexisNexis Risk Solutions)
- ZoomInfo Technologies Inc.
- Snowflake Inc.
- Experian PLC
- Verisk Analytics, Inc.
- CoreLogic, Inc.
- TransUnion LLC
- NielsenIQ(The Nielsen Company LLC)
- SafeGraph Inc.
- GapMaps Pty Ltd.
- Apify Technologies sro
第7章 市場機會與未來趨勢
- 評估差距和未滿足的需求
The Data as a Service market is expected to grow from USD 24.89 billion in 2025 to USD 29.72 billion in 2026 and is forecast to reach USD 72.07 billion by 2031 at 19.4% CAGR over 2026-2031.
Enterprises accelerate spending to monetize proprietary data, adopt API-first delivery, and support AI models that demand refreshable external datasets. Real-time analytics expectations, falling unit costs for cloud storage, and the rise of nanodataset marketplaces collectively widen the addressable opportunity. Leadership teams report measurable gains, with 91% of firms citing tangible improvements in efficiency and decision speed from analytics investments. Sector growth remains uneven: BFSI anchors early adoption, healthcare records the fastest trajectory, and hybrid deployment models surge as organizations balance data sovereignty with cost control. North America supplies the largest revenue pool, yet Asia-Pacific leads in growth as data-localization laws and digital transformation agendas converge.
Global Data As A Service Market Trends and Insights
Enterprise Shift Toward Data-Driven Decision-Making
Organizations that embed unified data platforms record information-retrieval cycles that are three to five times faster and response-accuracy improvements of 50-70% . Finance institutions highlight strong returns from anti-fraud programs yet acknowledge capability gaps in advanced AI use cases, spurring incremental spending on robust data infrastructure. Adoption accelerates as executives treat data as a strategic corporate asset rather than an IT by-product. Investment therefore shifts toward integration layers able to blend internal records with premium external feeds in real time. The driver supports sustained demand for scalable, schema-agnostic services across verticals.
Explosion of Unstructured Data and Real-Time Analytics Demand
Unstructured content already represents 80% of enterprise data while attracting disproportionately low budgets, underscoring an untapped monetization pool. Venture financing in unstructured-data tooling-exemplified by a USD 40 million round for AI-ready data pipelines-signals confidence in specialized processing platforms . Live-time analytics, measured in milliseconds, has shifted marketing execution toward hyper-personalization that raises conversion metrics. Organisations adopting retrieval-augmented generation frameworks report 70-90% reductions in AI hallucinations, reinforcing the business case for continuous data refresh. Collectively these trends widen the scope of the Data as a Service market and encourage investment in vector databases and streaming pipelines.
Data-Privacy and Cybersecurity Concerns
Twenty US states enacted comprehensive privacy statutes by mid-2024, and a proposed federal bill would introduce nationwide standards that raise compliance costs. Forty-six percent of enterprises cite privacy as their primary impediment to data-quality goals. Sector-specific rules add complexity: healthcare organisations must align patient-data controls with HIPAA while scaling cloud adoption. Jurisdiction-based residency mandates force providers to maintain multiple in-region copies, increasing operational overhead. These factors temper uptake, especially in highly regulated verticals, until automation and policy-as-code tooling mature.
Other drivers and restraints analyzed in the detailed report include:
- Falling Cloud Storage and Compute Costs
- AI RAG Frameworks' Appetite for Refreshable External Data
- Data-Quality and Interoperability Gaps
For complete list of drivers and restraints, kindly check the Table Of Contents.
Segment Analysis
The BFSI sector retained 28.30% of overall revenue in 2025, anchoring the Data as a Service market through stringent compliance mandates and sophisticated fraud-detection workloads. Healthcare logged a 21.8% CAGR, the fastest among industries, as hospitals embrace AI-supported diagnostics and population-health analytics. IT and telecommunications firms integrate datasets for network optimisation, while governments expand e-services that depend on secure data exchanges. Manufacturing and energy incumbents deploy predictive-maintenance models requiring continuous sensor feeds.
Healthcare organisations spent an average USD 38 million on cloud services in 2024 and reported 72% satisfaction with migration outcomes. The convergence of electronic health records, imaging repositories, and genomics drives demand for unstructured-data pipelines. Retailers leverage real-time feeds for personalised recommendations that raise basket sizes, whereas education institutions pilot AI-infused learning platforms. These varied use cases reinforce the strategic relevance of the Data as a Service market.
Public-cloud instances captured 53.40% of 2025 revenue, benefiting from mature security certifications and rich managed-service toolkits. Hybrid and multi-cloud approaches, however, post the strongest growth at 22.2% CAGR as organisations optimise data placement to mitigate egress fees and satisfy residency requirements. Private-cloud options persist where latency and sovereignty hold sway, notably in finance and defence.
Ninety percent of enterprises intend to run hybrid strategies by 2027, reflecting widespread recognition that workload characteristics vary in elasticity and sensitivity. Data-fabric architectures and cross-plane control layers thus rise in popularity, enabling fluid movement without vendor lock-in. As cost calculators quantify egress liabilities, finance chiefs lobby for placement policies that keep analytic tables close to AI runtimes. These developments enlarge the addressable base for Data as a Service market platforms that advertise deployment neutrality.
Data As A Service Market Report is Segmented by End-User Industry (BFSI, IT and Telecommunications, and More), Deployment Model (Public Cloud, Private Cloud, Hybrid/Multi-cloud), Data Type (Structured Data, Unstructured Data, Semi-Structured Data), End-User Enterprise Size (Large Enterprises, and More), Application (Real-Time Operational Analytics, and More), and Geography. The Market Forecasts are Provided in Terms of Value (USD).
Geography Analysis
North America held 38.95% of 2025 revenue, sustained by well-capitalised buyers and deep venture ecosystems that refine data-infrastructure innovations. AWS alone serves an estimated 4.2 million global customers, illustrating the region's cloud maturity. United States data-centre consumption reached 176 TWh in 2023 and could rise to 325-580 TWh by 2028 as generative-AI workloads proliferate. Canada emphasises sovereignty, stimulating demand for in-country marketplace nodes that comply with residency statutes. The regional policy mix encourages privacy-enhancing technologies that underpin secure multi-party analytics and broaden the Data as a Service market.
Asia-Pacific records the fastest expansion, advancing at a 24.0% CAGR as governments channel capital toward digital corridors and cloud zones. India benefits from the Digital India programme and hyperscaler region launches, while Japan secures multi-billion-dollar commitments from Microsoft and AWS for next-generation facilities. Mobile services add 5.3% to regional GDP, creating a vast stream of localisation-driven datasets . Local data-marketplaces thrive under residency rules, shaping deployment choices for global providers.
Europe posts steady gains as the GDPR framework and sustainability mandates steer architectural decisions. Providers like Global Switch commit to 100% renewable electricity usage by 2030, aligning data-centre expansions with green-energy goals. France, Germany, and the Nordics attract capacity through resilient grids and cool climates that trim PUE ratios. South America's growth concentrates in Brazil where fiscal incentives entice cloud operators, whereas the Middle East and Africa see selective uptake clustered in fintech hubs. Location strategy remains a core purchase criterion as 80% of US data-centre load resides in just 15 states, revealing concentration risks.
- Bloomberg Finance L.P.
- Dow Jones and Company, Inc.
- Environmental Systems Research Institute, Inc.
- Equifax Inc.
- FactSet Research Systems Inc.
- IBM Corporation
- Oracle Corporation
- SAP SE
- Thomson Reuters Corporation
- Morningstar, Inc.
- Moody's Analytics, Inc.
- Mastercard Advisors LLC
- S&P Global Inc.
- RELX PLC (LexisNexis Risk Solutions)
- ZoomInfo Technologies Inc.
- Snowflake Inc.
- Experian PLC
- Verisk Analytics, Inc.
- CoreLogic, Inc.
- TransUnion LLC
- NielsenIQ (The Nielsen Company LLC)
- SafeGraph Inc.
- GapMaps Pty Ltd.
- Apify Technologies s.r.o.
Additional Benefits:
- The market estimate (ME) sheet in Excel format
- 3 months of analyst support
TABLE OF CONTENTS
1 INTRODUCTION
- 1.1 Market Definition and Study Assumptions
- 1.2 Scope of the Study
2 RESEARCH METHODOLOGY
3 EXECUTIVE SUMMARY
4 MARKET LANDSCAPE
- 4.1 Market Overview
- 4.2 Market Drivers
- 4.2.1 Enterprise shift toward data-driven decision-making
- 4.2.2 Explosion of unstructured data and real-time analytics demand
- 4.2.3 Falling cloud storage/compute costs
- 4.2.4 AI RAG frameworks' appetite for refreshable external data
- 4.2.5 Data-localization laws fuelling regional data marketplaces
- 4.2.6 API-first ''nano-datasets'' monetisation platforms
- 4.3 Market Restraints
- 4.3.1 Data-privacy and cybersecurity concerns
- 4.3.2 Data-quality and interoperability gaps
- 4.3.3 Rising hyperscaler egress fees compressing margins
- 4.3.4 ESG scrutiny of energy-intensive data pipelines
- 4.4 Value Chain Analysis
- 4.5 Evaluation of Critical Regulatory Framework
- 4.6 Impact Assessment of Key Stakeholders
- 4.7 Technological Outlook
- 4.8 Porter's Five Forces Analysis
- 4.8.1 Bargaining Power of Suppliers
- 4.8.2 Bargaining Power of Consumers
- 4.8.3 Threat of New Entrants
- 4.8.4 Threat of Substitutes
- 4.8.5 Intensity of Competitive Rivalry
- 4.9 Impact of Macro-economic Factors
5 MARKET SIZE AND GROWTH FORECASTS (VALUE)
- 5.1 By End-User Industry
- 5.1.1 BFSI
- 5.1.2 IT and Telecommunications
- 5.1.3 Government and Public Sector
- 5.1.4 Retail and E-commerce
- 5.1.5 Healthcare and Life Sciences
- 5.1.6 Manufacturing
- 5.1.7 Energy and Utilities
- 5.1.8 Education
- 5.1.9 Others
- 5.2 By Deployment Model
- 5.2.1 Public Cloud
- 5.2.2 Private Cloud
- 5.2.3 Hybrid / Multi-cloud
- 5.3 By Data Type
- 5.3.1 Structured Data
- 5.3.2 Unstructured Data
- 5.3.3 Semi-structured Data
- 5.4 By End-user Enterprise Size
- 5.4.1 Large Enterprises
- 5.4.2 Small and Medium Enterprises
- 5.5 By Application
- 5.5.1 Real-time Operational Analytics
- 5.5.2 Customer and Marketing Intelligence
- 5.5.3 Risk and Compliance Management
- 5.5.4 Supply-Chain and Logistics Optimisation
- 5.5.5 Fraud Detection and Credit Scoring
- 5.5.6 Product and Pricing Analytics
- 5.5.7 Others
- 5.6 By Geography
- 5.6.1 North America
- 5.6.1.1 United States
- 5.6.1.2 Canada
- 5.6.1.3 Mexico
- 5.6.2 South America
- 5.6.2.1 Brazil
- 5.6.2.2 Argentina
- 5.6.2.3 Rest of South America
- 5.6.3 Europe
- 5.6.3.1 Germany
- 5.6.3.2 United Kingdom
- 5.6.3.3 France
- 5.6.3.4 Italy
- 5.6.3.5 Spain
- 5.6.3.6 Russia
- 5.6.3.7 Rest of Europe
- 5.6.4 Asia-Pacific
- 5.6.4.1 China
- 5.6.4.2 Japan
- 5.6.4.3 India
- 5.6.4.4 South Korea
- 5.6.4.5 Australia and New Zealand
- 5.6.4.6 Rest of Asia-Pacific
- 5.6.5 Middle East and Africa
- 5.6.5.1 Middle East
- 5.6.5.1.1 Saudi Arabia
- 5.6.5.1.2 United Arab Emirates
- 5.6.5.1.3 Turkey
- 5.6.5.1.4 Rest of Middle East
- 5.6.5.2 Africa
- 5.6.5.2.1 South Africa
- 5.6.5.2.2 Nigeria
- 5.6.5.2.3 Egypt
- 5.6.5.2.4 Rest of Africa
- 5.6.5.1 Middle East
- 5.6.1 North America
6 COMPETITIVE LANDSCAPE
- 6.1 Market Concentration
- 6.2 Strategic Moves
- 6.3 Market Share Analysis
- 6.4 Company Profiles (includes Global level Overview, Market level overview, Core Segments, Financials as available, Strategic Information, Market Rank/Share for key companies, Products and Services, and Recent Developments)
- 6.4.1 Bloomberg Finance L.P.
- 6.4.2 Dow Jones and Company, Inc.
- 6.4.3 Environmental Systems Research Institute, Inc.
- 6.4.4 Equifax Inc.
- 6.4.5 FactSet Research Systems Inc.
- 6.4.6 IBM Corporation
- 6.4.7 Oracle Corporation
- 6.4.8 SAP SE
- 6.4.9 Thomson Reuters Corporation
- 6.4.10 Morningstar, Inc.
- 6.4.11 Moody's Analytics, Inc.
- 6.4.12 Mastercard Advisors LLC
- 6.4.13 S&P Global Inc.
- 6.4.14 RELX PLC (LexisNexis Risk Solutions)
- 6.4.15 ZoomInfo Technologies Inc.
- 6.4.16 Snowflake Inc.
- 6.4.17 Experian PLC
- 6.4.18 Verisk Analytics, Inc.
- 6.4.19 CoreLogic, Inc.
- 6.4.20 TransUnion LLC
- 6.4.21 NielsenIQ (The Nielsen Company LLC)
- 6.4.22 SafeGraph Inc.
- 6.4.23 GapMaps Pty Ltd.
- 6.4.24 Apify Technologies s.r.o.
7 MARKET OPPORTUNITIES AND FUTURE TRENDS
- 7.1 White-space and Unmet-need Assessment


