


 |
市場調查報告書
商品編碼
1939137
智慧工廠:市場佔有率分析、產業趨勢與統計、成長預測(2026-2031)Smart Factory - Market Share Analysis, Industry Trends & Statistics, Growth Forecasts (2026 - 2031) |
||||||
※ 本網頁內容可能與最新版本有所差異。詳細情況請與我們聯繫。
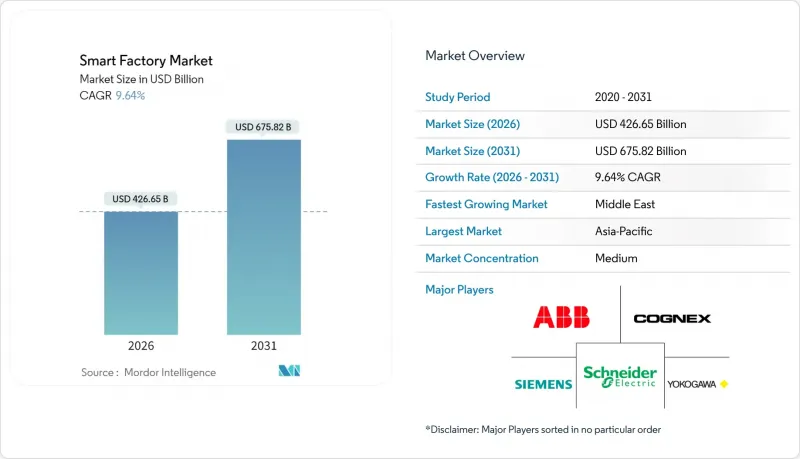
預計到 2026 年,智慧工廠市場規模將達到 4,266.5 億美元,高於 2025 年的 3,891.4 億美元,預計到 2031 年將達到 6,758.2 億美元。
預計2026年至2031年年複合成長率(CAGR)為9.64%。
對自主和數據驅動型生產系統的強勁需求、感測器和邊緣人工智慧成本的下降以及政策獎勵的支持,共同推動了這一成長趨勢。製造商正在採用工業IoT平台、數位雙胞胎和機器視覺引導機器人,以縮短換線時間、降低能耗並減少離散製造和流程產業的廢棄物。東南亞和中東地區的新投資正在加速成長,而由於碳定價機制的加強,歐洲和北美地區現有設施的維修也勢頭強勁。競爭格局有利於能夠提供硬體、軟體和網路安全保全服務整合解決方案的供應商,從而加快製造商的投資回報週期。
全球智慧工廠市場趨勢與洞察
工業IoT平台的廣泛應用
工業IoT平台整合了感測器、致動器和控制系統,建構即時數據管道,從而驅動預測性維護和自主最佳化。標準化通訊協定和邊緣閘道器最大限度地降低了部署複雜性,並實現了跨傳統資產的經濟高效部署。例如,Guidewheel 在 2024 年籌集了 3,100 萬美元,用於加速其即插即用的 FactoryOps 解決方案的開發,該方案無需重新佈線即可傳輸機器資料。製造執行系統 (MES) 擴大整合物聯網連接器,負責人吞吐量、品質和能源指標的統一視圖。專用 5G 網路的廣泛應用進一步增強了物聯網的價值提案,實現了汽車組裝上安全的人機協作所需的亞毫秒延遲。國家補貼計劃,例如印度的食品加工生產關聯獎勵計劃 (PLI),正在降低早期財務門檻,並鼓勵中小企業更多地採用物聯網技術。
端到端能源最佳化的需求
不斷上漲的電費和淨零排放目標使能源效率成為經營團隊的首要任務。智慧工廠平台透過應用基於人工智慧的預測、自動負載平衡和功率因數校正,可將能耗降低20%至40%。寶馬雷根斯堡工廠在實施一套連接400個感測器的AI能源管理系統後,電力消耗降低了30%。數位雙胞胎技術允許在設備安裝前建造動態的熱流和氣流模型,從而減少空調設備的過度設計,避免資金浪費。參與需量反應計劃可以幫助工廠調整生產計劃並穩定電網,從而產生額外收入。歐盟的綠色稅收優惠政策可以加快投資回報,鼓勵製造商用智慧逆變器取代固定速度驅動裝置,並採用能夠為低碳生產提供最佳時機提案的節能型MES模組。
改造現有工廠需要大量的初始資本投資。
將一座2010年以前建成的工廠改造為互聯工廠通常需要花費超過1000萬美元,其中包括電氣升級、網路佈線和停機時間。傳統的PLC可能沒有乙太網路端口,需要客製化韌體和通訊協定轉換器,這會增加工程工時。Schneider Electric估計,現有工廠的投資回收期長達五年,而新建設的投資回收期僅為兩年,這給資金有限的中型企業帶來了一定的障礙。雖然模組化維修套件和訂閱定價模式正在減輕負擔,但宏觀經濟的不確定性仍然讓財務長保持謹慎。
細分市場分析
工業機器人是最大的收入來源,預計到2025年將佔據智慧工廠市場佔有率的31.35%。需求主要來自關節靈活、協作性強的機器人,它們能夠減輕工人重複性且對人體工學要求高的任務。隨著終端用戶利用模組化硬體實現不同型號之間的無縫銜接,無需重新改造即可使用,機器人技術驅動的智慧工廠市場規模正在穩步成長。儘管目前機器視覺系統規模較小,但預計到2031年,在深度學習相機價格下降的推動下,其複合年成長率將達到10.08%。整合機器人和視覺功能的單元能夠減少檢測工作量,並將一次性合格率提升至六標準差水準。隨著原始設備製造商(OEM)不斷整合節能韌體,智慧驅動器和伺服馬達等控制組件正經歷良性更新。感測器陣列的廣泛應用仍在繼續,它們能夠將振動、溫度和濕度數據傳輸到預測性維護儀表板,從而防止非計劃性停機。
私有5G連接與時間敏感型網路技術的整合將為自主移動機器人提供確定性的無線鏈路,從而實現按需交付。積層製造將促進漸進式成長,尤其是在航太工具和醫療植入。同時,外骨骼和穿戴式掃描儀在輕型組裝環境中的出現,模糊了機器人技術與人類增強之間的界線。整體產品趨勢反映出自動化系統正從孤立的「孤島」轉變為整合生態系統轉變,其中邊緣運算節點能夠即時協調視覺、運動和品質分析。
區域分析
到2025年,亞太地區將佔全球收入佔有率的40.20%,鞏固中國作為全球製造業核心的地位。 「中國製造2025」等強而有力的政府政策正在津貼智慧工廠維修,而韓國和台灣則大力投資3D視覺技術和半導體製造工廠。越南、泰國和印尼透過稅收優惠和數位化產業園區吸引外商直接投資。該地區控制著全球80%的稀土元素磁體提煉量,這進一步凸顯了其主導地位,也為當地機器人製造商提供了供應鏈優勢。網路安全和勞動力技能提升仍然是挑戰,但政策制定者正在啟動全國性的技能提升計劃,以應對人才短缺問題。
中東是成長最快的地區,年複合成長率達10.02%。沙烏地阿拉伯1300億美元的國家工業戰略和阿拉伯聯合大公國的「3000億美元行動」計畫正將大量資金投入石化聯合企業和先進材料工廠。待開發區工廠從一開始就能採用模組化、網路安全架構,避免了代價高昂的傳統維修。主權財富基金正與歐洲和亞洲的供應商合作,建立合資企業,以實現機器人組裝和製造執行系統(MES)軟體客製化的本地化。沿岸地區獨特的高溫高塵環境,對耐環境腐蝕的防護罩和先進的冷卻解決方案提出了獨特的需求。
隨著製造業回流北美的趨勢日益明顯,北美市場蓄勢待發。 《晶片與科學法案》將向配備封閉回路型輻射控制和人工智慧缺陷分類功能的新型晶圓廠注入數十億美元資金。汽車製造商正投資電池組生產線和軟體定義車輛架構,這些都需要高頻寬的工廠內部網路。歐洲製造商為響應碳中和的《55歲以上人群適用性法案》,持續升級其工廠,並利用綠色稅額扣抵和能源價格對沖來證明智慧工廠預算的合理性。南美洲和非洲市場雖然規模較小,但仍充滿潛力,各國政府正尋求稅收優惠和公私合營,以減少對資源出口的依賴。
其他福利:
- Excel格式的市場預測(ME)表
- 3個月的分析師支持
目錄
第1章 引言
- 研究假設和市場定義
- 調查範圍
第2章調查方法
第3章執行摘要
第4章 市場情勢
- 市場概覽
- 市場促進因素
- 工業IoT平台的廣泛應用
- 端到端能源最佳化的需求
- 加大政府對智慧製造的獎勵
- 用於即時品管的邊緣AI晶片
- 開放原始碼數位雙胞胎可降低整合成本
- 在綠色稅收制度下維修現有工廠
- 市場限制
- 改造現有設施需要較高的初始資本投入。
- OT網路中的網路安全漏洞
- 具備互通能力的OT-IT人才短缺
- 機器人致動器稀土供應不穩定
- 產業價值鏈分析
- 宏觀經濟因素的影響
- 監管環境
- 技術展望
- 波特五力分析
- 供應商的議價能力
- 買方的議價能力
- 新進入者的威脅
- 替代品的威脅
- 競爭強度
第5章 市場規模與成長預測
- 依產品類型
- 機器視覺系統
- 相機
- 處理器
- 軟體
- 圍欄
- 影像擷取卡
- 整合服務
- 照明
- 工業機器人
- 關節機器人
- 笛卡兒機器人
- 圓柱形機器人
- SCARA機器人
- 並聯機器人
- 協作工業機器人
- 控制設備
- 繼電器和開關
- 伺服馬達和驅動器
- 感應器
- 通訊科技
- 有線
- 無線的
- 其他產品類型
- 機器視覺系統
- 透過技術
- 產品生命週期管理(PLM)
- 人機介面(HMI)
- 企業資源規劃(ERP)
- 製造執行系統(MES)
- 分散式控制系統(DCS)
- 監控與數據採集(SCADA)
- 可程式邏輯控制器(PLC)
- 其他技術
- 按最終用戶行業分類
- 車
- 半導體
- 石油和天然氣
- 化工/石油化工
- 製藥
- 航太與國防
- 食品/飲料
- 礦業
- 其他終端用戶產業
- 按地區
- 北美洲
- 美國
- 加拿大
- 墨西哥
- 南美洲
- 巴西
- 阿根廷
- 南美洲其他地區
- 歐洲
- 德國
- 英國
- 法國
- 義大利
- 其他歐洲地區
- 亞太地區
- 中國
- 日本
- 印度
- 韓國
- 澳洲和紐西蘭
- 亞太其他地區
- 中東
- 沙烏地阿拉伯
- 阿拉伯聯合大公國
- 土耳其
- 其他中東地區
- 非洲
- 南非
- 奈及利亞
- 肯亞
- 其他非洲地區
- 北美洲
第6章 競爭情勢
- 市場集中度
- 策略趨勢
- 市佔率分析
- 公司簡介
- Siemens AG
- ABB Ltd
- Schneider Electric SE
- Rockwell Automation Inc.
- Honeywell International Inc.
- Mitsubishi Electric Corporation
- Fanuc Corporation
- Emerson Electric Co.
- Yokogawa Electric Corporation
- KUKA AG
- Cognex Corporation
- Robert Bosch GmbH
- Teledyne FLIR LLC
- General Electric Company
- Cisco Systems Inc.
- SAP SE
- PTC Inc.
- Dassault Systemes SE
- Intel Corporation
- Hewlett Packard Enterprise Company
第7章 市場機會與未來展望
The smart factory market size in 2026 is estimated at USD 426.65 billion, growing from 2025 value of USD 389.14 billion with 2031 projections showing USD 675.82 billion, growing at 9.64% CAGR over 2026-2031.
Robust demand for autonomous, data-driven production systems, falling sensor and edge AI costs, and supportive policy incentives underpin this trajectory. Manufacturers deploy industrial IoT platforms, digital twins, and machine-vision-guided robotics to shrink changeover times, cut energy use, and reduce scrap across discrete and process industries. Greenfield investments accelerate in Southeast Asia and the Middle East, while brownfield retrofits gather momentum in Europe and North America as carbon-pricing regimes tighten. Competitive dynamics favor vendors able to bundle hardware, software, and cybersecurity services into integrated offerings that shorten payback periods for manufacturers.
Global Smart Factory Market Trends and Insights
Growing Adoption of Industrial IoT Platforms
Industrial IoT platforms unify sensors, actuators, and control systems, creating real-time data pipelines that drive predictive maintenance and autonomous optimization. Standardized protocols and edge gateways minimize deployment complexity, enabling cost-effective rollout across legacy equipment. Guidewheel, for example, raised USD 31 million in 2024 to accelerate its plug-and-play FactoryOps solution that streams machine data without invasive rewiring. Manufacturing execution systems increasingly embed IoT connectors, giving planners a single pane of glass for throughput, quality, and energy metrics. The spread of private 5G networks further strengthens IoT value propositions by delivering sub-millisecond latency required for safe human-robot collaboration on automotive assembly lines. National subsidy programs such as India's Production-Linked Incentive Scheme for food processing lower early-stage financial barriers and broaden adoption among small and medium enterprises.
Demand for End-to-End Energy Optimization
Rising electricity tariffs and net-zero targets turn energy efficiency into a board-level priority. Smart factory platforms cut consumption 20-40% by applying AI-based forecasting, automated load-balancing, and power-factor correction. BMW's Regensburg plant reports 30% lower electricity use after deploying an AI energy management system connected to 400 sensors. Digital twins let engineers model thermal and airflow dynamics before equipment installation, reducing HVAC oversizing and avoiding capital waste. Participation in demand-response programs generates ancillary revenue as factories flex production schedules to support grid stability. European Union green-tax credits accelerate return on investment, prompting manufacturers to replace fixed-speed drives with smart inverters and to install energy-aware MES modules that recommend low-carbon production windows.
High Upfront CAPEX for Brownfield Transformation
Converting pre-2010 factories into connected plants often costs more than USD 10 million once electrical upgrades, network cabling, and downtime are included. Legacy PLCs may lack Ethernet ports, forcing custom firmware and protocol converters that add engineering hours. Schneider Electric estimates brownfield payback can stretch to five years versus two years for greenfield builds, discouraging mid-market firms with limited cash buffers. Modular retrofit kits and subscription pricing models partially ease the burden, yet CFOs remain cautious amid macroeconomic uncertainty.
Other drivers and restraints analyzed in the detailed report include:
- Rising Government Incentives for Smart Manufacturing
- Edge AI Chips Enabling Real-Time Quality Control
- Cybersecurity Vulnerabilities within OT Networks
For complete list of drivers and restraints, kindly check the Table Of Contents.
Segment Analysis
Industrial robotics generated the largest revenue slice, accounting for 31.35% smart factory market share in 2025. Demand stems from articulated and collaborative units that lift repetitive ergonomically taxing tasks from workers. The smart factory market size attributed to robotics grows steadily as end-users exploit modular hardware that can shift across models without re-tooling. Machine vision systems, though smaller today, register an 10.08% CAGR through 2031 as deep-learning cameras become affordable. Integrated robot-vision cells reduce inspection labor and push first-pass yield toward six sigma. Control components such as smart drives and servo motors see healthy replacement cycles as OEMs embed power-saving firmware. Sensor arrays continue broad deployment, feeding vibration, temperature, and humidity data into predictive maintenance dashboards that prevent unplanned downtime.
The convergence of private 5G connectivity and time-sensitive networking creates deterministic wireless links for autonomous mobile robots that deliver kits just-in-sequence. Additive manufacturing contributes incremental growth, especially in aerospace tooling and medical implants requiring customized geometries. Meanwhile, exoskeletons and wearable scanners emerge in light-assembly environments, blurring lines between robotics and human augmentation. The overall product landscape reflects a shift from standalone automation islands to orchestrated ecosystems where edge compute nodes coordinate vision, motion, and quality analytics in real time.
The Smart Factory Market Report is Segmented by Product Type (Machine Vision Systems, Industrial Robotics, Control Devices, Sensors, and More), Technology (PLM, HMI, ERP, MES, DCS, SCADA, PLC, and More), End-User Industry (Automotive, Semiconductors, Oil and Gas, Chemical and Petrochemical, Pharmaceutical, Aerospace and Defense, Food and Beverage, and More), and Geography. The Market Forecasts are Provided in Terms of Value (USD).
Geography Analysis
Asia Pacific captured 40.20% share of 2025 revenue as China cemented its position as the global manufacturing nucleus. Robust governmental agendas such as "Made in China 2025" subsidize smart factory retrofits, while South Korea and Taiwan pour resources into 3D vision and semiconductor fabs. Vietnam, Thailand, and Indonesia lure foreign direct investment with tax holidays and digital-friendly industrial parks. The region's dominance is further underpinned by its control of 80% of rare-earth magnet refining, giving local robotics producers supply-chain leverage. Cybersecurity and workforce reskilling remain pain points, but policy authorities launch nationwide upskilling programs to address talent gaps.
The Middle East is the fastest-growing region at a 10.02% CAGR. Saudi Arabia's USD 130 billion National Industrial Strategy and the UAE's Operation 300bn funnel capital into petrochemical complexes and advanced materials plants. Greenfield construction means factories can embed modular, cyber-secure architectures from day one, avoiding costly legacy remediation. Sovereign wealth funds partner with European and Asian vendors, establishing joint ventures that localize robot assembly and MES software customization. The heat and dust characteristic of Gulf environments drive unique demand for ruggedized enclosures and advanced cooling solutions.
North American momentum accelerates as reshoring gains ground. The CHIPS and Science Act channels billions into new fabs equipped with closed-loop lithography control and AI defect classification. Automotive OEMs invest in battery pack lines and software-defined vehicle architectures that demand high-bandwidth in-plant networks. European manufacturers continue upgrading factories in response to carbon "Fit for 55" legislation, leveraging green-tax credits and energy-price hedging to justify smart factory budgets. South America and Africa remain smaller but promising as governments explore tax incentives and public-private partnerships to diversify away from commodity exports.
- Siemens AG
- ABB Ltd
- Schneider Electric SE
- Rockwell Automation Inc.
- Honeywell International Inc.
- Mitsubishi Electric Corporation
- Fanuc Corporation
- Emerson Electric Co.
- Yokogawa Electric Corporation
- KUKA AG
- Cognex Corporation
- Robert Bosch GmbH
- Teledyne FLIR LLC
- General Electric Company
- Cisco Systems Inc.
- SAP SE
- PTC Inc.
- Dassault Systemes SE
- Intel Corporation
- Hewlett Packard Enterprise Company
Additional Benefits:
- The market estimate (ME) sheet in Excel format
- 3 months of analyst support
TABLE OF CONTENTS
1 INTRODUCTION
- 1.1 Study Assumptions and Market Definition
- 1.2 Scope of the Study
2 RESEARCH METHODOLOGY
3 EXECUTIVE SUMMARY
4 MARKET LANDSCAPE
- 4.1 Market Overview
- 4.2 Market Drivers
- 4.2.1 Growing adoption of industrial IoT platforms
- 4.2.2 Demand for end-to-end energy optimisation
- 4.2.3 Rising government incentives for smart manufacturing
- 4.2.4 Edge AI chips enabling real-time quality control
- 4.2.5 Open-source digital twins lowering integration cost
- 4.2.6 Green-tax-driven retrofit of legacy factories
- 4.3 Market Restraints
- 4.3.1 High upfront CAPEX for brownfield transformation
- 4.3.2 Cybersecurity vulnerabilities within OT networks
- 4.3.3 Shortage of interoperable OT-IT talent
- 4.3.4 Volatile rare-earth supply for robotics actuators
- 4.4 Industry Value Chain Analysis
- 4.5 Impact of Macroeconomic Factors
- 4.6 Regulatory Landscape
- 4.7 Technological Outlook
- 4.8 Porter's Five Forces Analysis
- 4.8.1 Bargaining Power of Suppliers
- 4.8.2 Bargaining Power of Buyers
- 4.8.3 Threat of New Entrants
- 4.8.4 Threat of Substitute Products
- 4.8.5 Intensity of Competition
5 MARKET SIZE AND GROWTH FORECASTS (VALUE)
- 5.1 By Product Type
- 5.1.1 Machine Vision Systems
- 5.1.1.1 Cameras
- 5.1.1.2 Processors
- 5.1.1.3 Software
- 5.1.1.4 Enclosures
- 5.1.1.5 Frame Grabbers
- 5.1.1.6 Integration Services
- 5.1.1.7 Lighting
- 5.1.2 Industrial Robotics
- 5.1.2.1 Articulated Robots
- 5.1.2.2 Cartesian Robots
- 5.1.2.3 Cylindrical Robots
- 5.1.2.4 SCARA Robots
- 5.1.2.5 Parallel Robots
- 5.1.2.6 Collaborative Industry Robots
- 5.1.3 Control Devices
- 5.1.3.1 Relays and Switches
- 5.1.3.2 Servo Motors and Drives
- 5.1.4 Sensors
- 5.1.5 Communication Technologies
- 5.1.5.1 Wired
- 5.1.5.2 Wireless
- 5.1.6 Other Product Types
- 5.1.1 Machine Vision Systems
- 5.2 By Technology
- 5.2.1 Product Lifecycle Management (PLM)
- 5.2.2 Human Machine Interface (HMI)
- 5.2.3 Enterprise Resource Planning (ERP)
- 5.2.4 Manufacturing Execution System (MES)
- 5.2.5 Distributed Control System (DCS)
- 5.2.6 Supervisory Control and Data Acquisition (SCADA)
- 5.2.7 Programmable Logic Controller (PLC)
- 5.2.8 Other Technologies
- 5.3 By End-user Industry
- 5.3.1 Automotive
- 5.3.2 Semiconductors
- 5.3.3 Oil and Gas
- 5.3.4 Chemical and Petrochemical
- 5.3.5 Pharmaceutical
- 5.3.6 Aerospace and Defense
- 5.3.7 Food and Beverage
- 5.3.8 Mining
- 5.3.9 Other End-user Industries
- 5.4 By Geography
- 5.4.1 North America
- 5.4.1.1 United States
- 5.4.1.2 Canada
- 5.4.1.3 Mexico
- 5.4.2 South America
- 5.4.2.1 Brazil
- 5.4.2.2 Argentina
- 5.4.2.3 Rest of South America
- 5.4.3 Europe
- 5.4.3.1 Germany
- 5.4.3.2 United Kingdom
- 5.4.3.3 France
- 5.4.3.4 Italy
- 5.4.3.5 Rest of Europe
- 5.4.4 Asia Pacific
- 5.4.4.1 China
- 5.4.4.2 Japan
- 5.4.4.3 India
- 5.4.4.4 South Korea
- 5.4.4.5 Australia and New Zealand
- 5.4.4.6 Rest of Asia Pacific
- 5.4.5 Middle East
- 5.4.5.1 Saudi Arabia
- 5.4.5.2 United Arab Emirates
- 5.4.5.3 Turkey
- 5.4.5.4 Rest of Middle East
- 5.4.6 Africa
- 5.4.6.1 South Africa
- 5.4.6.2 Nigeria
- 5.4.6.3 Kenya
- 5.4.6.4 Rest of Africa
- 5.4.1 North America
6 COMPETITIVE LANDSCAPE
- 6.1 Market Concentration
- 6.2 Strategic Moves
- 6.3 Market Share Analysis
- 6.4 Company Profiles (includes Global level Overview, Market level overview, Core Segments, Financials as available, Strategic Information, Market Rank/Share for key companies, Products and Services, and Recent Developments)
- 6.4.1 Siemens AG
- 6.4.2 ABB Ltd
- 6.4.3 Schneider Electric SE
- 6.4.4 Rockwell Automation Inc.
- 6.4.5 Honeywell International Inc.
- 6.4.6 Mitsubishi Electric Corporation
- 6.4.7 Fanuc Corporation
- 6.4.8 Emerson Electric Co.
- 6.4.9 Yokogawa Electric Corporation
- 6.4.10 KUKA AG
- 6.4.11 Cognex Corporation
- 6.4.12 Robert Bosch GmbH
- 6.4.13 Teledyne FLIR LLC
- 6.4.14 General Electric Company
- 6.4.15 Cisco Systems Inc.
- 6.4.16 SAP SE
- 6.4.17 PTC Inc.
- 6.4.18 Dassault Systemes SE
- 6.4.19 Intel Corporation
- 6.4.20 Hewlett Packard Enterprise Company
7 MARKET OPPORTUNITIES AND FUTURE OUTLOOK
- 7.1 White-space and Unmet-need Assessment
 智慧工廠市場:按組件、技術、連接方式、企業規模、部署類型、應用領域和最終用途分類-2026-2032年全球市場預測
 智慧工廠市場規模、佔有率和成長分析:按組件、技術、應用、部署模式、最終用戶產業、企業規模和地區分類-2026-2033年產業預測
 2026年全球智慧工廠服務市場報告
 智慧工廠市場規模、佔有率、趨勢和預測:按現場設備、技術、最終用戶產業和地區分類,2026-2034 年
 智慧工廠市場:按組件、按解決方案、按製造業、按地區分類2026年全球智慧工廠市場報告
 智慧工廠市場分析及預測(至2035年):按類型、產品類型、服務、技術、組件、應用、流程、部署類型、最終用戶和解決方案分類
 全球智慧工廠市場:市場規模、佔有率、成長率、產業分析、依類型、應用和地區劃分的分析以及未來預測(2026-2034)
 智慧工廠市場-全球產業規模、佔有率、趨勢、機會及預測(依產品、技術、終端用戶產業、地區及競爭格局分類,2021-2031年)日本智慧工廠市場報告(按現場設備、技術、最終用戶產業和地區分類,2026-2034年)