


 |
市場調查報告書
商品編碼
1937309
矽砂:市佔率分析、產業趨勢與統計、成長預測(2026-2031)Silica Sand - Market Share Analysis, Industry Trends & Statistics, Growth Forecasts (2026 - 2031) |
||||||
※ 本網頁內容可能與最新版本有所差異。詳細情況請與我們聯繫。
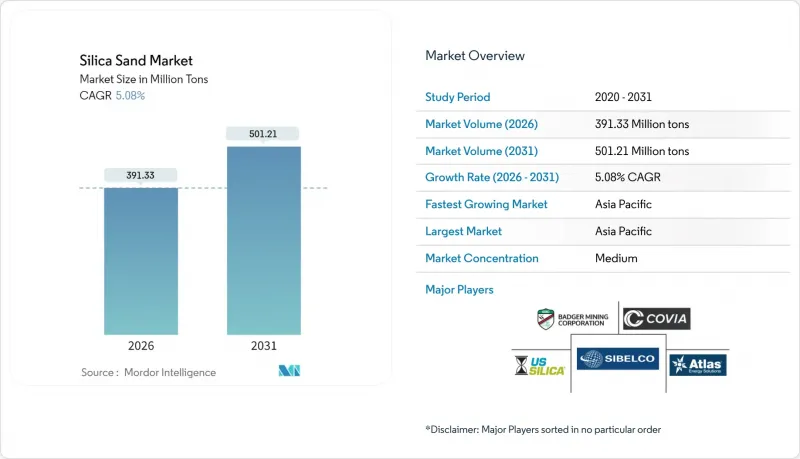
預計矽砂市場將從 2025 年的 3.7242 億噸成長到 2026 年的 3.9133 億噸,到 2031 年將達到 5.121 億噸,2026 年至 2031 年的複合年成長率為 5.08%。
這一上漲趨勢主要源自於該礦物在高純度玻璃、半導體晶片、水力壓裂支撐劑以及各種工業填充材中的核心作用。超白太陽能玻璃的溢價、頁岩油井數量的持續成長以及半導體製造廠向新地區的擴張,都在支撐著市場需求,即便是在環境法規日益嚴格的背景下也是如此。供應鏈正逐步走向區域化,盆地內礦山與下游企業的合作抵消了物流成本,並最大限度地減少了核准延誤的影響。競爭差異化越來越依賴品質認證、粉塵減排技術和可追溯性系統,這些都有助於買家管理健康和安全合規性。
全球矽砂市場趨勢及展望
對高透明度平板玻璃和太陽能玻璃的需求不斷成長
太陽能玻璃工廠需要二氧化矽含量達到99.99%或以上的原料,而隨著中國太陽能電站的擴張導致傳統浮法玻璃生產線的供應趨緊,現貨價格已接近每噸55美元。加拿大優質砂業等新參與企業正計劃建造垂直整合的熔爐,以滿足到2027年超過100吉瓦的面板生產需求。跨國浮法玻璃製造商正透過投資約1.8億美元維修熔爐,以提高能源效率並確保高純度砂的長期供應契約,來印證二氧化矽砂市場的發展趨勢。這些資本投資表明,隨著製造商尋求符合ISO 9001認證的低碳玻璃生產技術,高品質二氧化矽砂仍將是重要的原料供應來源。
頁岩井壓裂砂用量快速增加
由於井長和段數的增加,水平井的砂耗量較2013年平均增加了1060%。濕砂物流使柴油消耗量減少了90%,每口井節省了10萬至30萬美元的成本。這加速了盆地內棕砂的普及,降低了交付成本的波動性。美國職業安全與健康管理局(OSHA)關於可吸入性二氧化矽的規定推動了新型除塵罩和封閉式輸送機的應用,在矽砂市場形成了基於標準的採購趨勢。這使得獲得認證的供應商更具優勢。
環境許可審核難度日益增加
美國礦山安全與健康管理局 (MSHA) 的二氧化矽法規於 2024 年 6 月生效,將允許暴露濃度降低至 50 μg/m³,並增加了強制性健康篩檢,這增加了新礦場和現有礦場的合規成本。在曼尼托巴省,由於監管機構要求進行更詳細的水文地質研究,Sio Silica 的礦場計畫仍然停滯不前。歐洲化學品管理局 (ECHA) 的立法草案建議加強職場暴露標準,這可能會導致缺乏閉式處理迴路的小規模採石場減產。預計這一高門檻將抑制新計畫,並導致生產集中在擁有完善的 ESG 報告框架的營運商手中。
細分市場分析
在二氧化矽(SiO2)含量達99.5%或以上的高純度石英砂市場中,年複合成長率(CAGR)最高,達6.19%。超高純度石英砂是半導體坩堝、太陽能浮法玻璃和鋰離子電池隔膜等產品的基礎材料。 Sibelco公司在Spruce Pine的擴建計畫以及澳洲石英砂集團(Australian Silica Quartz Group)為實現99.997%純度所做的努力,都清楚地表明了高附加價值生產能力的提升。
標準級矽砂(二氧化矽含量95-99.5%)仍將是主要來源,預計到2025年將佔矽砂市場佔有率的47.58%。其需求主要來自鑄造模具、建築骨材和過濾介質。將廢棄物提純至99.99%純度的創新技術,例如鐵礦石精煉,既能帶來永續性,又能促進收入成長;而低純度矽砂(低於95%)的應用將主要局限於區域性預拌混凝土和回填土。
本矽砂報告依純度等級(高純度:99.5% SiO2 或以上;標準:低純度 95-99.5%)、終端用戶產業(玻璃製造、鑄造、化學製造、建築、油漆和塗料、陶瓷和耐火材料、過濾、石油和天然氣以及其他用戶產業)和地區(亞太地區進行細分、中國和歐洲)。
區域分析
亞太地區將佔全球矽產量的40.21%,預計將以6.27%的複合年成長率成長,這主要得益於中國太陽能產業的蓬勃發展、印度城市交通走廊的建設以及印尼價值457.4億美元的矽下游產業計畫。昆士蘭的矽產量預計到2030年將成長兩倍,這主要得益於澳洲弗拉特里角礦(二氧化矽含量99.93%)的開採。
北美地區的消費主要受頁岩支撐劑的驅動。預計2024年至2025年,美國將出口價值8.09億美元的矽砂,其中加拿大和日本是主要買家。墨西哥製造業的蓬勃發展推動了進口,這得益於美墨加協定(USMCA)的貿易關係以及其與美國供應商的地理接近性。該地區正面臨日益嚴格的法規環境,新的礦山安全與健康管理局(MSHA)矽砂法規將於2024年6月生效,該法規強制要求實施全面的暴露監測和醫療監護計畫。
由於建築需求放緩,歐洲矽砂產業面臨挑戰,但專業細分市場仍維持成長動能。歐洲化學品管理局提出的暴露限值預計將使供應集中在北歐地區,因為該地區的密封工藝已是標準流程。中東和非洲將推動計劃和玻璃容器的需求,而南美洲則因汽車供應鏈的調整和新的關鍵礦產政策而更具吸引力。
其他福利:
- Excel格式的市場預測(ME)表
- 3個月的分析師支持
目錄
第1章 引言
- 研究假設和市場定義
- 調查範圍
第2章調查方法
第3章執行摘要
第4章 市場情勢
- 市場概覽
- 市場促進因素
- 對高清晰度平板玻璃和太陽能玻璃的需求不斷成長
- 頁岩井壓裂砂用量快速增加
- 用於半導體製造的高純度二氧化矽的生長
- 基礎設施獎勵策略導致混凝土消耗增加
- 利用人工智慧最佳化鑄造工藝
- 市場限制
- 取得環境許可證的難度正在急劇增加。
- 快速替換容器玻璃中的回收玻璃屑。
- 新型低石英支撐劑(陶瓷、樹脂塗層)
- 價值鏈分析
- 波特五力模型
- 供應商的議價能力
- 買方的議價能力
- 新進入者的威脅
- 替代品的威脅
- 競爭程度
第5章 市場規模及成長預測(價值及數量)
- 按純度水平
- 高純度(SiO2含量99.5%或以上)
- 標準(95-99.5%)
- 低純度(低於95%)
- 按最終用戶行業分類
- 玻璃製造
- 鑄件
- 化學製造
- 建造
- 油漆和塗料
- 陶瓷和耐火材料
- 過濾
- 石油和天然氣
- 其他終端用戶產業
- 按地區
- 亞太地區
- 中國
- 印度
- 日本
- 韓國
- 印尼
- 澳洲
- 亞太其他地區
- 北美洲
- 美國
- 加拿大
- 墨西哥
- 歐洲
- 德國
- 英國
- 義大利
- 法國
- 俄羅斯
- 其他歐洲
- 南美洲
- 巴西
- 阿根廷
- 南美洲其他地區
- 中東和非洲
- 沙烏地阿拉伯
- 阿拉伯聯合大公國
- 南非
- 其他中東和非洲地區
- 亞太地區
第6章 競爭情勢
- 市場集中度
- 策略趨勢
- 市佔率(%)/排名分析
- 公司簡介
- Atlas Energy Solutions Inc.(Hi-Crush Inc.)
- Badger Mining Corporation
- Chongqing Changjiang River Moulding Material Group Co. Ltd
- COVIA HOLDINGS LLC
- Euroquarz GmbH
- Gulf Coast Sand
- JFE Mineral & Alloy Company Ltd
- Mitsubishi Corporation
- PUM GROUP
- Sibelco
- Sil Industrial Minerals
- Source Energy Services
- Superior Silica Sands
- TOCHU CORPORATION
- US Silica(Apollo Global Management)
第7章 市場機會與未來展望
The Silica Sand market is expected to grow from 372.42 Million tons in 2025 to 391.33 Million tons in 2026 and is forecast to reach 501.21 Million tons by 2031 at 5.08% CAGR over 2026-2031.
The upward trajectory is tied to the central role the mineral plays in high-purity glass, semiconductor wafers, hydraulic fracturing proppants, and a wide array of industrial fillers. Price premiums for ultra-clear solar glass, persistent growth in shale well counts, and the spread of semiconductor fabs into new regions are together sustaining demand even as environmental regulations tighten. Supply chains are gradually localizing, with in-basin mines and downstream alliances offsetting logistics costs and minimizing exposure to permitting delays. Competitive differentiation is increasingly anchored in quality certification, dust-mitigation technology, and traceability systems that help buyers manage health-and-safety compliance.
Global Silica Sand Market Trends and Insights
Rising Demand for Premium-Clarity Flat and Solar Glass
Solar-grade glass plants require feedstock exceeding 99.99% SiO2, pushing spot prices toward USD 55 per ton as China's photovoltaic capacity additions tighten availability for conventional float glass lines. Canadian Premium Sand and other entrants plan vertically integrated furnaces to satisfy more than 100 GW of panel output by 2027. Multinational float-glass makers have earmarked close to USD 180 million for furnace retrofits that boost energy efficiency while locking in long-term offtake contracts for high-purity sand, underscoring trends in the silica sand market. These capital commitments confirm that premium silica will remain a supply-critical input while manufacturers pursue low-carbon glass production techniques certified under ISO 9001 standards.
Surging Frac-Sand Intensity per Shale Well
Individual horizontal wells now average 1,060% more sand than in 2013, driven by longer laterals and higher stage counts. Wet-sand logistics cut diesel usage by 90% and shave USD 100,000-300,000 per well, accelerating the switch to in-basin brown sand that reduces delivered-cost volatility. OSHA respirable-silica rules are spurring adoption of new dust-capture hoods and enclosed conveyors trends in the silica sand market locking in specification-driven procurement that favors certified suppliers.
Escalating Environmental Permitting Hurdles
The MSHA silica rule that took effect in June 2024 lowered permissible exposure to 50 µg/m3 and added mandatory medical surveillance, raising compliance costs for both new and legacy pits. In Manitoba, Sio Silica's proposed mine remains stalled after regulators called for a deeper hydro-geological review. European Chemicals Agency drafts signal tighter workplace exposure requirements that could cut output at smaller quarries lacking enclosed processing circuits. The higher hurdle rate is expected to curtail grassroots projects and concentrate production among operators with full ESG reporting frameworks.
Other drivers and restraints analyzed in the detailed report include:
- Growth in High-Purity Silica for Semiconductor Fabs
- Infrastructure Stimulus-Led Concrete Consumption
- Rapid Substitution by Recycled Cullet in Container Glass
For complete list of drivers and restraints, kindly check the Table Of Contents.
Segment Analysis
High-purity grades above 99.5% SiO2 account for 6.19% CAGR, the fastest within the silica sand market. Ultra-pure sand provides the substrate for semiconductor crucibles, solar float glass, and lithium-ion battery separators. Sibelc o's Spruce Pine expansion and Australian Silica Quartz Group's push to 99.997% purity illustrate the scale-up of value-added capacity.
Standard-grade material ranging from 95-99.5% SiO2 remains the volume anchor, holding 47.58% of the 2025 silica sand market share. Demand stems from foundry molds, construction aggregates, and filter media. Innovations such as iron-ore tailings purification that lifts rejects to 99.99% purity blend sustainability with revenue upside, though low-purity sand below 95% SiO2 is largely restricted to local ready-mix and backfill usage.
The Silica Sand Report is Segmented by Purity Level (High-Purity More Than 99. 5% SiO2, Standard 95-99. 5%, Low-Purity Less Than 95%), End-User Industry (Glass Manufacturing, Foundry, Chemical Production, Construction, Paints and Coatings, Ceramics and Refractories, Filtration, Oil and Gas, and Other End-User Industries), and Geography (Asia-Pacific, North America, Europe, South America, and Middle-East and Africa).
Geography Analysis
Asia-Pacific commands 40.21% of global volume and is projected to grow at a 6.27% CAGR, driven by China's photovoltaic boom, India's urban transport corridors, and Indonesia's USD 45.74 billion silicon-downstream agenda. Australia's Cape Flattery mine, grading 99.93% SiO2, positions Queensland to triple output before 2030.
North America's consumption is propelled by shale proppant at the core. The United States exported USD 809 million worth of silica sand during 2024-2025, with Canada and Japan the top buyers. Mexico's growing manufacturing sector drives imports, benefiting from USMCA trade relationships and proximity to U.S. suppliers. The region's regulatory environment intensifies with new MSHA silica rules effective June 2024, requiring comprehensive exposure monitoring and medical surveillance programs.
Europe faces challenging conditions in silica sand industry with construction demand slowdowns affecting traditional silica sand applications, though specialized segments maintain growth momentum. The European Chemicals Agency's draft exposure limits may concentrate supply in Northern Europe where enclosed processing is already standard. Middle East and Africa draw on infrastructure projects and glass container demand, while South America's allure lies in automotive supply-chain shifts and new critical-minerals policies.
- Atlas Energy Solutions Inc. (Hi-Crush Inc.)
- Badger Mining Corporation
- Chongqing Changjiang River Moulding Material Group Co. Ltd
- COVIA HOLDINGS LLC
- Euroquarz GmbH
- Gulf Coast Sand
- JFE Mineral & Alloy Company Ltd
- Mitsubishi Corporation
- PUM GROUP
- Sibelco
- Sil Industrial Minerals
- Source Energy Services
- Superior Silica Sands
- TOCHU CORPORATION
- U.S. Silica (Apollo Global Management)
Additional Benefits:
- The market estimate (ME) sheet in Excel format
- 3 months of analyst support
TABLE OF CONTENTS
1 Introduction
- 1.1 Study Assumptions and Market Definition
- 1.2 Scope of the Study
2 Research Methodology
3 Executive Summary
4 Market Landscape
- 4.1 Market Overview
- 4.2 Market Drivers
- 4.2.1 Rising demand for premium-clarity flat and solar glass
- 4.2.2 Surging frac-sand intensity per shale well
- 4.2.3 Growth in high-purity silica for semiconductor fabs
- 4.2.4 Infrastructure stimulus-led concrete consumption
- 4.2.5 AI-driven foundry process optimisation
- 4.3 Market Restraints
- 4.3.1 Escalating environmental permitting hurdles
- 4.3.2 Rapid substitution by recycled cullet in container glass
- 4.3.3 Emerging low-quartz proppants (ceramics, resin-coated)
- 4.4 Value Chain Analysis
- 4.5 Porter's Five Forces
- 4.5.1 Bargaining Power of Suppliers
- 4.5.2 Bargaining Power of Buyers
- 4.5.3 Threat of New Entrants
- 4.5.4 Threat of Substitutes
- 4.5.5 Degree of Competition
5 Market Size and Growth Forecasts (Value and Volume)
- 5.1 By Purity Level
- 5.1.1 High-Purity (more than 99.5% SiO2)
- 5.1.2 Standard (95 to 99.5%)
- 5.1.3 Low-Purity (less than 95%)
- 5.2 By End-user Industry
- 5.2.1 Glass Manufacturing
- 5.2.2 Foundry
- 5.2.3 Chemical Production
- 5.2.4 Construction
- 5.2.5 Paints and Coatings
- 5.2.6 Ceramics and Refractories
- 5.2.7 Filtration
- 5.2.8 Oil and Gas
- 5.2.9 Other End-user Industries
- 5.3 By Geography
- 5.3.1 Asia-Pacific
- 5.3.1.1 China
- 5.3.1.2 India
- 5.3.1.3 Japan
- 5.3.1.4 South Korea
- 5.3.1.5 Indonesia
- 5.3.1.6 Australia
- 5.3.1.7 Rest of Asia-Pacific
- 5.3.2 North America
- 5.3.2.1 United States
- 5.3.2.2 Canada
- 5.3.2.3 Mexico
- 5.3.3 Europe
- 5.3.3.1 Germany
- 5.3.3.2 United Kingdom
- 5.3.3.3 Italy
- 5.3.3.4 France
- 5.3.3.5 Russia
- 5.3.3.6 Rest of Europe
- 5.3.4 South America
- 5.3.4.1 Brazil
- 5.3.4.2 Argentina
- 5.3.4.3 Rest of South America
- 5.3.5 Middle-East and Africa
- 5.3.5.1 Saudi Arabia
- 5.3.5.2 United Arab Emirates
- 5.3.5.3 South Africa
- 5.3.5.4 Rest of Middle-East and Africa
- 5.3.1 Asia-Pacific
6 Competitive Landscape
- 6.1 Market Concentration
- 6.2 Strategic Moves
- 6.3 Market Share (%)/Ranking Analysis
- 6.4 Company Profiles (includes Global level Overview, Market level overview, Core Segments, Financials as available, Strategic Information, Market Rank/Share for key companies, Products and Services, and Recent Developments)
- 6.4.1 Atlas Energy Solutions Inc. (Hi-Crush Inc.)
- 6.4.2 Badger Mining Corporation
- 6.4.3 Chongqing Changjiang River Moulding Material Group Co. Ltd
- 6.4.4 COVIA HOLDINGS LLC
- 6.4.5 Euroquarz GmbH
- 6.4.6 Gulf Coast Sand
- 6.4.7 JFE Mineral & Alloy Company Ltd
- 6.4.8 Mitsubishi Corporation
- 6.4.9 PUM GROUP
- 6.4.10 Sibelco
- 6.4.11 Sil Industrial Minerals
- 6.4.12 Source Energy Services
- 6.4.13 Superior Silica Sands
- 6.4.14 TOCHU CORPORATION
- 6.4.15 U.S. Silica (Apollo Global Management)
7 Market Opportunities and Future Outlook
- 7.1 White-space and Unmet-Need Assessment
 亞太地區矽砂:市佔率分析、產業趨勢與統計、成長預測(2026-2031年)
 2026-2034年依最終用途及地區分類的矽砂市場日本矽砂市場規模、佔有率、趨勢和預測:按最終用途和地區分類,2026-2034年
 2026年全球矽砂市場報告
 全球矽砂市場按類型、純度、粒徑、應用、銷售管道和終端用戶產業分類,2026-2032年預測
 矽砂市場規模、佔有率和成長分析(按類型、粒度、純度、等級、應用和地區分類)—產業預測(2026-2033 年)
 工業矽砂:全球市佔率及排名、總收入及需求預測(2025-2031年)
 矽砂市場-全球產業規模、佔有率、趨勢、機會及預測(按等級、應用、區域及競爭細分,2020-2030 年)
 全球矽砂市場:預測(2025-2030)北美矽砂:市場佔有率分析、產業趨勢與成長預測(2025-2030 年)