


 |
市場調查報告書
商品編碼
1934582
中國可再生能源:市場佔有率分析、產業趨勢與統計、成長預測(2026-2031年)China Renewable Energy - Market Share Analysis, Industry Trends & Statistics, Growth Forecasts (2026 - 2031) |
||||||
※ 本網頁內容可能與最新版本有所差異。詳細情況請與我們聯繫。
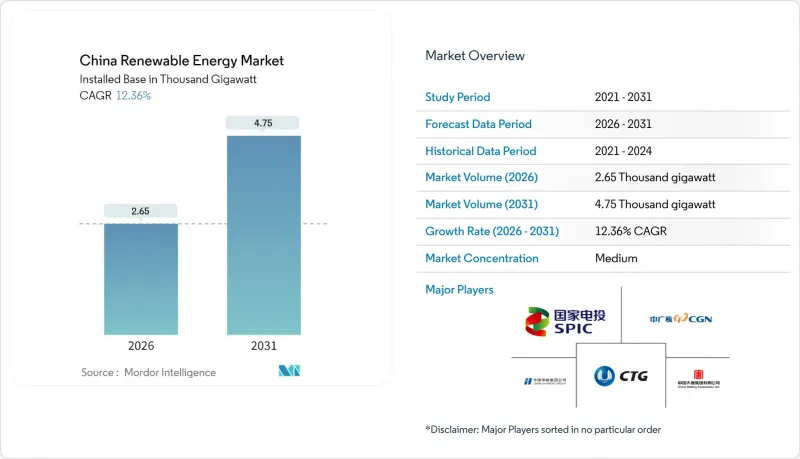
預計到 2026 年,中國可再生能源市場規模將達到 2650 吉瓦,高於 2025 年的 2360 吉瓦,預計到 2031 年將達到 4750 吉瓦。
預計2026年至2031年年複合成長率(CAGR)為12.36%。
北京正加速推動清潔能源部署,力爭2060年實現碳中和。 2025年《能源法》中的政策改革、太陽能和風能平準化能源成本(LCOE)的快速下降以及企業購電協議(PPA)的擴大,正在推動裝置容量的持續成長。與此同時,國有電力公司正在升級其特高壓輸電網,以吸收不斷成長的可再生能源發電量。強大的製造業生態系統抑制了設備價格上漲,省級可再生能源配額懲罰措施進一步刺激了工商業用戶的需求。此外,890億美元的輸電網投資和新的市場定價機制正在重塑電力收入模式,迫使電力生產商最佳化成本,提升競爭力。
中國可再生能源市場的發展趨勢與展望
政府2060年碳中和義務和政策獎勵
中央政府的脫碳承諾體現在具有法律約束力的裝置容量配額中,地方領導人必須完成這些配額才能獲得財政轉移支付。 「十四五」規劃要求在2030年達到1,200吉瓦的風能和太陽能總裝置容量,是2024年基準的兩倍。未能完成配額的省份將失去預算支持,因此公共產業正在加快可再生能源採購,以保障其財務狀況。同時,綠色證書市場允許發電企業在出售電力的同時出售環境屬性,使計劃收益增加高達200個基點。強制性的ISO 14064報告製度進一步鼓勵了廣東省和上海市碳排放交易試點計畫中的工業排放採購可再生能源。這些累積效應確保了中國可再生能源市場的長期透明度。
太陽能和陸域風電的平準化度電成本大幅下降
目前,在日照量高的省份,大規模太陽能發電的成本低於每千瓦時0.02美元,比新建燃煤電廠便宜30%至40%。多晶矽供應過剩,導致現貨價格在2024年達到每公斤40元人民幣,使得組件製造商能夠以低於每瓦0.10美元的價格提供組件。 6-8兆瓦風力發電機的引入降低了電廠的整體成本,使風電成本降至每千瓦時0.03美元。一些省份的競標為每千瓦時0.28元人民幣,限制了火電廠的尖峰時段需求,並將輸電容量留給了可再生能源。這種價格優勢鞏固了中國可再生能源市場的長期成長。
電網限電及輸電瓶頸
儘管計劃於2027年後完工的特高壓輸電線路正在建設中,但西部一些省份的峰值棄電率仍超過10%。西北電網在2024年輸送了1,000億千瓦時的清潔電力,但這僅佔可再生能源發電的60%,凸顯了產能利用不足的問題。雖然在2024年底新增儲能容量超過70吉瓦,但這仍然不足以滿足可變可再生能源快速發展所需的柔軟性。由於計劃間對有限輸電容量的競爭,市場機制的調整可能會加劇短期棄電,從而在某些地區限制中國可再生能源市場的擴張。
細分市場分析
到2025年,太陽能發電將佔總裝置容量的46.20%,構成中國目前可再生能源市場規模的基礎。這得益於過去十年成本的持續下降,使得組件成本降至每瓦0.10美元以下。由於每千瓦時0.28元人民幣的競標擠壓了利潤空間,製造商正積極尋求出口需求和垂直整合以維持收入。風電將佔裝置容量的約35%,其中2024年上半年新增離岸風電裝置容量3.39吉瓦,展現了深海域渦輪機設計在拓展資源開發領域的效能。水力發電(包括抽水蓄能)提供了重要的柔軟性,到2025年,計畫新增50吉瓦抽水發電工程。
海洋能源起步規模雖小規模,但預計到2031年將以77.17%的複合年成長率成長,成為中國可再生能源市場中成長最快的領域。浙江和福建兩省1兆瓦至5兆瓦的潮汐能渦輪機試驗已實現超過40%的容量係數,中央政府正投入20億元人民幣的補貼,目標是到2028年將成本降至每千瓦時0.08美元。設備製造商正在調整離岸風電供應鏈以適應潮汐能,加速其商業化進程,並推動中國可再生能源市場擺脫對陸上資產的依賴,實現多元化發展。
中國可再生能源市場報告按技術(太陽能、風能、水力發電、生質能源、地熱能和海洋能)和終端用戶(電力公司、工商業和住宅)進行細分。市場規模和預測以裝置容量(GW)為單位。
其他福利:
- Excel格式的市場預測(ME)表
- 3個月的分析師支持
目錄
第1章 引言
- 研究假設和市場定義
- 調查範圍
第2章調查方法
第3章執行摘要
第4章 市場情勢
- 市場概覽
- 市場促進因素
- 政府強制要求在2060年前實現碳中和,並制定了相關政策獎勵。
- 太陽能光電發電和陸域風電的平準化電成本大幅下降
- 市電平價政策與綠色電力交易自由化
- 省級可再生能源配額懲罰措施鼓勵企業簽訂購電協議
- 混合可再生能源和儲能計劃核准數量激增
- 強制要求新建公共建築安裝屋頂太陽能板。
- 市場限制
- 電網約束和輸電瓶頸
- 原料供應鏈(多晶矽、稀土)的波動性
- 土地使用糾紛導致計劃核准更加嚴格
- 逐步取消上網電價補助和競標競標
- 供應鏈分析
- 監管環境
- 技術展望
- 波特五力模型
- 新進入者的威脅
- 供應商的議價能力
- 買方的議價能力
- 替代品的威脅
- 產業間競爭
- PESTEL 分析
第5章 市場規模與成長預測
- 透過技術
- 太陽能(光伏和聚光太陽能)
- 風力發電(陸上和海上)
- 水力發電(小規模、大型、抽水蓄能)
- 生質能源
- 地熱
- 海洋能源(潮汐能和波浪能)
- 最終用戶
- 電力公司
- 商業和工業
- 住宅
第6章 競爭情勢
- 市場集中度
- 策略性舉措(併購、聯盟、購電協議)
- 市場佔有率分析(主要企業的市場排名和佔有率)
- 公司簡介
- China Three Gorges Corporation
- State Power Investment Corporation(SPIC)
- China Huaneng Group
- China Huadian Corporation
- China Datang Corporation Renewable Power
- China General Nuclear(CGN)New Energy
- Sinohydro Corporation
- China Yangtze Power Co. Ltd
- Xinjiang Goldwind Science & Technology Co. Ltd
- Dongfang Electric Corporation Ltd
- Ming Yang Smart Energy
- Envision Energy
- Sinovel Wind Group Co. Ltd
- JinkoSolar Holdings Co. Ltd
- Trina Solar Co. Ltd
- LONGi Green Energy Technology Co. Ltd
- JA Solar Technology Co. Ltd
- Canadian Solar Inc.(China ops)
- Sungrow Power Supply Co. Ltd
- TBEA Co. Ltd
第7章 市場機會與未來展望
China Renewable Energy Market size in 2026 is estimated at 2.65 Thousand gigawatt, growing from 2025 value of 2.36 Thousand gigawatt with 2031 projections showing 4.75 Thousand gigawatt, growing at 12.36% CAGR over 2026-2031.
Beijing accelerates clean energy deployment in pursuit of its 2060 carbon neutrality pledge. Policy reforms embedded in the 2025 Energy Law, rapid declines in the levelized cost of solar and wind, and the expansion of corporate power-purchase agreements (PPAs) combine to fuel sustained capacity additions, while state utilities upgrade their ultra-high-voltage grids to absorb the rising renewable output. Robust manufacturing ecosystems keep equipment prices low, and provincial renewable-quota penalties further stimulate demand among commercial and industrial buyers. Simultaneously, transmission investments of USD 89 billion and new market-based pricing rules are reshaping revenue models, compelling generators to optimize costs and enhance their competitiveness.
China Renewable Energy Market Trends and Insights
Government 2060 Carbon-Neutrality Mandate & Policy Incentives
Central government decarbonization pledges translate into legally binding capacity quotas that provincial leaders must meet to secure fiscal transfers. The Fourteenth Five-Year Plan orders 1,200 GW of combined wind and solar by 2030, double the 2024 baseline. Provinces falling short lose budget support, so utilities accelerate renewable procurement to protect balance sheets. A parallel green-certificate market lets generators sell environmental attributes in addition to electricity, lifting project returns by up to 200 basis points. Mandatory ISO 14064 reporting further pushes industrial emitters toward renewable sourcing within carbon-trading pilots in Guangdong and Shanghai. The cumulative effect secures long-run visibility for the Chinese renewable energy market.
Rapid LCOE Decline for Solar PV & On-Shore Wind
Utility-scale solar power now delivers energy below USD 0.02 per kWh, 30%-40% cheaper than new coal in high-irradiance provinces. Polysilicon oversupply pushed spot prices to CNY 40 per kg in 2024, allowing module makers to offer sub-USD 0.10 per-watt panels. Wind energy costs have fallen to USD 0.03 per kWh as 6 MW to 8 MW turbines reduce balance-of-plant expenses. Several provincial auctions cleared at CNY 0.28 per kWh, forcing thermal units into peaking roles and freeing grid capacity for renewables. The price edge cements long-term growth in the Chinese renewable energy market.
Grid Curtailment & Transmission Bottlenecks
Curtailment in several western provinces exceeds 10% during peak output despite ongoing construction of ultra-high-voltage lines slated for completion after 2027. The Northwest grid exported 100 billion kWh of clean power in 2024, only 60% of its renewable generation, highlighting stranded capacity. Storage additions topped 70 GW by end-2024 but still trail the flexibility required for rapid variable-renewable growth. Market-based dispatch could intensify short-term curtailment as projects compete for limited transmission capacity, tempering expansion in certain parts of the Chinese renewable energy market.
Other drivers and restraints analyzed in the detailed report include:
- Boom in Hybrid Renewable-Storage Project Approvals
- Provincial Renewable-Quota Penalties Driving Captive Corporate PPAs
- Raw-Material Supply-Chain Volatility
For complete list of drivers and restraints, kindly check the Table Of Contents.
Segment Analysis
The solar segment stood at 46.20% of total capacity in 2025, anchoring the current Chinese renewable energy market size and underscoring the decade-long cost decline that produced sub-USD 0.10-per-watt modules. Auction results at CNY 0.28 per kWh compress margins, so manufacturers seek export demand and vertical integration to sustain returns. Wind contributed about 35% of installed capacity, with offshore additions of 3.39 GW in the first half of 2024, validating deep-water turbine designs that expand resource areas. Hydropower, including pumped storage, provides essential flexibility, and 50 GW of new pumped-storage projects are scheduled by 2025.
Ocean energy started from a negligible base but is projected to post an 77.17% CAGR to 2031, the highest within the Chinese renewable energy market. Zhejiang and Fujian pilots using 1 MW to 5 MW tidal turbines deliver capacity factors above 40%, and RMB 2 billion in central subsidies targets cost cuts toward USD 0.08 per kWh by 2028. Equipment makers adapt offshore-wind supply chains to tidal applications, accelerating commercialization and diversifying the Chinese renewable energy market away from land-based assets.
The China Renewable Energy Market Report is Segmented by Technology (Solar Energy, Wind Energy, Hydropower, Bioenergy, Geothermal, and Ocean Energy) and End-User (Utilities, Commercial and Industrial, and Residential). The Market Sizes and Forecasts are Provided in Terms of Installed Capacity (GW).
List of Companies Covered in this Report:
- China Three Gorges Corporation
- State Power Investment Corporation (SPIC)
- China Huaneng Group
- China Huadian Corporation
- China Datang Corporation Renewable Power
- China General Nuclear (CGN) New Energy
- Sinohydro Corporation
- China Yangtze Power Co. Ltd
- Xinjiang Goldwind Science & Technology Co. Ltd
- Dongfang Electric Corporation Ltd
- Ming Yang Smart Energy
- Envision Energy
- Sinovel Wind Group Co. Ltd
- JinkoSolar Holdings Co. Ltd
- Trina Solar Co. Ltd
- LONGi Green Energy Technology Co. Ltd
- JA Solar Technology Co. Ltd
- Canadian Solar Inc. (China ops)
- Sungrow Power Supply Co. Ltd
- TBEA Co. Ltd
Additional Benefits:
- The market estimate (ME) sheet in Excel format
- 3 months of analyst support
TABLE OF CONTENTS
1 Introduction
- 1.1 Study Assumptions & Market Definition
- 1.2 Scope of the Study
2 Research Methodology
3 Executive Summary
4 Market Landscape
- 4.1 Market Overview
- 4.2 Market Drivers
- 4.2.1 Government 2060 carbon-neutrality mandate & policy incentives
- 4.2.2 Rapid LCOE decline for solar PV & on-shore wind
- 4.2.3 Grid-parity policies & green-power trading liberalisation
- 4.2.4 Provincial renewable-quota penalties driving captive corporate PPAs
- 4.2.5 Boom in hybrid renewable-storage project approvals
- 4.2.6 Mandatory rooftop PV on new public buildings
- 4.3 Market Restraints
- 4.3.1 Grid curtailment & transmission bottlenecks
- 4.3.2 Raw-material supply-chain volatility (polysilicon, rare-earths)
- 4.3.3 Land-use conflicts causing stricter project permitting
- 4.3.4 Feed-in-tariff phase-out & low auction prices
- 4.4 Supply-Chain Analysis
- 4.5 Regulatory Landscape
- 4.6 Technological Outlook
- 4.7 Porter's Five Forces
- 4.7.1 Threat of New Entrants
- 4.7.2 Bargaining Power of Suppliers
- 4.7.3 Bargaining Power of Buyers
- 4.7.4 Threat of Substitutes
- 4.7.5 Industry Rivalry
- 4.8 PESTLE Analysis
5 Market Size & Growth Forecasts
- 5.1 By Technology
- 5.1.1 Solar Energy (PV and CSP)
- 5.1.2 Wind Energy (Onshore and Offshore)
- 5.1.3 Hydropower (Small, Large, PSH)
- 5.1.4 Bioenergy
- 5.1.5 Geothermal
- 5.1.6 Ocean Energy (Tidal and Wave)
- 5.2 By End-User
- 5.2.1 Utilities
- 5.2.2 Commercial and Industrial
- 5.2.3 Residential
6 Competitive Landscape
- 6.1 Market Concentration
- 6.2 Strategic Moves (M&A, Partnerships, PPAs)
- 6.3 Market Share Analysis (Market Rank/Share for key companies)
- 6.4 Company Profiles (includes Global level Overview, Market level overview, Core Segments, Financials as available, Strategic Information, Products & Services, and Recent Developments)
- 6.4.1 China Three Gorges Corporation
- 6.4.2 State Power Investment Corporation (SPIC)
- 6.4.3 China Huaneng Group
- 6.4.4 China Huadian Corporation
- 6.4.5 China Datang Corporation Renewable Power
- 6.4.6 China General Nuclear (CGN) New Energy
- 6.4.7 Sinohydro Corporation
- 6.4.8 China Yangtze Power Co. Ltd
- 6.4.9 Xinjiang Goldwind Science & Technology Co. Ltd
- 6.4.10 Dongfang Electric Corporation Ltd
- 6.4.11 Ming Yang Smart Energy
- 6.4.12 Envision Energy
- 6.4.13 Sinovel Wind Group Co. Ltd
- 6.4.14 JinkoSolar Holdings Co. Ltd
- 6.4.15 Trina Solar Co. Ltd
- 6.4.16 LONGi Green Energy Technology Co. Ltd
- 6.4.17 JA Solar Technology Co. Ltd
- 6.4.18 Canadian Solar Inc. (China ops)
- 6.4.19 Sungrow Power Supply Co. Ltd
- 6.4.20 TBEA Co. Ltd
7 Market Opportunities & Future Outlook
- 7.1 White-space & unmet-need assessment
 農業可再生能源:生質燃料、太陽能發電廠和永續農業實踐的全球市場—按應用、產品和地區分類的分析和預測(2025-2035 年)
 2026年全球可再生能源市場報告2026年全球多元能源系統市場報告2026年全球太陽能燃料市場報告
 可再生能源市場:全球產業分析、市場規模、市場佔有率及預測(依投資類型、可再生能源類型、企業類型、應用、國家及地區分類)-2026-2033年
 風電場變電站市場按組件類型、配置類型、連接類型、電壓等級、最終用戶和安裝類型分類,全球預測(2026-2032年)全球節能設備市場:機會與策略展望(至2034年)
 節能微控制器市場分析及預測(至2035年):依類型、產品類型、服務、技術、組件、應用、最終用戶、功能、安裝類型、解決方案分類
 新加坡可再生能源:市場佔有率分析、產業趨勢與統計、成長預測(2026-2031)美國可再生能源:市場佔有率分析、行業趨勢和統計數據以及成長預測(2026-2031 年)