


 |
市場調查報告書
商品編碼
1911477
商業軟體:市場佔有率分析、產業趨勢與統計、成長預測(2026-2031)Business Software - Market Share Analysis, Industry Trends & Statistics, Growth Forecasts (2026 - 2031) |
||||||
※ 本網頁內容可能與最新版本有所差異。詳細情況請與我們聯繫。
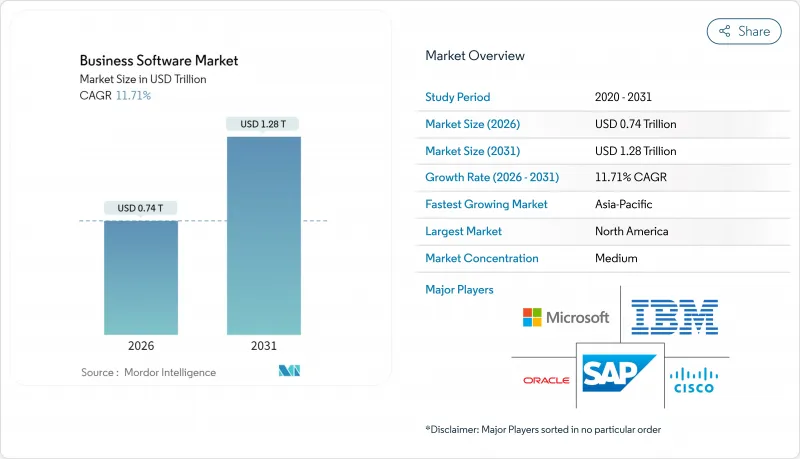
據估計,到 2026 年,商業軟體市場價值將達到 7,373 億美元,高於 2025 年的 6,600 億美元,預計到 2031 年將達到 1,2817 億美元,2026 年至 2031 年的年複合成長率(CAGR)為 11.71%。
這種快速擴張反映了企業向人工智慧驅動的工作流程自動化、雲端原生部署以及將分析直接嵌入業務流程的資料中心架構的轉變。企業對審核的ESG報告的需求、重建具有韌性的區域供應鏈的需要以及低程式碼開發平台的普及,都在推動新的支出成長。隨著現有平台供應商與提供更低整體擁有成本 (TCO) 的人工智慧新興企業和開放原始碼套件競爭,競爭壓力日益加劇。訂閱定價模式雖然帶來了經常性收入,但也增加了客戶獲取成本,迫使供應商改善基於價值的打包方案和雲端成本最佳化產品。區域成長軌跡正在分化:北美負責人專注於人工智慧整合,亞太地區企業正在推行雲端優先部署,而歐洲企業則在尋求符合主權要求的解決方案,以應對GDPR和新的資料在地化義務。
全球商業軟體市場趨勢與洞察
引進人工智慧驅動的工作流程自動化
智慧自動化工具的應用正遠遠超越基於規則的機器人,轉向能夠協調ERP、CRM和協作套件中各項任務的AI代理。微軟已將Copilot代理程式嵌入Office和Dynamics,並利用自然語言提示重塑端對端工作流程。 Citizens Bank在其軟體工程部門部署AI代碼產生助手後,生產力提高了20%。一項更廣泛的跨產業研究報告顯示,功能性生產力提升了30%至55%。隨著供應商整合來自其整合架構的上下文數據,自動化提升的不再只是任務速度,而是決策品質。領先採用者擁有顯著優勢,而後進企業仍在苦苦掙扎於缺乏自適應智慧的傳統腳本工具。
轉向訂閱/SaaS收入模式
到2025年,超過一半的美國企業將透過SaaS模式運行其關鍵業務軟體,從而創造超過1000億美元的全新B2B商機。這種轉變使供應商的收入與客戶價值更加緊密地聯繫在一起,也因此提升了客戶流失管理和基本契約的重要性。越南的一項研究發現,付費使用制能夠緩解現金流壓力,因此中小企業的採用率高於大型企業。供應商正在將人工智慧融入收費引擎,以創建個人化的分級方案並視覺化消費趨勢,而企業也在同步採用財務營運(FinOps)方法來減少不必要的授權。成本透明度的提高意味著供應商的差異化優勢取決於可衡量的投資報酬率(ROI),這就需要更精確的產品藍圖和完善的售後成功計畫。
最佳化雲端支出的壓力日益增大
經濟不確定性加劇了企業對雲端帳單的審查,促使他們採用人工智慧驅動的成本管治工具,以實現實例規模的自動調整和資源的自動分配。英特爾報告稱,全球客戶在實施持續最佳化框架後,成本節省了 34%。財務營運團隊正在將這些洞察融入採購流程,以遏制供應商許可證的擴張並延長續約談判時間。為了維持市場佔有率,軟體供應商除了要量化功能優勢外,還必須量化效率提升。
細分市場分析
至2025年,ERP解決方案將佔總營收的25.74%,凸顯其在商業軟體市場中作為業務線基石的地位。大型製造商、零售商和公共部門機構依靠整合的財務、採購和生產模組來維持流程規範。然而,隨著企業優先考慮數據驅動的決策週期,預計到2031年,分析平台的複合年成長率將達到12.05%。烘焙連鎖店St-Donat實施了一套食品專用雲ERP解決方案,該方案具備批次追蹤和行動訂單輸入功能,取代了其傳統的會計工具,預算為35萬美元。同時,自助式BI套件正在普及高級視覺化和預測建模功能,蠶食成熟ERP產品的成長動能。
這波分析科技浪潮與經營團隊對預測性預測、自動化資料敘事和嵌入式人工智慧建議的需求不謀而合。供應商們正將即時儀錶板嵌入ERP工作平台,而專業供應商則透過專注於臨床試驗績效和全通路行銷歸因等垂直關鍵績效指標(KPI)來更快地擴展業務規模。隨著合規要求的不斷提高,審核範圍也隨之擴大,財務、人力資源和計劃合模組的需求依然穩定,而ESG報告工具則在「其他」類別中湧現。 UL Solutions和Workiva各自推出了能夠捕捉整個供應鏈排放數據的碳核算引擎,反映了向永續發展的更廣泛轉變。
預計2025年,雲端採用將佔企業軟體市場規模的59.12%,複合年成長率(CAGR)為13.45%。 95%的企業已將至少一項關鍵業務工作負載遷移到公共雲端或混合雲端,以實現彈性擴展和更快的功能交付週期。微軟和Oracle已將多重雲端互連擴展到新的全球區域,使客戶無需重新架構即可將資料庫部署在更靠近分析引擎的位置。在亞太地區,5G的部署和政府支援的資料中心計畫正在進一步縮短遷移時間。
由於對主權和延遲的擔憂,本地部署在金融、國防和醫療保健行業仍然是強勁的趨勢。供應商現在提供容器化版本的技術棧,允許客戶在私有叢集和公共雲端之間遷移工作負載,同時保持許可和支援權限。主權雲端服務使歐洲銀行能夠在國內託管受監管的數據,從而在合規性和雲端經濟性之間取得平衡。對於物流和製造業的客戶而言,邊緣運算藍圖正在興起,它將工廠車間亞毫秒級的反應速度與集中式分析控制相結合。
商業軟體市場按軟體類型(ERP、CRM、商業智慧與分析等)、部署模式(雲端、本地部署)、最終用戶產業(銀行、金融服務和保險、醫療保健與生命科學、政府與公共部門等)、組織規模(大型企業、中小企業)和地區進行細分。市場預測以美元計價。
區域分析
北美地區擁有成熟的雲端基礎設施和嚴格的產業監管,預計到2025年將佔全球商業軟體市場收入的25.05%。微軟計劃在2025年投入167.5億美元資本支出,以滿足美國日益成長的人工智慧訓練能力需求。加拿大銀行正在採用符合主權標準的SaaS解決方案,墨西哥製造商則在推動工廠數位化,以最佳化近岸外包工作流程。該地區的關注點正從基礎的雲端遷移轉向人工智慧驅動的生產力提升,這可能會使支出超出傳統的授權續費成本。
亞太地區是成長最快的區域,預計到2031年將以12.52%的複合年成長率成長。在中國,企業軟體已融入政府主導的數位經濟計劃,本土供應商也積極適應國內的雲端政策。日本正致力於開發提高員工生產力的平台,以應對人口結構變化帶來的壓力;而印度快速成長的中小型企業則利用低程式碼套件來規範其營運。新加坡和香港正作為區域雲端集線器,為東南亞的電子商務企業提供延遲要求極高的服務。
其他福利:
- Excel格式的市場預測(ME)表
- 3個月的分析師支持
目錄
第1章 引言
- 研究假設和市場定義
- 調查範圍
第2章調查方法
第3章執行摘要
第4章 市場情勢
- 市場概覽
- 市場促進因素
- 基於人工智慧的工作流程自動化的採用現狀
- 轉向訂閱/SaaS收入模式
- 對統一資料架構的需求
- 利用低程式碼/無程式碼平台進行公民開發
- 加強環境、社會及公司治理(ESG)及永續發展報告的要求
- 近岸外包與彈性數位供應鏈
- 市場限制
- 最佳化雲端支出的壓力日益增大
- 開放原始碼替代方案的興起
- 數據主權和跨境合規的障礙
- 特定領域執行人員短缺
- 供應鏈分析
- 監管環境
- 技術展望
- 波特五力分析
- 供應商的議價能力
- 買方的議價能力
- 新進入者的威脅
- 替代品的威脅
- 競爭對手之間的競爭
- 評估市場中的宏觀經濟因素
第5章 市場規模與成長預測
- 依軟體類型
- ERP
- CRM
- 商業智慧與分析
- 供應鏈管理
- 人力資源管理
- 財會
- 計劃和組合管理
- 其他
- 透過部署
- 雲
- 本地部署
- 按最終用戶行業分類
- BFSI
- 醫療保健和生命科學
- 政府和公共部門
- 零售與電子商務
- 運輸/物流
- 製造業
- 通訊與媒體
- 其他
- 按組織規模
- 主要企業
- 小型企業
- 按地區
- 北美洲
- 美國
- 加拿大
- 墨西哥
- 南美洲
- 巴西
- 阿根廷
- 南美洲其他地區
- 歐洲
- 德國
- 英國
- 法國
- 義大利
- 西班牙
- 其他歐洲地區
- 亞太地區
- 中國
- 日本
- 印度
- 韓國
- 東南亞
- 亞太其他地區
- 中東和非洲
- 中東
- 沙烏地阿拉伯
- 阿拉伯聯合大公國
- 土耳其
- 其他中東地區
- 非洲
- 南非
- 奈及利亞
- 埃及
- 其他非洲地區
- 中東
- 北美洲
第6章 競爭情勢
- 市場集中度
- 策略趨勢
- 市佔率分析
- 公司簡介
- Microsoft Corporation
- International Business Machines Corporation
- Oracle Corporation
- SAP SE
- Cisco Systems Inc.
- Salesforce Inc.
- Adobe Inc.
- Intuit Inc.
- Sage Group plc
- Workday Inc.
- ServiceNow Inc.
- Epicor Software Corporation
- Infor
- Oracle NetSuite
- Accenture plc
- Deltek Inc.
- Zoho Corporation
- Atlassian Corporation
- Freshworks Inc.
- HubSpot Inc.
- Odoo SA
第7章 市場機會與未來展望
Business software market size in 2026 is estimated at USD 737.3 billion, growing from 2025 value of USD 660 billion with 2031 projections showing USD 1,281.7 billion, growing at 11.71% CAGR over 2026-2031.
This rapid expansion reflects enterprises' pivot toward AI-enabled workflow automation, cloud-native deployment, and data-centric architectures that embed analytics directly into operational processes. Corporate demands for auditable ESG reporting, the need to rebuild resilient regional supply chains, and the mainstreaming of low-code development platforms each fuel fresh spending streams. Competitive pressure intensifies as incumbent platform vendors contend with AI-native challengers and open-source suites that offer lower total cost of ownership. Subscription pricing models deepen recurring revenue yet elevate customer acquisition costs, prompting vendors to refine value-based packaging and cloud cost-optimization services. Regional growth trajectories diverge: North American buyers focus on AI integration, Asia-Pacific organizations pursue cloud-first adoption, and European firms seek sovereignty-compliant offerings to meet GDPR and emerging data-localization mandates.
Global Business Software Market Trends and Insights
AI-powered workflow automation adoption
Adoption of intelligent automation tools has moved far beyond rule-based bots as AI agents orchestrate tasks across ERP, CRM, and collaboration suites. Microsoft embedded Copilot agents across Office and Dynamics, enabling natural-language prompts that restructure end-to-end workflows.Citizens Bank realized 20% productivity gains in software engineering after deploying AI code-generation assistants, while broader cross-industry studies cite functional productivity lifts of 30-55%. Vendors integrate contextual data from unified fabrics, so automation now drives decision quality rather than pure task speed. Early adopters secure defensible advantages as laggards struggle with legacy scripting tools lacking adaptive intelligence.
Shift to subscription / SaaS revenue models
More than half of U.S. enterprises will run core software via SaaS by 2025, unlocking over USD 100 billion in fresh B2B opportunity. The move aligns vendor income with customer value, yet raises stakes for churn management and usage-based contracting. Vietnamese research shows SME adoption outpacing large enterprises because pay-as-you-go pricing eases cash-flow constraints. Vendors embed AI in billing engines to personalize tiers and surface consumption insights, but enterprises simultaneously adopt FinOps practices to trim redundant seats. As cost visibility grows, provider differentiation hinges on measurable ROI, forcing sharper product road-mapping and post-sale success programs.
Escalating cloud spend optimization pressure
Economic uncertainty accelerates scrutiny of cloud invoices, prompting enterprises to deploy AI-powered cost-governance tools that right-size instances and automate de-allocation. Intel documented 34% savings for a global client after implementing continuous optimization frameworks. FinOps teams integrate these insights into procurement cycles, dampening vendor-license expansion and stretching renewal negotiations. Software providers must now quantify efficiency gains alongside functional benefits to retain wallet share.
Other drivers and restraints analyzed in the detailed report include:
- Demand for unified data fabrics
- Low-code / no-code platforms in citizen development
- Growing open-source alternatives
For complete list of drivers and restraints, kindly check the Table Of Contents.
Segment Analysis
ERP solutions accounted for 25.74% of 2025 revenue, underscoring their role as the transactional backbone of the business software market. Large manufacturers, retailers, and public agencies rely on integrated finance, procurement, and production modules to maintain process discipline. Still, analytics platforms record a 12.05% CAGR through 2031 as companies prioritize data-driven decision cycles. Bakery chain St-Donat replaced legacy accounting tools with a food-specific cloud ERP that delivered lot traceability and mobile order capture on a USD 350,000 budget. In parallel, self-service BI suites democratize advanced visualization and predictive modeling, siphoning growth momentum from mature ERP lines.
The analytics wave coincides with executives' push for predictive forecasting, automated data storytelling, and embedded AI recommendations. Vendors embed real-time dashboards into ERP workbenches, yet specialist providers scale faster by focusing on vertical KPIs such as clinical-trial performance or omnichannel marketing attribution. Finance, HR, and project-portfolio modules keep steady demand as compliance mandates expand audit scope, while ESG reporting tools emerge inside the "other" category. UL Solutions and Workiva each bundle carbon-accounting engines that capture emissions data across supply networks, reflecting the broader sustainability pivot.
Cloud deployments captured 59.12% of the business software market size in 2025 and are set to climb at a 13.45% CAGR. Ninety-five percent of enterprises have shifted at least one mission-critical workload to public or hybrid clouds, pursuing elastic scalability and faster feature cadence. Microsoft and Oracle extended their multi-cloud interconnect to new global regions, enabling customers to place databases near analytic engines without re-architecture. In APAC, 5G rollouts and state-backed datacenter programs compress migration timelines further.
On-premise installations persist in finance, defense, and healthcare where sovereignty or latency concerns prevail. Vendors now ship containerized versions of their stacks so clients can move workloads between private clusters and public clouds while preserving licensing and support entitlements. Sovereign-cloud services allow European banks to host regulated data inside national borders, blending compliance with cloud economics. Edge-computing blueprints emerge for logistics and manufacturing clients that require sub-millisecond response at plant sites yet central governance for analytics.
Business Software Market is Segmented by Software Type (ERP, CRM, Business Intelligence and Analytics, and More), Deployment (Cloud, On-Premises), End-User Industry (BFSI, Healthcare and Life Sciences, Government and Public Sector, and More), Organization Size (Large Enterprises, Smes), and by Geography. The Market Forecasts are Provided in Terms of Value (USD).
Geography Analysis
North America retained 25.05% of 2025 revenue in the business software market, supported by mature cloud infrastructure and stringent sectoral regulations. Microsoft invested USD 16.75 billion in 2025 capital expenditures to keep pace with rising U.S. demand for AI training capacity. Canadian banks deploy sovereignty-compliant SaaS, while Mexican manufacturers digitize shop-floors to optimize near-shoring workflows. The region's focus shifts from basic cloud migration to AI-infused productivity, expanding addressable spending beyond traditional license uplift.
Asia-Pacific is the fastest-growing geography, advancing at a 12.52% CAGR through 2031. China embeds enterprise software into government-led digital-economy initiatives, and local vendors harmonize with domestic cloud policies. Japan pursues workforce-productivity platforms to offset demographic pressures, whereas India's booming SME segment harnesses low-code suites to formalize operations. Singapore and Hong Kong anchor regional cloud hubs, supplying latency-sensitive services to Southeast Asian e-commerce merchants.
- Microsoft Corporation
- International Business Machines Corporation
- Oracle Corporation
- SAP SE
- Cisco Systems Inc.
- Salesforce Inc.
- Adobe Inc.
- Intuit Inc.
- Sage Group plc
- Workday Inc.
- ServiceNow Inc.
- Epicor Software Corporation
- Infor
- Oracle NetSuite
- Accenture plc
- Deltek Inc.
- Zoho Corporation
- Atlassian Corporation
- Freshworks Inc.
- HubSpot Inc.
- Odoo S.A.
Additional Benefits:
- The market estimate (ME) sheet in Excel format
- 3 months of analyst support
TABLE OF CONTENTS
1 INTRODUCTION
- 1.1 Study Assumptions and Market Definition
- 1.2 Scope of the Study
2 RESEARCH METHODOLOGY
3 EXECUTIVE SUMMARY
4 MARKET LANDSCAPE
- 4.1 Market Overview
- 4.2 Market Drivers
- 4.2.1 AI-powered workflow automation adoption
- 4.2.2 Shift to subscription / SaaS revenue models
- 4.2.3 Demand for unified data fabrics
- 4.2.4 Low-code / no-code platforms in citizen development
- 4.2.5 Rising ESG and sustainability reporting mandates
- 4.2.6 Near-shoring and resilient digital supply chains
- 4.3 Market Restraints
- 4.3.1 Escalating cloud spend optimization pressure
- 4.3.2 Growing open-source alternatives
- 4.3.3 Data-sovereignty and cross-border compliance hurdles
- 4.3.4 Shortage of domain-specific implementation talent
- 4.4 Supply-Chain Analysis
- 4.5 Regulatory Landscape
- 4.6 Technological Outlook
- 4.7 Porter's Five Forces Analysis
- 4.7.1 Bargaining Power of Suppliers
- 4.7.2 Bargaining Power of Buyers
- 4.7.3 Threat of New Entrants
- 4.7.4 Threat of Substitutes
- 4.7.5 Intensity of Competitive Rivalry
- 4.8 Assesment of Macroeconomic Factors on the market
5 MARKET SIZE AND GROWTH FORECASTS (VALUE)
- 5.1 By Software Type
- 5.1.1 ERP
- 5.1.2 CRM
- 5.1.3 Business Intelligence and Analytics
- 5.1.4 Supply Chain Management
- 5.1.5 Human Resource Management
- 5.1.6 Finance and Accounting
- 5.1.7 Project and Portfolio Management
- 5.1.8 Others
- 5.2 By Deployment
- 5.2.1 Cloud
- 5.2.2 On-Premise
- 5.3 By End-User Industry
- 5.3.1 BFSI
- 5.3.2 Healthcare and Life Sciences
- 5.3.3 Government and Public Sector
- 5.3.4 Retail and E-commerce
- 5.3.5 Transportation and Logistics
- 5.3.6 Manufacturing
- 5.3.7 Telecommunications and Media
- 5.3.8 Others
- 5.4 By Organization Size
- 5.4.1 Large Enterprises
- 5.4.2 Small and Medium Enterprises
- 5.5 By Geography
- 5.5.1 North America
- 5.5.1.1 United States
- 5.5.1.2 Canada
- 5.5.1.3 Mexico
- 5.5.2 South America
- 5.5.2.1 Brazil
- 5.5.2.2 Argentina
- 5.5.2.3 Rest of South America
- 5.5.3 Europe
- 5.5.3.1 Germany
- 5.5.3.2 United Kingdom
- 5.5.3.3 France
- 5.5.3.4 Italy
- 5.5.3.5 Spain
- 5.5.3.6 Rest of Europe
- 5.5.4 Asia-Pacific
- 5.5.4.1 China
- 5.5.4.2 Japan
- 5.5.4.3 India
- 5.5.4.4 South Korea
- 5.5.4.5 Southeast Asia
- 5.5.4.6 Rest of Asia-Pacific
- 5.5.5 Middle East and Africa
- 5.5.5.1 Middle East
- 5.5.5.1.1 Saudi Arabia
- 5.5.5.1.2 United Arab Emirates
- 5.5.5.1.3 Turkey
- 5.5.5.1.4 Rest of Middle East
- 5.5.5.2 Africa
- 5.5.5.2.1 South Africa
- 5.5.5.2.2 Nigeria
- 5.5.5.2.3 Egypt
- 5.5.5.2.4 Rest of Africa
- 5.5.5.1 Middle East
- 5.5.1 North America
6 COMPETITIVE LANDSCAPE
- 6.1 Market Concentration
- 6.2 Strategic Moves
- 6.3 Market Share Analysis
- 6.4 Company Profiles (includes Global level Overview, Market level overview, Core Segments, Financials as available, Strategic Information, Market Rank/Share for key companies, Products and Services, and Recent Developments)
- 6.4.1 Microsoft Corporation
- 6.4.2 International Business Machines Corporation
- 6.4.3 Oracle Corporation
- 6.4.4 SAP SE
- 6.4.5 Cisco Systems Inc.
- 6.4.6 Salesforce Inc.
- 6.4.7 Adobe Inc.
- 6.4.8 Intuit Inc.
- 6.4.9 Sage Group plc
- 6.4.10 Workday Inc.
- 6.4.11 ServiceNow Inc.
- 6.4.12 Epicor Software Corporation
- 6.4.13 Infor
- 6.4.14 Oracle NetSuite
- 6.4.15 Accenture plc
- 6.4.16 Deltek Inc.
- 6.4.17 Zoho Corporation
- 6.4.18 Atlassian Corporation
- 6.4.19 Freshworks Inc.
- 6.4.20 HubSpot Inc.
- 6.4.21 Odoo S.A.
7 MARKET OPPORTUNITIES AND FUTURE OUTLOOK
- 7.1 White-space and Unmet-Need Assessment
 商業軟體與服務市場:2026-2032年全球市場預測(按組件、部署類型、企業規模、應用和產業分類)
 2026年全球商業軟體服務市場報告2026年全球商業軟體市場報告2026年全球商業計劃審查服務市場報告
 2026-2030年全球商業軟體服務市場
 商業軟體和服務市場分析及預測(至2035年):按類型、產品類型、服務、技術、組件、應用、部署類型、最終用戶、模組和功能分類
 商業軟體服務市場-全球產業規模、佔有率、趨勢、機會和預測:按軟體、服務、公司規模、最終用戶、地區和競爭格局分類,2021-2031年智慧選股服務軟體市場:依部署模式、定價模式和最終用戶類型分類-全球預測(2026-2032年)
 企業秘書軟體市場規模、佔有率和成長分析(按組件、部署類型、組織規模、產業垂直領域和地區分類)-2026-2033年產業預測
 商業軟體和服務市場:按軟體、按服務、按部署、按公司規模、按最終用途、按地區