


 |
市場調查報告書
商品編碼
1911417
歐洲電動貨運自行車市場-佔有率分析、產業趨勢與統計、成長預測(2026-2031)Europe E-Cargo Bike - Market Share Analysis, Industry Trends & Statistics, Growth Forecasts (2026 - 2031) |
||||||
※ 本網頁內容可能與最新版本有所差異。詳細情況請與我們聯繫。
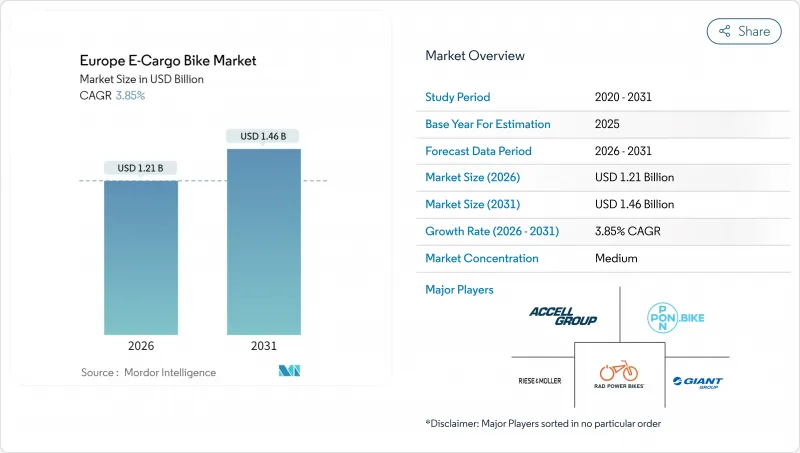
歐洲電動貨運自行車市場預計到 2026 年價值 12.1 億美元,高於 2025 年的 11.6 億美元,預計到 2031 年將達到 14.6 億美元,2026 年至 2031 年的複合年成長率為 3.85%。
這項展望反映了成熟的需求曲線,其中有利的法規、鋰離子電池成本的下降以及城市物流的重組持續推動電動自行車的普及,而沒有出現最初的激增。城市層面的零排放配送區、慷慨的商用車補貼以及密集的微型倉配網路共同增強了電動自行車的商業價值,而每千瓦時每美元電池價格的大幅下降則消除了關鍵的成本障礙。市場競爭強度仍適中。雖然成熟的自行車品牌利用垂直整合和服務網路,但隨著採購活動轉向線上,以數位化為先導的新興參與企業正在施加價格壓力。同時,細分市場趨勢表明,在西歐主要大都市地區,助力驅動系統、鋰離子電池、中置馬達以及中高階價格區間構成了主流商用電動自行車的配置標準。
歐洲電動貨運自行車市場趨勢與洞察
城市物流零排放法規
歐洲各城市正穩步擴大零排放配送區,迫使物流業者重新評估車輛的經濟效益。阿姆斯特丹自2025年起禁止石化燃料貨車進入市中心,這項禁令促使領先購買電動貨運自行車。倫敦的超低排放區對柴油貨車徵收每日收費,一旦費用超過閾值,電動貨運自行車的整體擁有成本優勢就會顯著增強。德國、法國和荷蘭的監管協調進一步放大了這些成本訊號,例如亞馬遜物流等泛歐車隊已將柏林、巴黎和米蘭的微型交通樞紐作為標準化營運中心。隨著越來越多的城市公佈逐步淘汰內燃貨車的計劃,營運商將歐洲電動貨運自行車市場視為一種合規措施,以保持跨轄區路線的柔軟性。
商用電動貨車補貼
目前,國家和地方政府的獎勵計畫主要針對企業買家而非消費者。德國的BAFA計畫可報銷高達25%的採集費用,並可與地方政府補貼疊加以提高補貼比例。法國5,500萬歐元(約6,400萬美元)的自行車投資基金正在擴大對商用電動貨運車隊的津貼。荷蘭大幅提高了貨運自行車以及中小企業的稅額扣抵。這些激勵措施縮短了高使用率服務的投資回收期,也解釋了為什麼企業買家在西歐的訂單中佔據主導地位。
缺乏路邊充電設施
歐洲大多數城市缺乏專用於商用電動貨運自行車的街道充電樁,迫使車隊營運商依賴車庫進行營運。在車庫中,一個4安培的充電器充滿800瓦時的電池可能需要長達六個小時,這不僅增加了場地成本,也造成了運作損失。由於缺乏開放標準,混合車隊不得不安裝來自不同供應商的專用充電樁,這進一步加重了資金壓力。這種差距在南歐主要城市(馬德里、羅馬和雅典)尤為突出,這些城市的共用微出行政策專注於Scooter,而忽略了商用貨運自行車。除非市政委員會強制要求在卸貨區設置街道充電樁,否則希望進入歐洲電動貨運自行車市場的Start-Ups新創公司將繼續難以突破試點車隊的局限,擴大規模。
細分市場分析
截至2025年,腳踏輔助驅動系統佔了歐洲電動貨運自行車市場92.58%的佔有率。這是因為根據歐盟第168/2013號法規,它們被歸類為自行車,因此無需繳納機動車保險和辦理牌照手續。監管的確定性讓企業安心,促使企業採購部門在主流小包裹遞送領域堅持選擇此類產品,其平均負載容量約為120公斤。隨著大型快遞公司對其車輛進行標準化,以最大限度地減少培訓和合規負擔,預計歐洲腳踏輔助電動貨運自行車市場規模將穩定成長。
然而,油門輔助系統預計將以4.35%的複合年成長率成長。這是因為運輸食品、家具和城市廢棄物等重物需要持續的動力,而這種動力並不依賴駕駛員的體力。德國、法國和義大利已將時速25公里以下的車輛動力等級定義標準化,使得車隊管理者能夠在不增加責任責任險的情況下引入油門輔助車輛。因此,製造商正在推出雙模式控制器,允許營運商切換合規等級,使其車輛能夠適應不斷變化的城市法規。
到2025年,鋰離子電池技術將佔據歐洲電動貨運自行車市場89.65%的佔有率,年複合成長率達4.02%,這主要得益於千瓦時電價的大幅下降。電池組的使用壽命已達到足以滿足企業車隊更新週期要求的完整循環次數。磷酸鐵鋰電池(LFP)憑藉其固有的熱穩定性和卓越的循環耐久性佔據了市場主導地位,而這些特性對於大量宅配業務至關重要。
鉛酸電池目前僅用於入門級消費級貨運自行車,而這類自行車的購置價格往往高於總擁有成本。固態電池原型機雖然備受關注,但距離具備商業性成本競爭力仍需四年。同時,原始設備製造商(OEM)的重點正轉向智慧電池管理系統,該系統具備電池單元級監控、藍牙診斷和地理鎖定防盜功能,旨在提高車隊轉售時的殘值。
輪轂式馬達目前仍佔55.72%的市場佔有率,但預計到2031年,中置馬達的複合年成長率將達到5.05%,超過市場平均。與自行車變速箱整合後實現的扭矩放大效應在里斯本和里昂眾多陡峭的道路上尤為實用。 BoschPerformance Line CX Cargo馬達可產生85牛頓米的扭矩,讓200公斤的貨物能夠輕鬆駛上坡道,而不會讓騎乘者感到吃力。
過去,維護的複雜性是購買的一大障礙,但不斷擴展的服務網路和預測性診斷應用程式正在減少停機時間。一些車隊營運商現在認為,輪轂式馬達和中置馬達的總擁有成本在第二年後大致相當,而那些採取務實策略的營運商正擴大轉向後者。
其他福利:
- Excel格式的市場預測(ME)表
- 分析師支持(3個月)
目錄
第1章 引言
- 研究假設和市場定義
- 調查範圍
第2章調查方法
第3章執行摘要
第4章:主要產業趨勢
- 年度自行車銷售額
- 平均銷售價格和價格範圍構成
- 電動自行車及其零件的跨境貿易(進口/出口)
- 電動自行車在自行車總銷量中所佔的百分比
- 單程通勤距離 5-15 公里的通勤者 (%)
- 自行車和電動式自行車租賃市場規模
- 電動自行車電池組價格
- 電池化學價格比較
- 最後一公里(超本地化)配送量
- 受保護的自行車道(公里)
- 電動自行車電池容量(瓦時)
- 都市交通壅塞指數
- 法律規範
- 電動自行車的型式認可和認證
- 進出口和貿易法規
- 分類、道路使用和使用者規定
- 電池、充電器和充電安全
第5章 市場情勢
- 市場概覽
- 市場促進因素
- 城市物流強制零排放
- 商用電動貨車補貼
- 電池單價(美元/度)大幅下降(低於100歐元)
- 高密度微型倉配網路的成長
- 企業ESG採購目標
- 低速電動車的保險優惠
- 市場限制
- 缺乏路邊充電設施
- 負載容量與續航里程的權衡(與廂型車相比)
- 零件標準碎片化
- 中置驅動系統熟練技工短缺
- 價值/供應鏈分析
- 技術展望
- 波特五力模型
- 新進入者的威脅
- 供應商的議價能力
- 買方的議價能力
- 替代品的威脅
- 競爭對手之間的競爭
第6章 市場規模及成長預測(數量及規模)
- 依推進類型
- 踏板輔助
- 油門輔助
- 依電池類型
- 鉛酸電池
- 鋰離子電池
- 其他
- 按下馬達安裝位置
- 輪轂(前/後)
- 中置馬達
- 透過驅動系統
- 鏈傳動
- 皮帶傳動
- 透過馬達輸出
- 小於250瓦
- 251-350 W
- 351-500 W
- 501-600 W
- 600瓦或以上
- 按價格範圍
- 低於1000美元
- 1,000-1,499 美元
- 1500-2499美元
- 2,500-3,499 美元
- 3,500-5,999 美元
- 超過6000美元
- 按銷售管道
- 線上
- 離線
- 按最終用途
- 商業航運
- 零售和商品分銷
- 食品和飲料配送
- 服務供應商
- 其他
- 商業航運
- 按地區
- 西歐
- 德國
- 法國
- 英國
- 荷蘭
- 比利時
- 盧森堡
- 南歐
- 義大利
- 西班牙
- 葡萄牙
- 希臘
- 北歐的
- 丹麥
- 瑞典
- 挪威
- 芬蘭
- 東歐
- 波蘭
- 捷克共和國
- 匈牙利
- 斯洛伐克
- 瑞士
- 其他歐洲地區
- 西歐
第7章 競爭情勢
- 市場集中度
- 策略趨勢
- 市佔率分析
- 公司簡介
- Accell Group
- Bakfiets.nl
- CUBE Bikes
- Douze Factory SAS
- Giant Manufacturing Co. Ltd.
- Pon Holdings BV(incl. Urban Arrow)
- Rad Power Bikes Inc.
- Riese & Muller GmbH
- RYTLE GmbH
- Yubabikes Inc.
- Tern Bicycles
- Benno Bikes
- Larry vs Harry
- Butchers & Bicycles(EventyrCykler)
- Triobike A/S
- CARLA CARGO Engineering GmbH
- ONOMOTION GmbH
第8章:市場機會與未來展望
- 閒置頻段與未滿足需求評估
第9章:CEO們需要思考的關鍵策略問題
The Europe e-cargo bike market size in 2026 is estimated at USD 1.21 billion, growing from 2025 value of USD 1.16 billion with 2031 projections showing USD 1.46 billion, growing at 3.85% CAGR over 2026-2031.
This outlook captures a maturing demand curve in which supportive regulation, falling lithium-ion battery costs, and urban logistics restructuring continue to nudge adoption forward without the explosive jumps seen in earlier years. City-level zero-emission delivery zones, generous commercial fleet subsidies, and dense micro-fulfillment networks collectively reinforce the business case, while the rapid drop in battery USD/kWh has erased a key cost barrier. Competitive intensity remains moderate: established bicycle brands leverage vertical integration and service networks, yet digital-first entrants add pricing pressure as procurement shifts online. Meanwhile, segment dynamics reveal that pedal-assisted drivetrains, lithium-ion batteries, mid-drive motors, and mid-premium price points define the mainstream commercial specification across Western European hubs.
Europe E-Cargo Bike Market Trends and Insights
Urban-Logistics Zero-Emission Mandates
European municipalities are steadily enlarging zero-emission delivery zones, forcing logistics operators to reassess vehicle economics. Amsterdam's ban on fossil-fuel vans inside the city core from 2025 has already triggered forward purchases of e-cargo bikes. London's Ultra Low Emission Zone exposes diesel vans to daily fees that can surpass a threshold that tilts total cost of ownership decisively toward electrically assisted cargo cycles. Regulatory convergence across Germany, France, and the Netherlands compounds these cost signals, prompting pan-European fleets such as Amazon Logistics to standardize on micromobility depots in Berlin, Paris, and Milan. As more cities publish phase-out timelines for internal-combustion vans, operators view the Europe e-cargo bike market as a compliance hedge that preserves route flexibility across jurisdictions.
Subsidies for Commercial E-Cargo Fleets
National and municipal incentive programs now target business buyers rather than consumers. Germany's BAFA scheme reimburses up to 25% of acquisition cost and can be stacked with local grants that raise subsidy coverage. France's EUR 55 million (~USD 64 million) bicycle investment fund extends grants to commercial e-cargo fleets . The Netherlands adds significant cargo bike plus tax deductions for small enterprises. These incentives compress payback periods for high-utilization services, explaining why corporate buyers dominate order books in Western Europe.
Limited Secure On-Street Charging
Most European cities lack purpose-built curbside chargers for commercial e-cargo cycles. Fleet operators therefore tether operations to depots, incurring real-estate and downtime costs when 800 Wh batteries require up to six hours for a full cycle on 4 A chargers. The absence of open standards forces mixed fleets to install proprietary docks from multiple vendors, straining capital budgets. Southern European hubs-Madrid, Rome, Athens-show the largest gaps because shared micromobility policies focus on scooters rather than commercial cargo bikes. Until city councils mandate curbside charging in loading bays, scaling above pilot fleets remains arduous for courier start-ups eyeing the Europe e-cargo bike market.
Other drivers and restraints analyzed in the detailed report include:
- Rapid Drop in Battery USD/KWH Below EUR 100
- Dense Micro-Fulfilment Network Growth
- Payload and Range Trade-Offs Versus Vans
For complete list of drivers and restraints, kindly check the Table Of Contents.
Segment Analysis
Pedal-assisted drivetrains held 92.58% of the Europe e-cargo bike market share in 2025, reflecting their classification as bicycles under EU Regulation 168/2013, which exempts them from motor-vehicle insurance and licensing. The comfort of regulatory certainty keeps corporate buyers entrenched in this category for mainstream parcel delivery, where average loads hover near 120 kg. The Europe e-cargo bike market size for pedal assist is set to grow steadily as large couriers standardize fleets to minimize training and compliance overhead.
Throttle-assisted alternatives will, however, clock a 4.35% CAGR because heavy grocery, furniture, and municipal waste applications require continuous power unaffected by rider stamina. As Germany, France, and Italy align power-class definitions up to 25 km/h, fleet managers can integrate throttle-assisted units without increasing liability insurance lines. Manufacturers accordingly release dual-mode controllers that let operators toggle between compliance classes, future-proofing assets against evolving city statutes.
Lithium-ion technology captured 89.65% share of the Europe e-cargo bike market size in 2025 and continues rising at a 4.02% CAGR as kilowatt-hour costs freefall. Pack lifespans now reach significant full cycles, aligning with corporate fleet replacement timelines. LFP chemistry absorbs most volume due to intrinsic thermal stability and a notable cycle durability, a critical trait for high-turnover courier missions.
Lead-acid persists only in entry-level consumer cargo bikes where purchase price trumps total cost of ownership. Solid-state prototypes attract headlines but remain four years from commercial costing parity. In the interim, OEM focus shifts to smart battery management systems with cell-level monitoring, Bluetooth diagnostics, and geofenced immobilization-capabilities that enhance residual value at fleet resale.
Hub motors still hold 55.72% share yet mid-drive units will grow above the market at 5.05% CAGR through 2031. The torque multiplication afforded by integrating with bicycle gearing proves invaluable on gradients common in Lisbon or Lyon. Bosch's Performance Line CX Cargo motor delivers 85 Nm, enabling 200 kg payload starts on inclines without rider strain .
Higher maintenance complexity once deterred buyers, but expanding service networks and predictive diagnostic apps reduce downtime. Some fleet operators now benchmark hub versus mid-drive total cost of ownership at near parity after year two, tipping the specification mix toward the latter for utility-intensive routes.
The Europe E-Cargo Bike Market Report is Segmented by Propulsion Type (Pedal Assisted, Throttle Assisted), Battery Type (Lead Acid Battery, Lithium-Ion Battery, and More), Motor Placement (Hub (Front/Rear), Mid-Drive), Drive Systems (Chain Drive, Belt Drive), Motor Power (Below 250W, 251-350W, and More), Price Band, Sales Channel, End Use, and Geography. The Market Forecasts are Provided in Terms of Value (USD) and Volume (Units).
List of Companies Covered in this Report:
- Accell Group
- Bakfiets.nl
- CUBE Bikes
- Douze Factory SAS
- Giant Manufacturing Co. Ltd.
- Pon Holdings B.V. (incl. Urban Arrow)
- Rad Power Bikes Inc.
- Riese & Muller GmbH
- RYTLE GmbH
- Yubabikes Inc.
- Tern Bicycles
- Benno Bikes
- Larry vs Harry
- Butchers & Bicycles (EventyrCykler)
- Triobike A/S
- CARLA CARGO Engineering GmbH
- ONOMOTION GmbH
Additional Benefits:
- The market estimate (ME) sheet in Excel format
- 3 months of analyst support
TABLE OF CONTENTS
1 Introduction
- 1.1 Study Assumptions & Market Definition
- 1.2 Scope of the Study
2 Research Methodology
3 Executive Summary
4 Key Industry Trends
- 4.1 Annual Bicycle Sales
- 4.2 Average Selling Price & Price-Band Mix
- 4.3 Cross-Border Trade in E-Bikes & Parts (Imports/Exports)
- 4.4 E-Bike Share of Total Bicycle Sales
- 4.5 Commuters with 5-15 km One-Way Trips (%)
- 4.6 Bicycle/E-Bike Rental Market Size
- 4.7 E-Bike Battery Pack Price
- 4.8 Battery Chemistry Price Comparison
- 4.9 Last-Mile (Hyper-Local) Delivery Volume
- 4.10 Protected Bicycle Lanes (km)
- 4.11 E-Bike Battery Capacity (Wh)
- 4.12 Urban Traffic Congestion Index
- 4.13 Regulatory Framework
- 4.13.1 Homologation & Certification of E-Bicycles
- 4.13.2 Export-Import and Trade Regulation
- 4.13.3 Classification, Road Access and User Rules
- 4.13.4 Battery, Charger and Charging Safety
5 Market Landscape
- 5.1 Market Overview
- 5.2 Market Drivers
- 5.2.1 Urban-Logistics Zero-Emission Mandates
- 5.2.2 Subsidies for Commercial E-Cargo Fleets
- 5.2.3 Rapid Drop in Battery USD/KWH Below EUR 100
- 5.2.4 Dense Micro-Fulfilment Network Growth
- 5.2.5 Corporate ESG Procurement Targets
- 5.2.6 Insurance Incentives for Low-Speed EVs
- 5.3 Market Restraints
- 5.3.1 Limited Secure On-Street Charging
- 5.3.2 Payload and Range Trade-Offs Versus Vans
- 5.3.3 Fragmented Component Standards
- 5.3.4 Skilled-Mechanic Shortage for Mid-Drive Systems
- 5.4 Value / Supply-Chain Analysis
- 5.5 Technological Outlook
- 5.6 Porter's Five Forces
- 5.6.1 Threat of New Entrants
- 5.6.2 Bargaining Power of Suppliers
- 5.6.3 Bargaining Power of Buyers
- 5.6.4 Threat of Substitutes
- 5.6.5 Competitive Rivalry
6 Market Size & Growth Forecasts (Value & Volume)
- 6.1 By Propulsion Type
- 6.1.1 Pedal Assisted
- 6.1.2 Throttle Assisted
- 6.2 By Battery Type
- 6.2.1 Lead Acid Battery
- 6.2.2 Lithium-ion Battery
- 6.2.3 Others
- 6.3 By Motor Placement
- 6.3.1 Hub (Front/Rear)
- 6.3.2 Mid-drive
- 6.4 By Drive Systems
- 6.4.1 Chain Drive
- 6.4.2 Belt Drive
- 6.5 By Motor Power
- 6.5.1 Below 250 W
- 6.5.2 251-350 W
- 6.5.3 351-500 W
- 6.5.4 501-600 W
- 6.5.5 Above 600 W
- 6.6 By Price Band
- 6.6.1 Up to USD 1,000
- 6.6.2 USD 1,000-1,499
- 6.6.3 USD 1,500-2,499
- 6.6.4 USD 2,500-3,499
- 6.6.5 USD 3,500-5,999
- 6.6.6 Above USD 6,000
- 6.7 By Sales Channel
- 6.7.1 Online
- 6.7.2 Offline
- 6.8 By End Use
- 6.8.1 Commercial Delivery
- 6.8.1.1 Retail and Goods Delivery
- 6.8.1.2 Food and Beverage Delivery
- 6.8.2 Service Providers
- 6.8.3 Others
- 6.8.1 Commercial Delivery
- 6.9 By Geography
- 6.9.1 Western Europe
- 6.9.1.1 Germany
- 6.9.1.2 France
- 6.9.1.3 United Kingdom
- 6.9.1.4 Netherlands
- 6.9.1.5 Belgium
- 6.9.1.6 Luxembourg
- 6.9.2 Southern Europe
- 6.9.2.1 Italy
- 6.9.2.2 Spain
- 6.9.2.3 Portugal
- 6.9.2.4 Greece
- 6.9.3 Northern Europe
- 6.9.3.1 Denmark
- 6.9.3.2 Sweden
- 6.9.3.3 Norway
- 6.9.3.4 Finland
- 6.9.4 Eastern Europe
- 6.9.4.1 Poland
- 6.9.4.2 Czech Republic
- 6.9.4.3 Hungary
- 6.9.4.4 Slovakia
- 6.9.5 Switzerland
- 6.9.6 Rest of Europe
- 6.9.1 Western Europe
7 Competitive Landscape
- 7.1 Market Concentration
- 7.2 Strategic Moves
- 7.3 Market Share Analysis
- 7.4 Company Profiles (Includes Global Level Overview, Market Level Overview, Core Segments, Financials as Available, Strategic Information, Market Rank/Share for Key Companies, Products and Services, SWOT Analysis, and Recent Developments)
- 7.4.1 Accell Group
- 7.4.2 Bakfiets.nl
- 7.4.3 CUBE Bikes
- 7.4.4 Douze Factory SAS
- 7.4.5 Giant Manufacturing Co. Ltd.
- 7.4.6 Pon Holdings B.V. (incl. Urban Arrow)
- 7.4.7 Rad Power Bikes Inc.
- 7.4.8 Riese & Muller GmbH
- 7.4.9 RYTLE GmbH
- 7.4.10 Yubabikes Inc.
- 7.4.11 Tern Bicycles
- 7.4.12 Benno Bikes
- 7.4.13 Larry vs Harry
- 7.4.14 Butchers & Bicycles (EventyrCykler)
- 7.4.15 Triobike A/S
- 7.4.16 CARLA CARGO Engineering GmbH
- 7.4.17 ONOMOTION GmbH
8 Market Opportunities & Future Outlook
- 8.1 White-space & Unmet-need Assessment
9 Key Strategic Questions for E-Bikes CEOs
 電動貨運自行車市場分析及預測(至2035年):類型、產品、服務、技術、組件、應用、最終用戶、功能、安裝類型、模式
 電動貨運自行車市場預測至2034年-全球分析(按自行車類型、馬達類型、電池類型、負載能力、應用、最終用戶和地區分類)
 2026年全球電動貨運自行車市場報告
 全球電動貨運自行車市場規模、佔有率、趨勢和成長分析報告(2026-2034)
 電動貨運自行車市場:按類型、負載容量、驅動系統、電池類型、電壓、最終用戶、應用和分銷管道分類-2026-2032年全球市場預測
 電動貨運自行車:市場佔有率分析、產業趨勢與統計、成長預測(2026-2031)
 電動貨運自行車市場規模、佔有率和成長分析(按電池類型、推進方式、產品類型和地區分類)-2026-2033年產業預測
 全球電動貨運自行車市場
 電動貨物摩托車的全球市場:產品類型·電池類型·驅動方式·模式·距離·最高速度·負載容量·用途·不同地區的預測 (~2032年)