


 |
市場調查報告書
商品編碼
1911364
氫氣生產:市場佔有率分析、產業趨勢與統計、成長預測(2026-2031)Hydrogen Generation - Market Share Analysis, Industry Trends & Statistics, Growth Forecasts (2026 - 2031) |
||||||
※ 本網頁內容可能與最新版本有所差異。詳細情況請與我們聯繫。
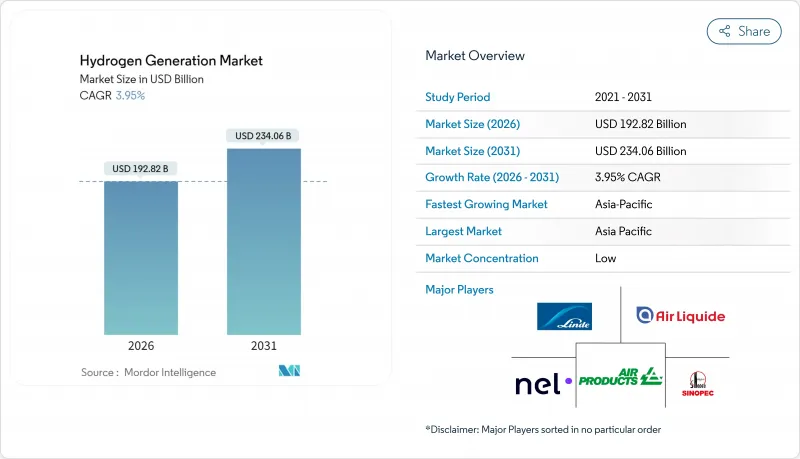
2025年氫氣生產市場價值為1,854.9億美元,預計到2031年將達到2,340.6億美元,而2026年為1,928.2億美元。
預計在預測期(2026-2031 年)內,複合年成長率將達到 3.95%。
隨著政策支持下對低碳分子的需求取代化石燃料供應,氫氣市場正經歷擴張,這刺激了對電解和碳捕獲維修的投資。歐盟的非生物來源可再生燃料(RFNBO)法規和美國第45V條生產稅額扣抵等監管機制,正在將自願脫碳努力轉化為合規義務,為氫氣生產市場提供可預測的收入基礎。再生能源價格的下降和電解超級工廠規模的擴大正在重塑技術成本,而碳定價機制則正在擴大灰色分子和清潔分子之間的成本差距。同時,鋼鐵、氨和甲醇等產業部門的長期承購協議正在降低吉瓦級計劃的風險,並使氫氣生產市場擺脫對傳統煉油廠營運的依賴。
全球氫氣市場趨勢及展望
歐盟RFNBO強制令刺激了對認證綠氫的需求
RFNBO框架要求煉油廠、化工廠和鋼鐵廠採購經認證的可再生氫,將這種綠色分子轉化為符合規定的商品。首輪7.2億歐元的競標縮小了化石燃料和可再生能源供應之間的成本差距,為吉瓦級電解陣列的最終投資決策奠定了基礎。關於額外性和時間相關性的認證規則區分了高級產品等級,並促進了專用可再生能源購電協議(PPA)的簽訂。像EWE這樣的公共產業正在安裝與陸上風電場相連的280兆瓦電解,預計2027年開始營運。結構化的購電協議支援企劃案融資,並為設備供應商提供多年訂單的運作。
美國第 45V 條款稅額扣抵加速了國內電解建設
第45V條於2025年1月最終確定,規定對二氧化碳當量低於4公斤的氫氣生產提供每公斤最高3美元的補貼,將使許多美國計劃立即獲利。三級獎勵鼓勵按小時回應可再生能源,並促進電網級儲能和先進能源管理系統的發展。 Nel ASA公司獲得了聯邦資金,用於擴建其位於密西西比州的電解工廠;Plug Power公司訂單了澳大利亞綠色氨項目的3吉瓦訂單,這表明美國政策推動了全球製造規模的擴大。十年稅額扣抵的確定性使得長期購電協議得以簽訂,而開發商則透過模擬各種政治情境來對沖下行風險。
吉瓦級電解專案一級可再生電協議短缺
由於開發商無法以具有競爭力的價格獲得長期可再生能源購電協議 (PPA),歐洲規劃的 130 吉瓦電解產能中只有一小部分獲得了資金籌措。資料中心、電動車充電網路和傳統工業都在爭奪相同的認證電力,這給氫能計劃的利潤率帶來了壓力。德國的國家氫氣幹線電價(25 歐元/kWh)和荷蘭的綠色電力強制令(4%)進一步推高了購電協議的溢價。除非離岸風競標會加快進行,否則許多計劃將被推遲到 2027 年以後,這將加劇短期電力供應的緊張。
細分市場分析
到2025年,灰氫將滿足全球97.21%的氫氣需求,鞏固了對蒸氣重組和煤炭氣化的傳統依賴。這種主導地位掩蓋了電解供應的快速成長,預計到2031年,綠氫供應將以32.6%的複合年成長率成長。隨著監管意識日益增強的客戶擴大設定僅使用可再生的合約配額,這種激增正在改變採購模式。預計綠氫市場在歐洲和北美成長最快,因為這些地區的政策獎勵有助於抵消不斷上漲的平準化成本。現有資產所有者正在對部分工廠進行改造,加裝碳捕集設備,以確保獲得低碳認證;計劃開發商則將可再生能源購電協議(PPA)和管道接入納入長期供應協議。
藍氫提供了一種過渡方案,尤其是在天然氣資源豐富的地區,可以利用枯竭的儲存進行二氧化碳儲存。綠松石氫生產流程會產生固體碳產品,雖然已吸引創業投資資金,但仍處於商業化前期階段。粉紅色氫能在核能發電裝置容量高但可再生能源用地有限的國家佔據著一定的市場佔有率,為公用事業公司提供了基本負載脫碳方案。根據每種生產流程的成熟度來掌握投資時機,為氫氣生產市場的多元化投資組合提供了更多選擇。
氫氣生產市場報告按原料(灰氫、藍氫、綠氫、其他)、技術(蒸氣重組、煤炭氣化、電解、其他)、應用(煉油、化學加工、鋼鐵、運輸燃料、電力和儲能、其他)以及地區(北美、歐洲、亞太、南美、中東和非洲)進行細分。
區域分析
到2025年,亞太地區將佔全球氫能收入的54.08%,這主要得益於中國龐大的煤炭氣化裝置和電解槽的加速部署。北京採取雙管齊下的模式,一方面維持現有的灰氫生產,另一方面建造連接內蒙古和沿海工業區的世界最大專用氫氣管道。印度的「國家綠色氫能計畫」在損益平衡資金和電解槽電解槽堆進口關稅豁免的支持下,使其成為下一個成長前沿。高日照度的東南亞國協,特別是印尼和馬來西亞,正在建造以出口為導向的氨走廊,將其與日本和韓國的買家連接起來。
歐洲是全球第二大市場,但政策力道卻遙遙領先。 RFNBO配額、價值240億歐元的德國主幹管道以及HYBRIT等氫基鋼鐵項目,正推動該地區大規模部署清潔分子能源。計劃瓶頸主要在於缺乏低成本的可再生能源購電協議(PPA),但離岸風力發電競標進程的加速正在釋放更多產能。北歐水力發電為斯堪地那維亞電解計劃提供穩定、低碳的電力供應,降低了氫氣交付成本,使其低於歐洲大陸競爭對手。
在北美,第45V條款激勵措施、豐富的風能和太陽能資源,以及墨西哥灣沿岸和中西部地區成熟的產業叢集,都為該項目提供了優勢。加拿大的碳定價政策和水力資源豐富的州支持面向亞洲和歐洲的出口導向清潔氨計劃。水資源管理和核准流程仍然是美國開發商面臨的主要障礙,尤其是在乾旱的西部各州。在中東,沙烏地阿拉伯、阿曼和阿拉伯聯合大公國正在開發吉瓦級綜合樞紐,利用具有競爭力的可再生能源,並透過現有的油輪航線運輸綠色氨。非洲新興的清潔氨計畫主要集中在奈米比亞和茅利塔尼亞,這兩個國家擁有世界一流的太陽能資源、充足的土地資源,並且接近性歐盟,這些優勢正在吸引早期投資。
其他福利:
- Excel格式的市場預測(ME)表
- 3個月的分析師支持
目錄
第1章 引言
- 研究假設和市場定義
- 調查範圍
第2章調查方法
第3章執行摘要
第4章 市場情勢
- 市場概覽
- 市場促進因素
- 歐盟可再生、低碳、非化石能源(RFNBO)強制令加速綠氫能承購合約的簽訂
- 透過IRA和美國第45V條稅額扣抵抵免促進國內電解槽建設
- 中國的煤氫混合政策支撐了灰藍計劃
- 中東氨出口中心催生了對綠氫的千兆瓦級需求。
- 北歐鋼鐵製造商的HySustain計劃
- 日本-澳洲液氫供應鏈(HESC)
- 市場限制
- 歐洲缺乏吉瓦級電解的一級可再生電協議
- 美國墨西哥灣沿岸的水資源緊張限制了PEM的實施。
- 韓國現有小型模組化反應器(SMR)裝置的二氧化碳捕捉高成本
- 加勒比地區的氫氣管道標準和安全許可限制
- 供應鏈分析
- 監管環境
- 技術展望
- 波特五力分析
- 供應商的議價能力
- 買方的議價能力
- 新進入者的威脅
- 替代品的威脅
- 競爭對手之間的競爭
第5章 市場規模與成長預測
- 起源
- 灰氫
- 藍氫
- 綠氫能
- 綠松石氫
- 粉紅氫
- 透過技術
- 蒸氣甲烷重整(SMR)
- 煤炭氣化
- 熱感重整(ATR)
- 部分氧化法(POX)
- 電解(鹼性電解、質子交換膜電解 (PEM)、固體氧化物電解(SOE))
- 透過使用
- 煉油
- 化學過程(氨、甲醇)
- 鋼(直接還原鐵(DRI)、氫氣冶煉(H2-BF))
- 運輸燃料(燃料電池電動車、船舶、航空)
- 電力和儲能
- 住宅和商業供暖
- 按地區
- 北美洲
- 美國
- 加拿大
- 墨西哥
- 歐洲
- 英國
- 德國
- 法國
- 西班牙
- 北歐國家
- 土耳其
- 俄羅斯
- 其他歐洲地區
- 亞太地區
- 中國
- 印度
- 日本
- 韓國
- 東南亞國協
- 澳洲
- 亞太其他地區
- 南美洲
- 巴西
- 阿根廷
- 南美洲其他地區
- 中東和非洲
- 阿拉伯聯合大公國
- 沙烏地阿拉伯
- 埃及
- 南非
- 其他中東和非洲地區
- 北美洲
第6章 競爭情勢
- 市場集中度
- 策略性舉措(併購、夥伴關係、購電協議)
- 市場佔有率分析(主要企業的市場排名和佔有率)
- 公司簡介
- Linde plc
- Air Liquide
- Air Products & Chemicals
- Sinopec
- Engie SA
- Nel ASA
- Cummins Inc.
- ITM Power plc
- Plug Power Inc.
- Siemens Energy AG
- McPhy Energy SA
- FuelCell Energy
- Enapter AG
- Bloom Energy
- Ballard Power Systems
- Johnson Matthey PLC
- Kawasaki Heavy Industries
- Messer Group GmbH
- Taiyo Nippon Sanso Corp.
- Doosan Fuel Cell
第7章 市場機會與未來展望
The Hydrogen Generation Market was valued at USD 185.49 billion in 2025 and estimated to grow from USD 192.82 billion in 2026 to reach USD 234.06 billion by 2031, at a CAGR of 3.95% during the forecast period (2026-2031).
This expansion occurs as policy-backed demand for low-carbon molecules displaces fossil-derived supply, accelerating investment in electrolysis and carbon-capture retrofits. Regulatory mechanisms such as the European Union's Renewable Fuels of Non-Biological Origin (RFNBO) rules and the United States' Section 45V production tax credit turn voluntary decarbonization efforts into compliance obligations, giving the hydrogen generation market a predictable revenue base. Technology costs reset as renewable electricity prices fall and electrolyzer gigafactories scale while carbon-pricing regimes widen the cost gap between grey and clean molecules. Simultaneously, industrial sectors-including steel, ammonia, and methanol-lock in long-term offtake contracts that de-risk gigawatt-scale projects and diversify the hydrogen generation market beyond its historical refinery focus.
Global Hydrogen Generation Market Trends and Insights
EU RFNBO mandate igniting certified green hydrogen demand
The RFNBO framework obliges refineries, chemical plants, and steelmakers to source verified renewable hydrogen, turning green molecules into compliance commodities. The inaugural €720 million auction narrowed the cost gap between fossil-based and renewable supply, enabling final investment decisions for gigawatt-scale electrolyzer arrays. Certification rules on additionality and temporal correlation differentiate premium product grades and trigger dedicated renewable PPAs. Utilities such as EWE are installing a 280 MW electrolyzer linked to onshore wind parks, with commissioning slated for 2027. Structured offtake contracts underpin project finance and give equipment vendors multi-year order visibility.
U.S. Section 45V tax credit accelerating domestic electrolyzer build-out
Finalized in January 2025, Section 45V grants up to USD 3 per kilogram for hydrogen produced below 4 kg CO2-e/kg, instantly moving many U.S. projects into the money. The three-tier incentive rewards hourly renewable matching, fostering grid-scale storage and advanced energy-management systems. Nel ASA secured federal funding to expand its Mississippi electrolyzer plant, while Plug Power landed a 3 GW equipment order for an Australian green ammonia scheme, demonstrating the global manufacturing scale driven by U.S. policy. Ten-year credit certainty unlocks long-dated PPAs, though developers model political-change scenarios to hedge downside risk.
Scarcity of tier-1 renewable PPAs for GW electrolysis
Only a small fraction of Europe's 130 GW electrolyzer pipeline has locked financing because developers cannot secure long-duration renewable PPAs at competitive prices. Data centers, EV charging networks, and traditional industry chase the same certified power, cutting into hydrogen project margins. Germany's nationwide hydrogen trunkline tariff of €25 per kWh and the Netherlands' 4% green-use mandate further elevate PPA premiums. Unless offshore wind auctions accelerate, many projects will slip beyond 2027, compressing the short-term delivery schedule.
Other drivers and restraints analyzed in the detailed report include:
- China's coal-to-hydrogen blending policy maintaining legacy volumes
- Middle East ammonia hubs catalyzing GW-scale export projects
- Gulf-Coast water stress constraining PEM roll-outs
For complete list of drivers and restraints, kindly check the Table Of Contents.
Segment Analysis
Grey hydrogen supplied 97.21% of global demand in 2025, cementing the historical reliance on steam methane reforming and coal gasification. That dominance masks the breakout trajectory of electrolytic supply, with green volumes projected to climb at a 32.6% CAGR by 2031. This surge shifts procurement patterns as compliance-driven customers carve out renewable-only contract pools. The hydrogen generation market size for green output is expected to expand most in Europe and North America, where policy incentives offset higher levelized costs. Legacy asset owners retrofit carbon capture on select plants to secure low-carbon certificates, while project developers bundle renewable PPAs and pipeline access into long-term supply contracts.
Blue hydrogen is an interim bridge, particularly in gas-rich regions that can leverage depleted reservoirs for CO2 storage. Turquoise pathways, producing solid carbon coproducts, attract venture funding but remain pre-commercial. Pink hydrogen retains a niche among countries with high nuclear capacity and limited renewable land availability, giving utilities a baseload decarbonization option without intermittency risk. Each pathway's maturation timeline influences investment sequencing, creating optionality for diversified portfolios within the hydrogen generation market.
The Hydrogen Generation Market Report is Segmented by Source (Grey Hydrogen, Blue Hydrogen, Green Hydrogen, and Others), Technology (Steam Methane Reforming, Coal Gasification, Electrolysis, and Others), Application (Oil Refining, Chemical Processing, Iron and Steel, Transportation Fuel, Power and Energy Storage, and Others), and Geography (North America, Europe, Asia-Pacific, South America, and Middle East and Africa).
Geography Analysis
Asia-Pacific controlled 54.08% of global revenue in 2025, anchored by China's extensive coal-gasification fleet and accelerated electrolyzer uptake. Beijing's dual-track model sustains existing grey output while underwriting the world's largest dedicated hydrogen pipeline between Inner Mongolia and coastal industrial zones. India's National Green Hydrogen Mission, backed by viability-gap funding and import-duty waivers on electrolyzer stacks, positions the country as the next big growth frontier. High-solar-irradiance ASEAN nations, notably Indonesia and Malaysia, develop export-oriented ammonia corridors linked to Japanese and Korean buyers.
Europe ranks second in market size but first in policy intensity. RFNBO quotas, a €24 billion German backbone pipeline, and hydrogen-based steel ventures like HYBRIT move the region toward large-scale clean-molecule adoption. Project bottlenecks stem largely from scarce low-cost renewable PPAs, although accelerated offshore-wind auction schedules aim to unlock additional capacity. Nordic hydropower gives Scandinavian electrolyzer projects a stable, low-carbon electricity supply, lowering delivered-hydrogen costs relative to continental peers.
North America benefits from Section 45V incentives, abundant wind-solar resources, and established industrial clusters along the Gulf Coast and Midwest. Canadian carbon-pricing policies and hydro-rich provinces support export-grade clean-ammonia projects targeting Asia and Europe. Water stewardship and permitting timelines remain the key gating items for U.S. developers, especially in arid Western states. The Middle East develops GW-scale integrated hubs in Saudi Arabia, Oman, and the United Arab Emirates, using competitive renewables to ship green ammonia along existing tanker routes. Africa's nascent pipeline focuses on Namibia and Mauritania, where world-class solar resources, land availability, and EU proximity combine to attract early-stage capital.
- Linde plc
- Air Liquide
- Air Products & Chemicals
- Sinopec
- Engie SA
- Nel ASA
- Cummins Inc.
- ITM Power plc
- Plug Power Inc.
- Siemens Energy AG
- McPhy Energy SA
- FuelCell Energy
- Enapter AG
- Bloom Energy
- Ballard Power Systems
- Johnson Matthey PLC
- Kawasaki Heavy Industries
- Messer Group GmbH
- Taiyo Nippon Sanso Corp.
- Doosan Fuel Cell
Additional Benefits:
- The market estimate (ME) sheet in Excel format
- 3 months of analyst support
TABLE OF CONTENTS
1 Introduction
- 1.1 Study Assumptions & Market Definition
- 1.2 Scope of the Study
2 Research Methodology
3 Executive Summary
4 Market Landscape
- 4.1 Market Overview
- 4.2 Market Drivers
- 4.2.1 EU RFNBO Mandate Accelerating Green Hydrogen Off-take Agreements
- 4.2.2 IRA & U.S. Section 45V Tax Credits Boosting Domestic Electrolyser Build-out
- 4.2.3 China's Coal-to-Hydrogen Blending Policy Sustaining Grey & Blue Projects
- 4.2.4 Middle-East Ammonia Export Hubs Creating Demand for GW-scale Green Hydrogen
- 4.2.5 Nordic Steelmakers' HySustain Programs
- 4.2.6 Japan-Australia Liquefied Hydrogen Supply-chain (HESC)
- 4.3 Market Restraints
- 4.3.1 Scarcity of Tier-1 Renewable PPAs for GW-scale Electrolysis in Europe
- 4.3.2 U.S. Gulf-Coast Water-Stress Constraints on PEM Deployment
- 4.3.3 High CO2 Capture Costs for Existing SMR Units in South Korea
- 4.3.4 Limited Hydrogen Pipeline Codes & Safety Permits in Caribbean Islands
- 4.4 Supply-Chain Analysis
- 4.5 Regulatory Landscape
- 4.6 Technological Outlook
- 4.7 Porter's Five Forces Analysis
- 4.7.1 Bargaining Power of Suppliers
- 4.7.2 Bargaining Power of Buyers
- 4.7.3 Threat of New Entrants
- 4.7.4 Threat of Substitutes
- 4.7.5 Intensity of Competitive Rivalry
5 Market Size & Growth Forecasts
- 5.1 By Source
- 5.1.1 Grey Hydrogen
- 5.1.2 Blue Hydrogen
- 5.1.3 Green Hydrogen
- 5.1.4 Turquoise Hydrogen
- 5.1.5 Pink Hydrogen
- 5.2 By Technology
- 5.2.1 Steam Methane Reforming (SMR)
- 5.2.2 Coal Gasification
- 5.2.3 Auto-Thermal Reforming (ATR)
- 5.2.4 Partial Oxidation (POX)
- 5.2.5 Electrolysis (Alkaline Electrolysis, Proton Exchange Membrane (PEM), Solid Oxide Electrolysis (SOE))
- 5.3 By Application
- 5.3.1 Oil Refining
- 5.3.2 Chemical Processing (Ammonia, Methanol)
- 5.3.3 Iron and Steel (DRI, H2-BF)
- 5.3.4 Transportation Fuel (FCEV, Marine, Aviation)
- 5.3.5 Power and Energy Storage
- 5.3.6 Residential and Commercial Heating
- 5.4 By Geography
- 5.4.1 North America
- 5.4.1.1 United States
- 5.4.1.2 Canada
- 5.4.1.3 Mexico
- 5.4.2 Europe
- 5.4.2.1 United Kingdom
- 5.4.2.2 Germany
- 5.4.2.3 France
- 5.4.2.4 Spain
- 5.4.2.5 Nordics
- 5.4.2.6 Turkey
- 5.4.2.7 Russia
- 5.4.2.8 Rest of Europe
- 5.4.3 Asia-Pacific
- 5.4.3.1 China
- 5.4.3.2 India
- 5.4.3.3 Japan
- 5.4.3.4 South Korea
- 5.4.3.5 ASEAN Countries
- 5.4.3.6 Australia
- 5.4.3.7 Rest of Asia-Pacific
- 5.4.4 South America
- 5.4.4.1 Brazil
- 5.4.4.2 Argentina
- 5.4.4.3 Rest of South America
- 5.4.5 Middle East and Africa
- 5.4.5.1 United Arab Emirates
- 5.4.5.2 Saudi Arabia
- 5.4.5.3 Egypt
- 5.4.5.4 South Africa
- 5.4.5.5 Rest of Middle East and Africa
- 5.4.1 North America
6 Competitive Landscape
- 6.1 Market Concentration
- 6.2 Strategic Moves (M&A, Partnerships, PPAs)
- 6.3 Market Share Analysis (Market Rank/Share for key companies)
- 6.4 Company Profiles (includes Global level Overview, Market level overview, Core Segments, Financials as available, Strategic Information, Products & Services, and Recent Developments)
- 6.4.1 Linde plc
- 6.4.2 Air Liquide
- 6.4.3 Air Products & Chemicals
- 6.4.4 Sinopec
- 6.4.5 Engie SA
- 6.4.6 Nel ASA
- 6.4.7 Cummins Inc.
- 6.4.8 ITM Power plc
- 6.4.9 Plug Power Inc.
- 6.4.10 Siemens Energy AG
- 6.4.11 McPhy Energy SA
- 6.4.12 FuelCell Energy
- 6.4.13 Enapter AG
- 6.4.14 Bloom Energy
- 6.4.15 Ballard Power Systems
- 6.4.16 Johnson Matthey PLC
- 6.4.17 Kawasaki Heavy Industries
- 6.4.18 Messer Group GmbH
- 6.4.19 Taiyo Nippon Sanso Corp.
- 6.4.20 Doosan Fuel Cell
7 Market Opportunities & Future Outlook
- 7.1 White-Space & Unmet-Need Assessment
 2034年海上氫氣生產市場預測-全球生產技術、生產形式、能源來源、儲存方式、應用、最終用戶與區域分析氫燃料渦輪機市場預測至2034年-全球分析(按渦輪機類型、設計類型、容量、氫燃料成分、應用、最終用戶、通路和地區分類)
 2026年全球沼氣氫氣生產市場報告
 全球氫氣生產市場規模、佔有率、趨勢和成長分析報告(2026-2034年)
 氫氣生產市場規模、佔有率、趨勢及預測(按技術、應用、系統類型及地區分類,2026-2034年)2026年全球氫氣生產市場報告
 氫氣生產市場規模、佔有率和趨勢分析報告:按技術、系統、應用、地區和細分市場預測,2026-2033年
 蒸氣重組(SMR)市場規模、佔有率和成長分析(按原料、重整技術、終端用戶產業、營運規模和地區分類)-2026-2033年產業預測日本氫氣生產市場規模、佔有率、趨勢及預測(按技術、系統類型、應用和地區分類,2026-2034年)
 氫氣生產市場規模、佔有率及成長分析(按技術、原料、應用及地區分類)-2026-2033年產業預測