


 |
市場調查報告書
商品編碼
1910941
貨櫃航運:市場佔有率分析、產業趨勢與統計、成長預測(2026-2031)Container Shipping - Market Share Analysis, Industry Trends & Statistics, Growth Forecasts (2026 - 2031) |
||||||
※ 本網頁內容可能與最新版本有所差異。詳細情況請與我們聯繫。
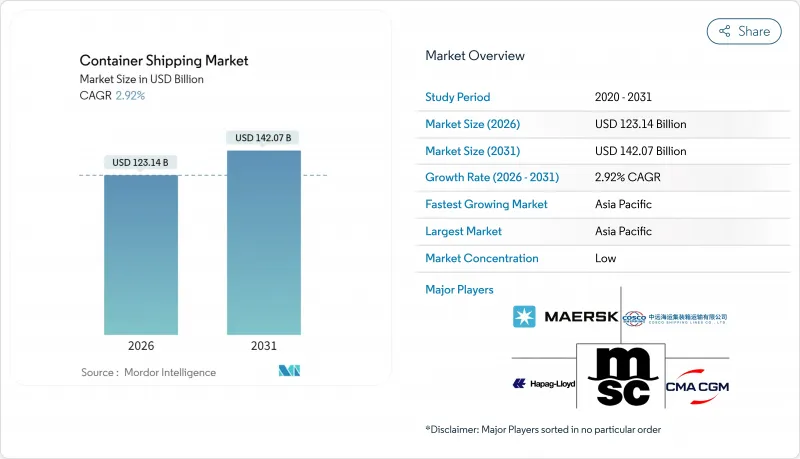
預計貨櫃航運市場將從 2025 年的 1,196.5 億美元成長到 2026 年的 1,231.4 億美元,到 2031 年將達到 1,420.7 億美元,2026 年至 2031 年的複合年成長率為 2.92%。
儘管貿易協定和電子商務正在補充潛在需求,但船隊整體成長放緩、紅海航線持續繞行以及不斷成長的監管成本正在限制供應。航運公司正致力於提升網路可靠性,組成新的聯盟,力求將準點率提升至90%或以上,同時將運力重新分配至最具韌性的航線。碼頭所有權持續擴張,以此作為對沖陸路擁擠開拓新收入來源的手段。雖然燃油成本波動仍然是影響盈利的關鍵因素,但雙燃料新船訂單和逐步提升的能源效率正在逐步降低單位排放和燃油消費量。在此背景下,隨著技術應用和環境法規遵循的改變,貨櫃航運市場正從以貨運量主導的收入結構轉型為以效率主導的收入結構。
全球貨櫃航運市場趨勢與洞察
國際貿易量增加
隨著消費支出趨於穩定和庫存補充週期恢復,全球商品貿易正在復甦,航運公司正將閒置運力重新部署到北美和地中海門戶港口。經由紅海繞行航線的延伸暫時吸收了過剩運力,在新船建造的同時維持了運費水準。港口停靠數據顯示,美國東海岸樞紐港口的吞吐量實現了兩位數的成長,這表明貨櫃航運市場具有快速調整貨物流向的柔軟性。雖然重新部署成本增加,但回程回程傳輸利用率的提高部分抵消了這種影響。永續的貿易成長仍然取決於家庭購買力和地緣政治緊張局勢正常化的速度。
擴大自由貿易協定
歐盟與南方共同市場於2024年12月簽署的協議預計將帶來560億歐元(618億美元)的額外貨物貿易,並重塑南大西洋的服務格局。已在聖塔斯港和布宜諾斯艾利斯港擁有碼頭的航運公司正在開發專用航線,以搶佔以往在加勒比地區轉運的港間貨物。同時,美國墨加協定(USMCA)的條款正在加強北美地區的近距離,墨西哥樞紐處理美國貨運量佔有率的不斷成長便是明證。更廣泛的區域化趨勢正促使船隊負責人減少對東西向長途幹線航線的依賴,轉而選擇更短、更頻繁的航線。從長遠來看,貨櫃航運市場將受益於關稅壁壘的降低和海關程序的統一,這將縮短貨物停留時間並提高服務的可預測性。
燃油價格波動
預計到2024年,超低硫燃料(VLSF)的平均價格將達到每噸630美元。航運業納入歐盟排放交易體系後,歐洲內部航運成本將增加每噸170至210美元。價格波動迫使業者透過燃料調整係數來調整運費,但這些調整往往落後於市場波動,從而降低了利潤率。液化天然氣(LNG)、甲醇和傳統燃料油之間日益擴大的價格差異,使得多燃料籌資策略更加複雜。避險可以部分緩解成本衝擊,但這需要並非所有業者都具備的高階金融知識。因此,維修能源效率和降低航速仍然是貨櫃航運市場應對成本衝擊的直接措施。
細分市場分析
到2025年,40英尺貨櫃市場將佔總收入的50.62%,鞏固其作為行業領先單元的地位,最大限度地提高船舶裝載效率,並適應鐵路和公路運輸的規格要求。隨著設備更新換代和內陸基礎設施的改善(有利於高密度貨櫃的普及),40英尺貨櫃的市場規模預計將持續擴大。電子產品和服裝托運人的強勁需求支撐了船隊的運轉率,而高密度貨櫃設計的持續生產則提高了單位裝載率。港口對雙吊裝起重機的投資也進一步鞏固了該尺寸貨櫃在營運上的優先地位。雖然20英尺貨櫃對於高密度貨物和開發中國家基礎設施受限的碼頭仍然至關重要,但隨著托運人整合貨物以降低每噸碳排放量,其相對佔有率預計將逐漸下降。 45英尺貨櫃等特殊尺寸貨櫃可滿足托盤寬度貨物的需求,但由於回程需求不足以及某些鐵路走廊的兼容性問題,其應用受到限制。
40英尺貨櫃的成長也得益於數位化貨櫃追蹤系統的普及,這些系統提高了從門到門的全程可視性,並幫助大宗零售商更有效率地進行庫存規劃。租賃公司正在加快船隊更新,以採用智慧貨櫃技術,從而提高周轉率並減少停機時間。這些因素共同作用,將使40英尺貨櫃在2031年之前繼續主導貨櫃航運市場。
到2025年,通用貨櫃將佔貨運總量的63.40%,支撐大部分消費和工業貿易流量。然而,在對溫控藥品和生鮮食品持續需求的推動下,冷藏貨櫃預計將超越標準貨櫃,年複合成長率將達到3.36%。儘管資本成本不斷上升,但隔熱性能的提升、遙測技術的整合以及低耗電量正在提高冷藏運輸服務的盈利。製藥公司正將高價值生物製藥的運輸方式從空運轉向海運,因為經過檢驗的低溫運輸運輸路線能夠在不影響產品品質的前提下降低成本。在食品供應鏈中,減少廢棄物的趨勢推動了越來越多的生鮮食品採用持續監控的高精度冷藏集裝箱進行運輸。因此,航運公司在新船設計中增加了冷藏貨櫃的安裝位置,顯示他們對持續的高階需求充滿信心。儘管通用貨櫃市場正在成熟,但它仍然是貨櫃航運市場的核心,其驅動力是專注於防盜鎖和端到端追蹤的漸進式創新,而不是根本性的設計變革。
同時,基於二氧化碳的冷凍系統也改裝,與老舊的氫氟碳化合物(HFC)冷凍系統相比,這些系統能效更高,全球暖化潛值更低。這些技術升級,加上食品和製藥行業的監管推動,預計將使冷藏集裝箱繼續保持收入成長的領先地位。
貨櫃航運市場報告按貨櫃尺寸(20英尺標準箱、40英尺大箱、其他)、貨櫃類型(普通貨物、冷藏貨物)、運輸方式(整箱運輸、拼箱運輸)、終端用戶行業(消費品及零售、製造及汽車等)和地區(北美、南美、亞太、歐洲、中東和非洲)進行細分。市場預測以美元以金額為準。
區域分析
到2025年,亞太地區將佔全球收入的40.55%,鞏固其作為貨櫃航運市場製造和出口中心的地位。中國持續近5%的GDP成長速度以及上海、寧波舟山和釜山等港口自動化進程的加速推進,支撐了該地區的艙位需求。在東協供應鏈整合和電子元件流通的推動下,亞洲內部貿易航線的班次成長最為顯著。北海航線作為亞歐之間夏季貨物運輸的替代選擇,增強了運輸的韌性,但由於破冰船短缺和地緣政治風險,其應用仍受到限制。對內陸鐵路網路和自由貿易區的持續投資支撐著該地區的強勁發展前景,預計到2031年,該地區的複合年成長率將達到4.12%。
受零售補貨和電履約需求的推動,北美2024年貨櫃進口量預計將恢復13.1%。由於西海岸勞動力市場面臨挑戰,東海岸門戶港口如薩凡納和紐約-新澤西港受益於貨主多元化經營,以及為容納更大的新巴拿馬型船舶而加深的航道。墨西哥西海岸的拉薩羅·卡德納斯港透過鐵路與美國中西部地區相連,並吸引了來自亞洲的直飛航班。長灘碼頭的維修在於打造零排放的堆場設施,以符合州政府的法規,並提升該地區貨櫃航運市場的綠色環保特性。儘管潛在的勞資談判會帶來短期波動,但陸上庫存緩衝和近岸外包的結構性趨勢將支撐中期成長。
歐洲的情況喜憂參半。鹿特丹和安特衛普-布魯日等北部樞紐在經歷了2023年的低迷之後,僅出現了小幅成長。同時,由於繞過了蘇伊士運河,地中海中轉樞紐的貨運量激增了約30%。儘管FuelEU海事和歐盟排放交易體系(ETS)框架增加了監管成本,但這仍然擴大了南歐貨櫃航運市場的規模。對港口社區系統和多式聯運鐵路走廊的投資改善了與內陸目的地的連接,但如果地中海樞紐在危機期間成為繞行路線的溢出閥,堵塞風險仍然存在。雖然與英國脫歐相關的海關摩擦已經趨於穩定,但與2021年之前的水平相比,英國門戶港口處理的直達東亞貨運量仍然較低。
其他福利:
- Excel格式的市場預測(ME)表
- 3個月的分析師支持
目錄
第1章 引言
- 研究假設和市場定義
- 調查範圍
第2章調查方法
第3章執行摘要
第4章 市場情勢
- 市場概覽
- 市場促進因素
- 國際貿易量增加
- 擴大自由貿易協定
- 電子商務的快速容器化
- 國際海事組織2023年碳排放法規推動船隊更新
- 北方海路可行性研究(北方海路)
- 基於人工智慧的路線規劃和日程管理
- 市場限制
- 燃油價格波動
- 地緣政治貿易摩擦不斷升級
- 港口周邊擁擠造成的長期瓶頸
- 對數位船岸系統的網路攻擊
- 價值/供應鏈分析
- 監管環境
- 技術展望
- 波特五力模型
- 新進入者的威脅
- 買方的議價能力
- 供應商的議價能力
- 替代品的威脅
- 競爭對手之間的競爭
- 定價分析
第5章 市場規模及成長預測(價值,十億美元)
- 按容器尺寸
- 20英尺(標準貨櫃)
- 40 英尺(FEU)
- 其他
- 按容器類型
- 一般的
- 冷藏
- 透過服務
- 整箱貨(FCL)
- 拼箱
- 按最終用戶行業分類
- 消費品和零售
- 製造業和汽車業
- 醫療和藥品
- 電子電器設備
- 工業化學品和原料
- 其他
- 按地區
- 北美洲
- 美國
- 加拿大
- 墨西哥
- 南美洲
- 巴西
- 秘魯
- 智利
- 阿根廷
- 南美洲其他地區
- 亞太地區
- 印度
- 中國
- 日本
- 澳洲
- 韓國
- 東南亞(新加坡、馬來西亞、泰國、印尼、越南、菲律賓)
- 亞太其他地區
- 歐洲
- 英國
- 德國
- 法國
- 西班牙
- 義大利
- 比荷盧經濟聯盟(比利時、荷蘭、盧森堡)
- 北歐國家(丹麥、芬蘭、冰島、挪威、瑞典)
- 其他歐洲地區
- 中東和非洲
- 阿拉伯聯合大公國
- 沙烏地阿拉伯
- 南非
- 奈及利亞
- 其他中東和非洲地區
- 北美洲
第6章 競爭情勢
- 市場集中度
- 策略趨勢
- 市佔率分析
- 公司簡介
- MSC Mediterranean Shipping Company
- AP Moller-Maersk
- CMA CGM
- COSCO Shipping Lines
- Hapag-Lloyd
- ONE(Ocean Network Express)
- Evergreen Marine
- Yang Ming
- HMM Co.
- PIL(Pacific International Lines)
- ZIM Integrated Shipping
- OOCL
- Wan Hai Lines
- Matson
- X-Press Feeders
- SITC International
- Zhonggu Logistics
- Antong Holdings
- Hyundai Merchant Marine
- IRISL Group
第7章 市場機會與未來展望
The Container Shipping Market is expected to grow from USD 119.65 billion in 2025 to USD 123.14 billion in 2026 and is forecast to reach USD 142.07 billion by 2031 at 2.92% CAGR over 2026-2031.
Slower fleet-wide speed, ongoing Red Sea diversions, and an expanded regulatory cost base are moderating supply even as trade agreements and e-commerce replenish underlying demand. Carriers are concentrating on network reliability, with new alliance formations targeting on-time performance above 90% while reallocating capacity toward the most resilient corridors. Terminal ownership continues to rise as a defensive hedge against landside congestion and as a lever to capture new revenue pools. Fuel cost volatility remains the primary profitability swing factor, yet dual-fuel newbuild orders and incremental efficiency upgrades are gradually lowering per-unit emissions and bunker consumption. Against this backdrop, the container shipping market is transitioning from rate-driven earnings to efficiency-driven returns as technology adoption and environmental compliance reshape operating models.
Global Container Shipping Market Trends and Insights
Rising Volume of International Trade
World merchandise trade is recovering on the back of stabilizing consumer spending and restocking cycles, prompting carriers to redeploy idle capacity onto North American and Mediterranean gateways. Longer voyage distances caused by Red Sea detours have temporarily absorbed excess tonnage, protecting rate integrity even as new vessels deliver. Port call data show double-digit throughput rebounds at U.S. East Coast hubs, highlighting the flexibility of the container shipping market to redirect flows quickly. Equipment repositioning costs have increased, yet higher backhaul utilization is offsetting part of the burden. The durability of trade growth remains linked to household purchasing power and to how swiftly geopolitical flashpoints normalize.
Expansion of Free-Trade Agreements
The EU-Mercosur deal, concluded in December 2024, is set to unlock EUR 56 billion (USD 61.80 billion) in additional goods trade and reshape South Atlantic services. Carriers that already control terminals in Santos and Buenos Aires are preparing dedicated loops to capture origin-destination volumes that were traditionally transshipped in the Caribbean. Simultaneously, USMCA provisions are reinforcing North American near-shoring, a trend visible in the rising share of Mexican gateways handling U.S.-bound cargo. Broader regionalization is nudging fleet planners to design shorter, high-frequency strings instead of relying solely on long-haul east-west trunk routes. Over the long term, the container shipping market benefits from lower tariff barriers as well as harmonized customs processes that reduce dwell times and enhance service predictability.
Volatile Bunker Fuel Prices
Very-Low-Sulfur Fuel Oil averaged USD 630 / t in 2024, and the inclusion of shipping in the EU Emissions Trading System has added USD 170-210 / t for intra-European voyages. Price gyrations compel carriers to adjust freight rates through bunker adjustment factors that often lag market swings, eroding margins. Wide spreads between LNG, methanol, and conventional bunkers complicate multi-fuel procurement strategies. Hedging offers partial relief but demands financial sophistication that not all operators possess. Consequently, energy efficiency retrofits and slow steaming remain immediate tools to absorb cost shocks within the container shipping market.
Other drivers and restraints analyzed in the detailed report include:
- Rapid E-commerce Containerization
- IMO 2023 Carbon Regulations Drive Fleet Renewal
- Escalating Geopolitical Trade Tensions
For complete list of drivers and restraints, kindly check the Table Of Contents.
Segment Analysis
The 40-foot segment held 50.62% of 2025 revenue, reflecting its status as the industry's workhorse unit that maximizes vessel stowage and aligns with rail and truck dimensions. The container shipping market size for 40-foot boxes is projected to grow alongside equipment replacement cycles and inland infrastructure upgrades that favor high-cube variants. Robust demand from electronics and apparel shippers reinforces fleet utilization, while sustained production of high-cube designs lifts per-unit load factors. Port-side investments in double-lift crane spreaders further cement the operational preference for this size. The 20-foot segment remains vital for dense commodities and infrastructure-limited terminals in developing economies, though its relative share is expected to edge lower as shippers consolidate loads to reduce per-tonne carbon footprints. Specialized sizes such as 45-foot units cater to pallet-wide cargo niches, yet their uptake is restricted by limited backhaul demand and compatibility gaps in certain rail corridors.
Growth in the 40-foot category is also supported by digitized container tracking, which improves door-to-door visibility and enables leaner inventory planning for high-volume retailers. Leasing companies are accelerating fleet renewal to incorporate smart-box technology, a move that enhances asset rotation and reduces idle time. Combined, these factors should keep the 40-foot segment at the core of the container shipping market through 2031.
General-purpose containers accounted for 63.40% of 2025 throughput, underpinning the bulk of consumer and industrial trade flows. However, reefer units are forecast to log a 3.36% CAGR, outpacing standard boxes on the back of sustained demand for temperature-controlled pharmaceuticals and perishables. Enhanced insulation, integrated telemetry, and lower power draw raise the profitability of refrigerated services despite higher capital costs. Pharmaceutical firms are shifting high-value biologics from air to ocean freight, lured by validated cold-chain corridors that deliver cost savings without compromising product integrity. In food supply chains, the push to cut waste is increasing the share of fresh produce shipped in high-accuracy reefers with continuous monitoring. Consequently, carriers are dedicating larger reefer plugs on newbuild designs, signaling confidence in sustained premium demand. The general-purpose segment, while mature, remains central to the container shipping market, with incremental innovation focused on theft-resistant locks and end-to-end tracking rather than on transformative design changes.
A parallel trend involves the retro-fitting of CO2-based refrigeration systems, improving energy efficiency and reducing global warming potential relative to older HFC units. These technology upgrades, combined with regulatory drivers in food and pharma, are likely to keep reefers at the forefront of revenue growth.
The Container Shipping Market Report is Segmented by Container Size (20-Foot TEU, 40-Foot FEU, Others), Container Type (General, Reefer), Service (Full-Container-Load FCL, Less-Than-Container-Load LCL), End-User Industry (FMCG & Retail, Manufacturing and Automotive, and More), and Geography (North America, South America, Asia-Pacific, Europe, Middle East and Africa). The Market Forecasts are Provided in Terms of Value USD.
Geography Analysis
Asia-Pacific commanded 40.55% of 2025 revenue, reinforcing its status as the manufacturing and export engine of the container shipping market. Chinese GDP expansion near 5% and accelerated port automation in Shanghai, Ningbo-Zhoushan, and Busan are sustaining the region's slot demand. Intra-Asian trade lanes are registering some of the highest frequency growth, propelled by ASEAN supply-chain integration and electronics component flows. The emergence of the Northern Sea Route as a summer alternative for Asia-Europe cargo offers an additional resilience layer, though uptake remains constrained by ice-class fleet scarcity and geopolitical risk. Continued investment in hinterland rail networks and free-trade zones supports a robust outlook, with the region projected to deliver a 4.12% CAGR through 2031.
North America experienced a 13.1% rebound in loaded container imports during 2024, led by retail restocking and e-commerce fulfillment demand. East Coast gateways such as Savannah and New York-New Jersey benefited from shipper diversification away from West Coast labor uncertainties and from deeper channel dredging that accommodates larger neo-Panamax vessels. Mexico's west-coast port of Lazaro Cardenas is attracting direct Asia services, offering rail connectivity into the U.S. Midwest. Long-beach terminal retrofits emphasizing zero-emission yard equipment align with state regulations and bolster the environmental credentials of the container shipping market in the region. While potential labor negotiations pose near-term volatility, the structural trend toward onshore inventory buffers and near-shoring supports medium-term growth.
Europe's picture is mixed. Northern hubs such as Rotterdam and Antwerp-Bruges posted modest gains after a soft 2023, whereas Mediterranean transshipment hubs enjoyed volume windfalls of about 30% as carriers bypassed the Suez Canal. The container shipping market size in Southern Europe therefore expanded even as regulatory costs rose under the FuelEU Maritime and ETS frameworks. Investments in port community systems and intermodal rail corridors are improving hinterland connectivity, yet congestion risk lingers when Mediterranean hubs become overflow valves during crisis reroutes. Brexit-related customs friction has stabilized, although UK gateways continue to handle lower direct Far East services than before 2021.
- MSC Mediterranean Shipping Company
- A.P. Moller - Maersk
- CMA CGM
- COSCO Shipping Lines
- Hapag-Lloyd
- ONE (Ocean Network Express)
- Evergreen Marine
- Yang Ming
- HMM Co.
- PIL (Pacific International Lines)
- ZIM Integrated Shipping
- OOCL
- Wan Hai Lines
- Matson
- X-Press Feeders
- SITC International
- Zhonggu Logistics
- Antong Holdings
- Hyundai Merchant Marine
- IRISL Group
Additional Benefits:
- The market estimate (ME) sheet in Excel format
- 3 months of analyst support
TABLE OF CONTENTS
1 Introduction
- 1.1 Study Assumptions and Market Definition
- 1.2 Scope of the Study
2 Research Methodology
3 Executive Summary
4 Market Landscape
- 4.1 Market Overview
- 4.2 Market Drivers
- 4.2.1 Rising volume of international trade
- 4.2.2 Expansion of free-trade agreements
- 4.2.3 Rapid e-commerce containerization
- 4.2.4 IMO 2023 carbon regulations drive fleet renewal
- 4.2.5 Arctic route viability (Northern Sea Route)
- 4.2.6 AI-enabled predictive routing and scheduling
- 4.3 Market Restraints
- 4.3.1 Volatile bunker fuel prices
- 4.3.2 Escalating geopolitical trade tensions
- 4.3.3 Chronic port-side congestion bottlenecks
- 4.3.4 Cyber-attacks on digital ship-to-shore systems
- 4.4 Value / Supply-Chain Analysis
- 4.5 Regulatory Landscape
- 4.6 Technological Outlook
- 4.7 Porter's Five Forces
- 4.7.1 Threat of New Entrants
- 4.7.2 Bargaining Power of Buyers
- 4.7.3 Bargaining Power of Suppliers
- 4.7.4 Threat of Substitutes
- 4.7.5 Competitive Rivalry
- 4.8 Pricing Analysis
5 Market Size and Growth Forecasts (Value, USD Bn)
- 5.1 By Container Size
- 5.1.1 20-Foot (TEU)
- 5.1.2 40-Foot (FEU)
- 5.1.3 Others
- 5.2 By Container Type
- 5.2.1 General
- 5.2.2 Reefer
- 5.3 By Service
- 5.3.1 Full-Container-Load (FCL)
- 5.3.2 Less-Than-Container-Load (LCL)
- 5.4 By End-User Industry
- 5.4.1 FMCG and Retail
- 5.4.2 Manufacturing and Automotive
- 5.4.3 Healthcare and Pharmaceuticals
- 5.4.4 Electronics and Electrical Equipment
- 5.4.5 Industrial Chemicals and Raw Materials
- 5.4.6 Others
- 5.5 By Geography
- 5.5.1 North America
- 5.5.1.1 United States
- 5.5.1.2 Canada
- 5.5.1.3 Mexico
- 5.5.2 South America
- 5.5.2.1 Brazil
- 5.5.2.2 Peru
- 5.5.2.3 Chile
- 5.5.2.4 Argentina
- 5.5.2.5 Rest of South America
- 5.5.3 Asia-Pacific
- 5.5.3.1 India
- 5.5.3.2 China
- 5.5.3.3 Japan
- 5.5.3.4 Australia
- 5.5.3.5 South Korea
- 5.5.3.6 South East Asia (Singapore, Malaysia, Thailand, Indonesia, Vietnam, and Philippines)
- 5.5.3.7 Rest of Asia-Pacific
- 5.5.4 Europe
- 5.5.4.1 United Kingdom
- 5.5.4.2 Germany
- 5.5.4.3 France
- 5.5.4.4 Spain
- 5.5.4.5 Italy
- 5.5.4.6 BENELUX (Belgium, Netherlands, and Luxembourg)
- 5.5.4.7 NORDICS (Denmark, Finland, Iceland, Norway, and Sweden)
- 5.5.4.8 Rest of Europe
- 5.5.5 Middle East and Africa
- 5.5.5.1 United Arab of Emirates
- 5.5.5.2 Saudi Arabia
- 5.5.5.3 South Africa
- 5.5.5.4 Nigeria
- 5.5.5.5 Rest of Middle East And Africa
- 5.5.1 North America
6 Competitive Landscape
- 6.1 Market Concentration
- 6.2 Strategic Moves
- 6.3 Market Share Analysis
- 6.4 Company Profiles (includes Global level Overview, Market level overview, Core Segments, Financials as available, Strategic Information, Market Rank/Share for key companies, Products and Services, and Recent Developments)
- 6.4.1 MSC Mediterranean Shipping Company
- 6.4.2 A.P. Moller - Maersk
- 6.4.3 CMA CGM
- 6.4.4 COSCO Shipping Lines
- 6.4.5 Hapag-Lloyd
- 6.4.6 ONE (Ocean Network Express)
- 6.4.7 Evergreen Marine
- 6.4.8 Yang Ming
- 6.4.9 HMM Co.
- 6.4.10 PIL (Pacific International Lines)
- 6.4.11 ZIM Integrated Shipping
- 6.4.12 OOCL
- 6.4.13 Wan Hai Lines
- 6.4.14 Matson
- 6.4.15 X-Press Feeders
- 6.4.16 SITC International
- 6.4.17 Zhonggu Logistics
- 6.4.18 Antong Holdings
- 6.4.19 Hyundai Merchant Marine
- 6.4.20 IRISL Group
7 Market Opportunities and Future Outlook
- 7.1 White-Space and Unmet-Need Assessment
 海運貨櫃市場:2026-2032年全球市場預測(按貨櫃類型、材質、尺寸、所有權、應用和最終用戶產業分類)貨物固定設備市場:2026-2032年全球市場預測(依產品、材料、應用及通路分類)
 貨櫃船市場規模、佔有率、成長及全球產業分析:按類型、應用和地區分類,並預測至2026-2034年
 海運貨櫃:市場佔有率分析、產業趨勢與統計、成長預測(2026-2031)全球智慧貨櫃市場規模、佔有率、趨勢和成長分析報告(2026-2034)全球貨櫃市場規模、佔有率、趨勢和成長分析報告(2026-2034)
 貨櫃市場報告:按產品、貨櫃尺寸、應用和地區分類(2026-2034 年)
 2026年全球貨櫃市場報告2026年全球鍋爐、儲槽和運輸貨櫃市場報告國際貨櫃運輸服務市場按貨櫃類型、服務類型、貨櫃尺寸、運輸方式、承運人類型和最終用途產業分類-全球預測(2026-2032 年)