


 |
市場調查報告書
商品編碼
1913346
2026年至2035年貨櫃市場機會、成長要素、產業趨勢分析及預測Shipping Containers Market Opportunity, Growth Drivers, Industry Trend Analysis, and Forecast 2026 - 2035 |
||||||
全球貨櫃市場預計到 2025 年價值 112 億美元,到 2035 年達到 167 億美元,年複合成長率為 4.1%。
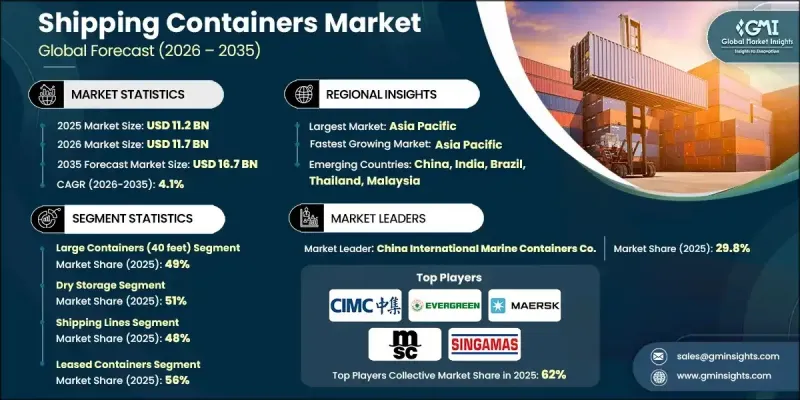
這一成長主要得益於消費品、工業產品和原物料國際貿易的持續擴張。亞洲國家強勁的製造業生產、已開發國家進口依賴度的提高以及全球供應鏈日益複雜化,都推動了貨櫃貨運量的成長。這些趨勢支撐了對新貨櫃生產、老舊船隊更新換代以及全球貨櫃租賃業務的持續需求。預計2025年全球貨櫃貿易量將保持強勁成長,增幅在3.5%至4.2%之間,將增強整個海運網路對貨櫃需求的長期信心。
| 市場覆蓋範圍 | |
|---|---|
| 開始年份 | 2025 |
| 預測年份 | 2026-2035 |
| 起始值 | 112億美元 |
| 預測金額 | 167億美元 |
| 複合年成長率 | 4.1% |
全球電子商務的快速發展顯著推動了貨櫃運輸量的成長,尤其是在大宗零售和科技產品主導方面。跨境貿易的加速發展,催生了對靈活且擴充性的物流解決方案的需求,進而推動了乾貨集裝箱和高箱集裝箱在海運、鐵路和多式聯運系統中的廣泛應用。為了因應不斷變化的貨物需求,航運公司擴大採用貨櫃租賃模式,以降低資本風險並提高營運靈活性。租賃模式能夠實現更快的船隊調整、更好的成本控制和更高的現金流效率。
預計到2025年,40英尺大型貨櫃將佔據49%的市場佔有率,並在2026年至2035年間以3%的複合年成長率成長。由於其比20英尺貨櫃更大的載貨量,這些貨櫃已成為全球標準,尤其適用於運輸大量消費品和工業品。其更大的負載容量能力有助於提高長途和多式聯運的成本效益和規模經濟效益。
預計到2025年,乾貨貨櫃市場佔有率將達到51%,並在2035年之前以3%的複合年成長率成長。這些貨櫃廣泛用於運輸普通貨物,因其耐用性、成本效益和保護貨物免受環境影響的能力而備受青睞。它們與海運、鐵路和陸路運輸的兼容性使其成為全球物流運營的重要組成部分。
預計到2025年,美國海運貨櫃市場規模將達15.1億美元。零售進口的成長和電子商務的蓬勃發展推動了市場成長,也帶動了對租賃和自有貨櫃的需求。港口基礎設施的投資和多式聯運的改善也促進了貨櫃吞吐量的成長。在國內和國際供應鏈中營運的企業正在加速採用更大容量的貨櫃,以提高物流效率、縮短運輸時間並降低整體運輸成本。
目錄
第1章調查方法
第2章執行摘要
第3章業界考察
- 生態系分析
- 供應商情況
- 利潤率
- 成本結構
- 每個階段的附加價值
- 影響價值鏈的因素
- 中斷
- 產業影響因素
- 促進要素
- 世界貿易量成長
- 電子商務與零售物流的擴張
- 人們對貨櫃租賃的需求日益成長。
- 港口和碼頭基礎設施開發
- 產業潛在風險與挑戰
- 對貿易週期高度敏感
- 鋼鐵價格和製造成本波動;
- 市場機遇
- 新興貿易走廊的成長
- 對低溫運輸和冷藏貨櫃的需求不斷成長
- 貨櫃維修和轉售市場
- 貨櫃船隊管理數位化
- 促進要素
- 成長潛力分析
- 監管環境
- 北美洲
- 美國運輸部(DOT) 標準
- 職業安全與健康管理局 (OSHA) 指南
- 美國環保署(EPA)
- 歐洲
- EN ISO 容器標準
- 歐盟海關和安全法規
- BS EN/CEN 標準
- 國家標準(UNE、DIN等)
- 亞太地區
- 中國國家標準(GB)
- 日本JIS標準要求
- 韓國KS認證
- 印度BIS標準
- 泰國工業標準協會(TISI)
- 拉丁美洲
- INMETRO(國家計量研究院)
- INTI認證(國家技術研究院)
- NOM 標準(墨西哥官方標準)
- 中東和非洲
- ESMA/阿拉伯聯合大公國合格評定計劃 (ECAS)
- 海灣合作理事會技術法規
- SABS認證
- 北美洲
- 波特五力分析
- PESTEL 分析
- 科技與創新趨勢
- 當前技術趨勢
- 新興技術
- 定價分析
- 依產品
- 按地區
- 生產統計
- 生產基地
- 消費基礎
- 出口和進口
- 成本細分分析
- 專利分析
- 永續性和環境方面
- 永續實踐
- 減少廢棄物策略
- 生產中的能源效率
- 環保舉措
- 碳足跡考量
- 貨櫃船隊趨勢及使用率分析
- 貨櫃船隊規模和運作
- 貨櫃可用性和不平衡趨勢
- 貿易週期對車隊利用率的影響
- 貨櫃租賃週期及收費系統分析
- 貨櫃生命週期及殘值分析
- 引入數位化、追蹤系統和智慧貨櫃
- 投資、資金籌措和資產支持型貨櫃模式
第4章 競爭情勢
- 介紹
- 公司市佔率分析
- 北美洲
- 歐洲
- 亞太地區
- 拉丁美洲
- 中東和非洲
- 主要市場公司的競爭分析
- 競爭定位矩陣
- 戰略展望矩陣
- 重大進展
- 併購
- 夥伴關係與合作
- 新產品發布
- 企業擴張計畫和資金籌措
第5章 2022-2035年按規模分類的市場估算與預測
- 小型貨櫃(20英尺)
- 大型貨櫃(40英尺)
- 高立方貨櫃
- 其他
第6章 依容器類型分類的市場估算與預測,2022-2035年
- 乾貨儲存
- 平板架
- 冷藏貨櫃
- 特殊用途
- 其他
第7章 按客戶分類的市場估算與預測,2022-2035年
- 貨運代理
- 航運公司
- 物流公司
- 零售商
- 製造商
第8章 依最終用途分類的市場估算與預測,2022-2035年
- 食品/飲料
- 消費品
- 衛生保健
- 工業產品
- 石油和天然氣
- 化學品
- 其他
9. 按所有權類型分類的市場估算與預測,2022-2035 年
- 租賃貨櫃
- 自有貨櫃
第10章 2022-2035年各地區市場估計與預測
- 北美洲
- 美國
- 加拿大
- 歐洲
- 德國
- 英國
- 法國
- 義大利
- 西班牙
- 北歐國家
- 俄羅斯
- 波蘭
- 羅馬尼亞
- 亞太地區
- 中國
- 印度
- 日本
- 韓國
- ANZ
- 越南
- 印尼
- 拉丁美洲
- 巴西
- 墨西哥
- 阿根廷
- 中東和非洲
- 南非
- 沙烏地阿拉伯
- 阿拉伯聯合大公國
第11章 公司簡介
- 世界公司
- CAI International
- China International Marine Containers
- CMA CGM
- COSCO Shipping Lines
- Evergreen Marine
- Hapag-Lloyd
- Maersk(AP Moller-Maersk)
- Mediterranean Shipping Company(MSC)
- Ocean Network Express(ONE)
- 區域玩家
- Beacon Intermodal Leasing
- Blue Sky Intermodal
- CARU Containers
- CXIC Group Containers
- Dong Fang International Containers
- Raffles Lease
- Sea Box
- Singamas Container
- Touax Container Solutions
- 新興企業
- Bulkhaul
- Jindo
- TLS Offshore Containers International
- W&K Container
- YMC Container Solutions
The Global Shipping Containers Market was valued at USD 11.2 billion in 2025 and is estimated to grow at a CAGR of 4.1% to reach USD 16.7 billion by 2035.
The growth is driven by sustained expansion in international trade involving consumer merchandise, industrial outputs, and raw materials. Strong manufacturing output across Asian economies, rising reliance on imports among developed nations, and the growing complexity of global supply chains are contributing to higher volumes of containerized freight. These dynamics are supporting ongoing demand for new container production, replacement of aging fleets, and increased container leasing activity worldwide. Global containerized trade volumes in 2025 demonstrated solid momentum, recording growth in the range of 3.5% to 4.2%, which reinforced long-term confidence in container demand across shipping networks.
| Market Scope | |
|---|---|
| Start Year | 2025 |
| Forecast Year | 2026-2035 |
| Start Value | $11.2 Billion |
| Forecast Value | $16.7 Billion |
| CAGR | 4.1% |
Rapid expansion of global e-commerce has significantly increased container-based transportation, particularly for high-volume retail and technology-driven goods. The acceleration of online cross-border trade has intensified the need for flexible and scalable logistics solutions, encouraging wider adoption of dry and high-cube containers across maritime, rail, and intermodal transport systems. In response to fluctuating freight demand, shipping operators are increasingly favoring container leasing models to limit capital exposure and improve operational agility. Leasing enables faster fleet adjustments, better cost control, and improved cash flow efficiency.
The large containers measuring 40 feet segment held 49% share in 2025 and is forecast to grow at a CAGR of 3% from 2026 to 2035. These containers remain the global standard due to their higher cargo capacity compared to 20-foot units, making them suitable for transporting bulk consumer and industrial shipments. Their ability to carry larger loads improves cost efficiency and supports economies of scale in long-distance and intermodal transportation.
The dry storage containers segment held 51% share in 2025 and is expected to grow at a CAGR of 3% through 2035. These containers are widely used for transporting general cargo and are favored for their durability, cost-effectiveness, and ability to protect goods from environmental exposure. Their compatibility with sea, rail, and land transport continues to make them essential to global logistics operations.
US Shipping Containers Market reached USD 1.51 billion in 2025. Growth is being fueled by higher retail imports and expanding e-commerce activity, which are increasing demand for both leased and owned containers. Investments in port infrastructure and improved intermodal connectivity are enhancing container throughput. Companies operating across domestic and international supply chains are increasingly deploying higher-capacity containers to improve logistics efficiency, shorten transit times, and reduce overall transportation costs.
Key companies operating in the Global Shipping Containers Market include Mediterranean Shipping, Maersk, CARU Containers, Evergreen Marine, Sea Box, China International Marine Containers Co, COSCO Shipping Lines, W&K Container, Singamas Container, and CMA CGM. Companies in the Global Shipping Containers Market are strengthening their competitive position through a combination of capacity optimization, fleet modernization, and expanded leasing services. Many players are investing in durable, standardized containers to support long-term fleet efficiency while addressing replacement demand. Strategic partnerships with logistics providers and port operators are being used to improve network reach and service reliability. Firms are also expanding leasing portfolios to attract cost-sensitive customers seeking flexibility.
Table of Contents
Chapter 1 Methodology
- 1.1 Research approach
- 1.2 Quality commitments
- 1.2.1 GMI AI policy & data integrity commitment
- 1.2.2 Research trail & confidence scoring
- 1.2.2.1 Research trail components
- 1.2.2.2 Scoring components
- 1.3 Data collection
- 1.3.1 Partial list of primary sources
- 1.4 Data mining sources
- 1.4.1 Paid sources
- 1.5 Base estimates and calculations
- 1.5.1 Base year calculation
- 1.6 Forecast model
- 1.7 Research transparency addendum
Chapter 2 Executive Summary
- 2.1 Industry 360° synopsis
- 2.2 Key market trends
- 2.2.1 Regional
- 2.2.2 Size
- 2.2.3 Container
- 2.2.4 Customer
- 2.2.5 End Use
- 2.2.6 Ownership
- 2.3 TAM analysis, 2026-2035
- 2.4 CXO perspectives: Strategic imperatives
- 2.4.1 Executive decision points
- 2.4.2 Critical success factors
- 2.5 Future outlook
- 2.6 Strategic recommendations
Chapter 3 Industry Insights
- 3.1 Industry ecosystem analysis
- 3.1.1 Supplier landscape
- 3.1.2 Profit margin
- 3.1.3 Cost structure
- 3.1.4 Value addition at each stage
- 3.1.5 Factor affecting the value chain
- 3.1.6 Disruptions
- 3.2 Industry impact forces
- 3.2.1 Growth drivers
- 3.2.1.1 Growth in global trade volumes
- 3.2.1.2 Expansion of e-commerce and retail logistics
- 3.2.1.3 Rising preference for container leasing
- 3.2.1.4 Infrastructure development at ports and terminals
- 3.2.2 Industry pitfalls and challenges
- 3.2.2.1 High exposure to trade cyclicality
- 3.2.2.2 Volatility in steel prices and manufacturing costs
- 3.2.3 Market opportunities
- 3.2.3.1 Growth in emerging trade corridors
- 3.2.3.2 Rising cold chain and reefer container demand
- 3.2.3.3 Container refurbishment and resale market
- 3.2.3.4 Digitalization of container fleet management
- 3.2.1 Growth drivers
- 3.3 Growth potential analysis
- 3.4 Regulatory landscape
- 3.4.1 North America
- 3.4.1.1 U.S. Department of Transportation (DOT) Standards
- 3.4.1.2 Occupational Safety and Health Administration (OSHA) Guidelines
- 3.4.1.3 U.S. Environmental Protection Agency (EPA)
- 3.4.2 Europe
- 3.4.2.1 EN ISO Container Standards
- 3.4.2.2 European Union Customs and Safety Regulations
- 3.4.2.3 BS EN / CEN Standards
- 3.4.2.4 National Standards (UNE, DIN, etc.)
- 3.4.3 Asia Pacific
- 3.4.3.1 China GB (Guobiao) Standards
- 3.4.3.2 Japan JIS Requirements
- 3.4.3.3 Korea KS Certification
- 3.4.3.4 Indian BIS Standards
- 3.4.3.5 Thai Industrial Standards Institute (TISI)
- 3.4.4 Latin America
- 3.4.4.1 INMETRO (National Institute of Metrology)
- 3.4.4.2 INTI certification (Instituto Nacional de Tecnologia Industrial)
- 3.4.4.3 NOM standards (Norma Official Mexicana)
- 3.4.5 Middle East & Africa
- 3.4.5.1 ESMA / Emirates Conformity Assessment Scheme (ECAS)
- 3.4.5.2 GCC technical regulations
- 3.4.5.3 SABS certification
- 3.4.1 North America
- 3.5 Porter's analysis
- 3.6 PESTEL analysis
- 3.7 Technology and innovation landscape
- 3.7.1 Current technological trends
- 3.7.2 Emerging technologies
- 3.8 Pricing analysis
- 3.8.1 By product
- 3.8.2 By region
- 3.9 Production statistics
- 3.9.1 Production hubs
- 3.9.2 Consumption hubs
- 3.9.3 Export and import
- 3.10 Cost breakdown analysis
- 3.11 Patent analysis
- 3.12 Sustainability and environmental aspects
- 3.12.1 Sustainable practices
- 3.12.2 Waste reduction strategies
- 3.12.3 Energy efficiency in production
- 3.12.4 Eco-friendly initiatives
- 3.12.5 Carbon footprint considerations
- 3.13 Container fleet dynamics & utilization analysis
- 3.13.1 Container fleet size and active utilization rates
- 3.13.2 Container availability and imbalance trends
- 3.13.3 Impact of trade cycles on fleet utilization
- 3.14 Container leasing cycle & rate structure analysis
- 3.15 Container lifecycle & residual value analysis
- 3.16 Digitalization, tracking & smart container adoption
- 3.17 Investment, financing & asset-backed container models
Chapter 4 Competitive Landscape, 2025
- 4.1 Introduction
- 4.2 Company market share analysis
- 4.2.1 North America
- 4.2.2 Europe
- 4.2.3 Asia Pacific
- 4.2.4 LATAM
- 4.2.5 MEA
- 4.3 Competitive analysis of major market players
- 4.4 Competitive positioning matrix
- 4.5 Strategic outlook matrix
- 4.6 Key developments
- 4.6.1 Mergers & acquisitions
- 4.6.2 Partnerships & collaborations
- 4.6.3 New product launches
- 4.6.4 Expansion plans and funding
Chapter 5 Market Estimates & Forecast, By Size, 2022 - 2035 ($Mn, Units)
- 5.1 Key trends
- 5.2 Small containers (20 feet)
- 5.3 Large containers (40 feet)
- 5.4 High cube containers
- 5.5 Others
Chapter 6 Market Estimates & Forecast, By Container, 2022 - 2035 ($Mn, Units)
- 6.1 Key trends
- 6.2 Dry storage
- 6.3 Flat rack
- 6.4 Refrigerated
- 6.5 Special purpose
- 6.6 Others
Chapter 7 Market Estimates & Forecast, By Customer, 2022 - 2035 ($Mn, Units)
- 7.1 Key trends
- 7.2 Freight forwarders
- 7.3 Shipping lines
- 7.4 Logistics companies
- 7.5 Retailers
- 7.6 Manufacturers
Chapter 8 Market Estimates & Forecast, By End Use, 2022 - 2035 ($Mn, Units)
- 8.1 Key trends
- 8.2 Food & beverages
- 8.3 Consumer goods
- 8.4 Healthcare
- 8.5 Industrial products
- 8.6 Oil & gas
- 8.7 Chemicals
- 8.8 Others
Chapter 9 Market Estimates & Forecast, By Ownership, 2022 - 2035 ($Mn, Units)
- 9.1 Key trends
- 9.2 Leased containers
- 9.3 Owned containers
Chapter 10 Market Estimates & Forecast, By Region, 2022 - 2035 ($Mn, Units)
- 10.1 Key trends
- 10.2 North America
- 10.2.1 US
- 10.2.2 Canada
- 10.3 Europe
- 10.3.1 Germany
- 10.3.2 UK
- 10.3.3 France
- 10.3.4 Italy
- 10.3.5 Spain
- 10.3.6 Nordics
- 10.3.7 Russia
- 10.3.8 Poland
- 10.3.9 Romania
- 10.4 Asia Pacific
- 10.4.1 China
- 10.4.2 India
- 10.4.3 Japan
- 10.4.4 South Korea
- 10.4.5 ANZ
- 10.4.6 Vietnam
- 10.4.7 Indonesia
- 10.5 Latin America
- 10.5.1 Brazil
- 10.5.2 Mexico
- 10.5.3 Argentina
- 10.6 MEA
- 10.6.1 South Africa
- 10.6.2 Saudi Arabia
- 10.6.3 UAE
Chapter 11 Company Profiles
- 11.1 Global companies
- 11.1.1 CAI International
- 11.1.2 China International Marine Containers
- 11.1.3 CMA CGM
- 11.1.4 COSCO Shipping Lines
- 11.1.5 Evergreen Marine
- 11.1.6 Hapag-Lloyd
- 11.1.7 Maersk (A.P. Moller-Maersk)
- 11.1.8 Mediterranean Shipping Company (MSC)
- 11.1.9 Ocean Network Express (ONE)
- 11.2 Regional players
- 11.2.1 Beacon Intermodal Leasing
- 11.2.2 Blue Sky Intermodal
- 11.2.3 CARU Containers
- 11.2.4 CXIC Group Containers
- 11.2.5 Dong Fang International Containers
- 11.2.6 Raffles Lease
- 11.2.7 Sea Box
- 11.2.8 Singamas Container
- 11.2.9 Touax Container Solutions
- 11.3 Emerging players
- 11.3.1 Bulkhaul
- 11.3.2 Jindo
- 11.3.3 TLS Offshore Containers International
- 11.3.4 W&K Container
- 11.3.5 YMC Container Solutions
 海運貨櫃市場:2026-2032年全球市場預測(按貨櫃類型、材質、尺寸、所有權、應用和最終用戶產業分類)貨物固定設備市場:2026-2032年全球市場預測(依產品、材料、應用及通路分類)
 貨櫃船市場規模、佔有率、成長及全球產業分析:按類型、應用和地區分類,並預測至2026-2034年
 海運貨櫃:市場佔有率分析、產業趨勢與統計、成長預測(2026-2031)全球智慧貨櫃市場規模、佔有率、趨勢和成長分析報告(2026-2034)全球貨櫃市場規模、佔有率、趨勢和成長分析報告(2026-2034)
 貨櫃市場報告:按產品、貨櫃尺寸、應用和地區分類(2026-2034 年)
 2026年全球貨櫃市場報告2026年全球鍋爐、儲槽和運輸貨櫃市場報告國際貨櫃運輸服務市場按貨櫃類型、服務類型、貨櫃尺寸、運輸方式、承運人類型和最終用途產業分類-全球預測(2026-2032 年)