


 |
市場調查報告書
商品編碼
1907346
共乘:市場佔有率分析、產業趨勢與統計、成長預測(2026-2031)Ridesharing - Market Share Analysis, Industry Trends & Statistics, Growth Forecasts (2026 - 2031) |
||||||
※ 本網頁內容可能與最新版本有所差異。詳細情況請與我們聯繫。
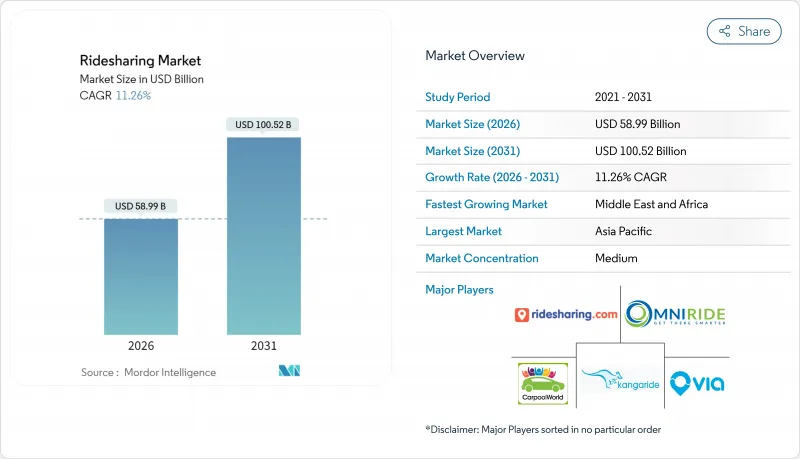
預計到 2025 年,共乘市場規模將達到 530.2 億美元,到 2026 年將達到 589.9 億美元,到 2031 年將達到 1005.2 億美元,2026 年至 2031 年的複合年成長率為 11.26%。
智慧型手機普及率的提高、5G的廣泛應用、企業永續性舉措以及擁塞收費等扶持政策正在推動市場需求。平台主導的車輛電動化正在降低每英里的成本,而超級應用則透過捆綁Scooter、自行車和公車票等服務來提高用戶留存率。競爭格局分散但日益整合,這有利於那些能夠獲得自動駕駛汽車夥伴關係和企業合約的營運商。隨著平台跨國擴張,關於員工分類和資料本地化的監管清晰度仍將是決定未來成長的關鍵因素。
全球共乘市場趨勢與洞察
整合微出行功能的超級應用的興起
平台透過擴展服務組合,在同一介面提供Scooter和自行車,從而創造網路效應,降低獲客成本並提升客戶終身價值。 Lyft 應用用戶目前可以租用Scooter和城市自行車,預計到 2024 年,其 35,000 輛自行車將完成 4,500 萬次騎行。像舊金山這樣的城市正在透過實施統一許可證來簡化合規流程,允許單一營運商運作多種交通方式。這項變更提高了使用率,尤其是在兩英里以內的短途出行中,汽車的效率較低。由於用戶使用相同應用,高利潤的汽車出行交叉銷售也隨之增加。此外,該策略還能使營運商免受各自領域監管衝擊的影響。
不斷擴大的企業永續發展需求
各公司正將共乘納入其範圍 3排放計劃,並透過以共乘取代計程車和租賃車輛來降低每位員工的碳足跡。美國主要銀行和科技公司已採取相關政策,僅報銷機場接送的共乘,導致工作日需求出現可預見的激增。專用的企業儀錶板提供碳排放追蹤、自動計費和政策管理功能,為企業共乘在預測期內實現兩位數成長創造了有利條件。穩定的企業需求緩解了季節性波動,從而提高了司機的收入,並提升了平台的企業估值倍數。
限制駕駛員數量並提高額外費用價格上限
美國各城市的最低工資法規迫使叫車平台減少駕駛人數或提高車費。明尼亞波利斯市規定,到2024年,司機每小時最低工資必須達到15美元,導致各大叫車平台暫時停止服務,以便重新調整定價模式。尖峰時段的額外費用倍數限制降低了供給彈性,導致等待時間延長,使用者滿意度下降。
細分市場分析
隨著越來越多的公司製定優先考慮低碳共乘出行的商務旅遊政策,企業客戶正在重塑全球共享旅遊市場。企業客戶在全球共享旅遊市場的市佔率穩定成長,預計到2031年將以17.85%的複合年成長率成長。企業客戶的預訂往往集中在工作日的高峰時段,因此每英里的盈利高於消費者在非高峰時段的使用。動態共乘仍將維持銷售領先地位,預計到2025年將佔總收入的45.62%,但其成長速度落後於高階企業客戶,不過動態共享出行利用了密集的都市區網路,實現了高效的乘客匹配。
大型企業重視溫室氣體減排的端到端報告和自動化費用報銷介面,這些功能在消費性產品中很少提供。企業合約通常為多年期,降低了客戶流失風險,平台也能更準確地預測司機工時和車隊電氣化需求。競爭優勢正轉向整合安全功能,例如運作行程的碳排放儀錶板和與行程負責人的即時行程共用。由於其廣泛的潛在基本客群,動態共乘在預測期內的絕對收入將持續成長,而市場佔有率的轉移表明,企業需求正在成為全球共乘市場的穩定因素。
以應用程式為中心的模式將繼續佔據主導地位,預計到2025年將佔總收入的71.84%。行動介面在推播通知、需求高峰期的票價上漲提醒以及便捷的數位錢包等方面仍然無可匹敵,這些都構成了全球叫車市場用戶參與的基礎。然而,混合型網頁和應用程式服務將以15.05%的複合年成長率成長,因為企業差旅部門和無障礙法規要求使用基於瀏覽器的預訂方式。
整合管道將服務範圍擴展至非智慧型手機用戶,並在網路連線不穩定時提供冗餘備份。內建於應用程式中的客戶服務人工智慧已將 Lyft 的問題解決時間縮短了 87%,負責人能夠專注於處理複雜案例。同時,入口網站支援活動和會議的大量預訂,而行動應用程式尚不具備此功能。隨著全通路存取成為必需,一個能夠跨裝置簡化程式碼庫的平台可以降低維護成本、加快功能發布速度,並增強 Lyft 在全球共乘市場的品牌偏好。
區域分析
2025年,亞太地區將佔據全球叫車市場37.48%的佔有率,主要得益於該地區人口密度高、私家車擁有率低以及政府對共用出行的政策支持。滴滴出行2025年第一季營收成長8.5%,凸顯了其在中國監管改革後的韌性。在印度,Ola在需求激增的情況下,將2023會計年度的虧損減少了65%,實現了永續盈利。 5G的高普及率和數位錢包的廣泛使用,使得平台能夠添加更先進的安全和忠誠度功能,從而增強從大都會圈到區域城市的網路效應。
非洲的成長速度最快,複合年成長率高達16.55%,主要得益於都市區進程和行動支付的普及。 Bolt計劃在非洲大陸投資5億歐元,凸顯了該地區對全球營運商的戰略重視。內羅畢、拉各斯和約翰尼斯堡是最早受益的城市,其年輕的人口結構推動了行動支付的快速普及。然而,道路基礎設施和電力供應的不穩定性給營運帶來了挑戰,平台透過社區司機援助中心和線下預訂終端來應對這些挑戰。
北美和歐洲是成熟的市場,在技術創新和企業專案的推動下,正經歷穩定成長。 Uber和Waymo的合作在亞特蘭大和奧斯丁推出了每週25萬次的自動駕駛出行服務,這標誌著在降低駕駛人成本方面邁出了突破性的一步。歐盟平台工作者指令計畫於2026年12月生效,該指令將要求福利標準化,並提高小規模應用程式營運商的合規門檻。產業整合正在加速,Lyft收購FREENOW便是例證,此次收購使其業務版圖擴展至歐洲九個市場。監管環境的明朗化和較高的可支配收入支撐著這兩個地區持續(但緩慢)的用戶成長,鞏固了叫車在全球叫車市場的核心收入來源地位。
其他福利:
- Excel格式的市場預測(ME)表
- 分析師支持(3個月)
目錄
第1章 引言
- 研究假設和市場定義
- 調查範圍
第2章調查方法
第3章執行摘要
第4章 市場洞察
- 市場概覽
- 產業吸引力-波特五力分析
- 供應商的議價能力
- 消費者議價能力
- 新進入者的威脅
- 替代品的威脅
- 競爭對手之間的競爭
- 產業價值鏈分析
- 宏觀經濟趨勢如何影響市場
- 技術進步
第5章 市場動態
- 市場促進因素
- 成本優勢與共乘服務/企業共乘服務日益普及
- 政府在主要市場的獎勵和退稅
- 車輛擁有成本增加和環境效益
- 市場挑戰
- 最後一公里連接問題、產業的動態特性以及叫車供應商的崛起,都為現有企業帶來了挑戰。
- 市場機遇
- 汽車共享監管參數
- 商業/收入模式用例
第6章 市場細分
- 依會員類型
- 固定共乘市場
- 動態共乘市場
- 企業共乘市場
- 按服務類型
- 基於網路的
- 基於應用程式
- 基於網頁和應用程式
- 按地區
- 北美洲
- 歐洲
- 亞洲
- 澳洲和紐西蘭
- 拉丁美洲
- 中東和非洲
第7章 競爭情勢
- 公司簡介
- OmniRide(Potomac and Rappahannock Transportation Commission)
- Kangaride
- Plante Covoiturage Inc./CarpoolWorld Inc.
- Via Transportation Inc.
- Ridesharing.com(COVOITURAGEMONTREAL Inc.)
- Scoop Commute Inc.(Spacer Technologies)
- BlaBlaCar(Comuto SA)
- KINTO Join Limited(TOYOTA MOTOR CORPORATION)
- GoMore ApS
- Hitch Technologies Inc.
- Liftshare(Mobilityways Limited)
- gobyRIDE(RideShark Corporation)
- Sameride LLC
- Carma Technology Corporation
- Enterprise Holdings Inc.
- 共享出行商業模式中的供應商市場定位
第8章 投資分析
第9章:未來市場展望
The ridesharing market is expected to grow from USD 53.02 billion in 2025 to USD 58.99 billion in 2026 and is forecast to reach USD 100.52 billion by 2031 at 11.26% CAGR over 2026-2031.
Rising smartphone adoption, the spread of 5G, corporate sustainability mandates, and supportive policy measures such as congestion pricing are reinforcing demand. Platform-led electrification of driver fleets is lowering per-mile economics while super-apps bundle scooters, bikes, and transit tickets to lift user retention. Fragmented but consolidating competitive dynamics favour operators that secure autonomous-vehicle partnerships and enterprise contracts. Regulatory clarity on worker classification and data localization will remain a decisive growth moderator as platforms scale across borders.
Global Ridesharing Market Trends and Insights
Rise of Super-Apps Integrating Micromobility
Platforms are widening their service mix to include scooters and bikes within the same interface, creating network effects that cut customer-acquisition costs and lengthen lifetime value. Lyft's app users can now rent scooters and Citi Bikes, completing 45 million rides across 35,000 bikes in 2024. Cities such as San Francisco have rolled out unified permits that let one operator serve multiple modes, simplifying compliance. The shift boosts trip frequency, especially for journeys under two miles, where cars are less efficient. Because users stay inside a single app, cross-selling rates on higher-margin car trips improve. The strategy also buffers operators against regulatory shocks in any one segment.
Growing Corporate Sustainability Mandates
Enterprises are embedding ridesharing into Scope-3 emission plans, replacing taxis and rental cars with pooled trips that cut per-employee carbon footprints. Large U.S. banks and tech firms now reimburse only shared rides for airport transfers, creating predictable weekday demand spikes. Dedicated business dashboards offer carbon tracking, automated billing, and policy controls, positioning corporate ridesharing well for double-digit expansion over the forecast period. Steady enterprise volumes cushion seasonality, improve driver earnings, and raise platform valuation multiples.
Increasing Regulatory Caps on Drivers and Surge Pricing
Minimum-wage ordinances in U.S. cities are pushing platforms to trim driver pools or raise fares. Minneapolis mandated USD 15 per driver hour in 2024, triggering temporary ride suspensions by leading platforms while they recalibrated pricing models. Restrictions on surge multipliers dampen supply elasticity during peak demand, elongating wait times and eroding user satisfaction.
Other drivers and restraints analyzed in the detailed report include:
- Urban Congestion Pricing and Curbside Reform
- High Smartphone and 5G Penetration in Emerging Economies
- Safety-Related Brand Perception Issues
For complete list of drivers and restraints, kindly check the Table Of Contents.
Segment Analysis
Corporate customers are reshaping the global ridesharing market as firms formalize travel policies that prioritize low-carbon, pooled mobility. The corporate segment is on an 17.85% CAGR path to 2031, steadily enlarging its slice of the global ridesharing market size. Enterprise bookings often occur during business-day peaks, yielding higher per-mile yields than consumer off-peak trips. Dynamic ridesharing, still the volume leader with 45.62% of 2025 revenue, benefits from dense urban networks that match riders efficiently, but its growth rate now lags the premium corporate tier.
Large companies value end-to-end reporting of greenhouse-gas savings and automatic expensing interfaces, capabilities that consumer-focused products rarely offer. As corporate contracts typically run multi-year, churn risk is lower, allowing platforms to forecast driver hours and fleet electrification needs with greater accuracy. Competitive differentiation pivots on integrating ride-level carbon dashboards and duty-of-care features like real-time itinerary sharing with travel managers. Over the forecast period, dynamic ridesharing will keep enlarging absolute revenue given its broad addressable base, yet the share shift underscores how enterprise demand is becoming a stabilizing anchor for the global ridesharing market.
App-centric models continue to dominate, capturing 71.84% of 2025 turnover. The mobile interface remains unrivalled for push notifications, surge alerts, and digital-wallet convenience, anchoring user engagement in the global ridesharing market. Nonetheless, hybrid web-plus-app services are expanding fastest at 15.05% CAGR because corporate travel desks and accessibility regulations require browser-based booking.
Integrated channels broaden reach to non-smartphone users and offer redundancy when cellular data is spotty. Customer-service AI embedded in apps cut resolution times by 87% for Lyft, freeing agents for complex cases. Web portals, meanwhile, allow batch booking for events and conferences, a capability mobile apps lack. As omnichannel access becomes table stakes, platforms that streamline code bases across devices will curb maintenance costs and speed feature deployment, reinforcing brand preference in the global ridesharing market.
The Global Ridesharing Market Report is Segmented by Membership Type (Fixed, Dynamic, Corporate), Service Type (Web-Based, App-Based, Web and App-Based), Vehicle Type (ICE Vehicle, Hybrid Vehicle, Electric Vehicle, Micro-Mobility), Trip Distance (Intracity, Intercity), Payment Mode (Cash, Card, Digital Wallets), and Geography. The Market Forecasts are Provided in Terms of Value (USD).
Geography Analysis
Asia-Pacific's 37.48% share anchored the global ridesharing market in 2025, supported by population density, low car ownership, and policymaker support for shared mobility. DiDi's Q1 2025 rebound, with revenue up 8.5%, affirmed post-regulation resilience in China. India followed with Ola trimming FY23 losses by 65%, achieving sustainable profitability amid surging demand. High 5G penetration and digital-wallet ubiquity enable platforms to overlay advanced safety and loyalty features, strengthening network effects across megacities and Tier-2 towns.
Africa posted the fastest trajectory, projected at 16.55% CAGR, propelled by urban migration and mobile-money ubiquity. Bolt's commitment to invest EUR 500 million across the continent underscores the region's strategic priority for global operators. Nairobi, Lagos, and Johannesburg are early beneficiaries, with young demographics fostering rapid uptake. Nonetheless, inconsistent road infrastructure and electricity reliability pose operational challenges that platforms address through localized driver-support hubs and offline booking kiosks.
North America and Europe display mature yet incremental growth driven by technological upgrades and corporate programs. Uber's tie-up with Waymo began offering 250,000 weekly autonomous rides in Atlanta and Austin, a milestone that trims driver-cost overheads. The EU's Platform Worker Directive, effective December 2026, will standardize benefits, elevating compliance barriers for smaller apps. Consolidation is intensifying, exemplified by Lyft's purchase of FREENOW that enlarged its European reach to nine markets. Regulatory certainty plus high disposable incomes underpins sustained, if moderate, volume expansion in both regions, keeping them pivotal revenue pools within the global ridesharing market.
- OmniRide (Potomac and Rappahannock Transportation Commission)
- Kangaride
- Plante Covoiturage Inc./CarpoolWorld Inc.
- Via Transportation Inc.
- Ridesharing.com (COVOITURAGEMONTREAL Inc.)
- Scoop Commute Inc. (Spacer Technologies)
- BlaBlaCar (Comuto SA)
- KINTO Join Limited (TOYOTA MOTOR CORPORATION)
- GoMore ApS
- Hitch Technologies Inc.
- Liftshare (Mobilityways Limited)
- gobyRIDE (RideShark Corporation)
- Sameride LLC
- Carma Technology Corporation
- Enterprise Holdings Inc.
Additional Benefits:
- The market estimate (ME) sheet in Excel format
- 3 months of analyst support
TABLE OF CONTENTS
1 INTRODUCTION
- 1.1 Study Assumptions and Market Definition
- 1.2 Scope of the Study
2 RESEARCH METHODOLOGY
3 EXECUTIVE SUMMARY
4 MARKET INSIGHTS
- 4.1 Market Overview
- 4.2 Industry Attractiveness - Porter's Five Forces Analysis
- 4.2.1 Bargaining Power of Suppliers
- 4.2.2 Bargaining Power of Consumers
- 4.2.3 Threat of New Entrants
- 4.2.4 Threat of Substitute Products
- 4.2.5 Intensity of Competitive Rivalry
- 4.3 Industry Value Chain Analysis
- 4.4 Impact of Macroeconomic Trends on the Market
- 4.5 Technological Developments
5 MARKET DYNAMICS
- 5.1 Market Drivers
- 5.1.1 Cost Advantage and Increasing Availability of Carpooling/Corporate Pooling Services
- 5.1.2 Incentives and Rebates Provided by Governments in Major Markets
- 5.1.3 Increasing Cost of Vehicle Ownership and Environmental Benefits
- 5.2 Market Challenges
- 5.2.1 Last-mile Connectivity Concerns and Dynamic Nature of the Industry and Increasing Number of Ride Hailing Vendors Poses a Challenge for Existing Operators
- 5.3 Market Opportunties
- 5.4 Parameters for Car-sharing Regulation
- 5.5 Business/Revenue Model Use Cases
6 MARKET SEGMENTATION
- 6.1 By Membership Type
- 6.1.1 Fixed Ridesharing
- 6.1.2 Dynamic Ridesharing
- 6.1.3 Corporate Ridesharing
- 6.2 By Service Type
- 6.2.1 Web-Based
- 6.2.2 App-Based
- 6.2.3 Web and App Based
- 6.3 By Geography
- 6.3.1 North America
- 6.3.2 Europe
- 6.3.3 Asia
- 6.3.4 Australia and New Zealand
- 6.3.5 Latin America
- 6.3.6 Middle East and Africa
7 COMPETITIVE LANDSCAPE
- 7.1 Company Profiles
- 7.1.1 OmniRide (Potomac and Rappahannock Transportation Commission)
- 7.1.2 Kangaride
- 7.1.3 Plante Covoiturage Inc./CarpoolWorld Inc.
- 7.1.4 Via Transportation Inc.
- 7.1.5 Ridesharing.com (COVOITURAGEMONTREAL Inc.)
- 7.1.6 Scoop Commute Inc. (Spacer Technologies)
- 7.1.7 BlaBlaCar (Comuto SA)
- 7.1.8 KINTO Join Limited (TOYOTA MOTOR CORPORATION)
- 7.1.9 GoMore ApS
- 7.1.10 Hitch Technologies Inc.
- 7.1.11 Liftshare (Mobilityways Limited)
- 7.1.12 gobyRIDE (RideShark Corporation)
- 7.1.13 Sameride LLC
- 7.1.14 Carma Technology Corporation
- 7.1.15 Enterprise Holdings Inc.
- 7.2 Market Positioning of Vendors in Ridesharing Business Models
8 INVESTMENT ANALYSIS
9 FUTURE OF THE MARKET
 共享旅遊市場:2026-2032年全球市場預測(按服務類型、平台類型、營運模式、車輛類型、車輛所有權和最終用戶分類)
 共享旅遊市場報告:按服務類型、預訂方式、會員類型、旅遊目的和地區分類(2026-2034 年)
 社群共享旅遊市場預測—全球服務類型、經營模式、會員類型、平台類型、資料與服務層、最終用戶與地區分析—2034年
 2026年全球共享旅遊市場報告
 共享出行市場規模、佔有率、成長及全球產業分析:按類型、應用和地區分類的洞察,2026-2034 年預測2026-2034年全球共乘市場規模、佔有率、趨勢和成長分析報告社區共享共乘市場預測至2032年:按服務類型、車輛類型、平台類型、支付方式、最終用戶和地區分類的全球分析
 自動駕駛共享出行服務市場機會、成長促進因素、產業趨勢分析及預測(2025-2034年)
 共乘:全球市場佔有率和排名、總收入和需求預測(2025-2031 年)2025年共享旅遊保險全球市場報告