


 |
市場調查報告書
商品編碼
1892714
自動駕駛共享出行服務市場機會、成長促進因素、產業趨勢分析及預測(2025-2034年)Autonomous Ride-Sharing Services Market Opportunity, Growth Drivers, Industry Trend Analysis, and Forecast 2025 - 2034 |
||||||
2024 年全球自動駕駛共享旅遊服務市場價值為 32 億美元,預計到 2034 年將以 26.6% 的複合年成長率成長至 326 億美元。
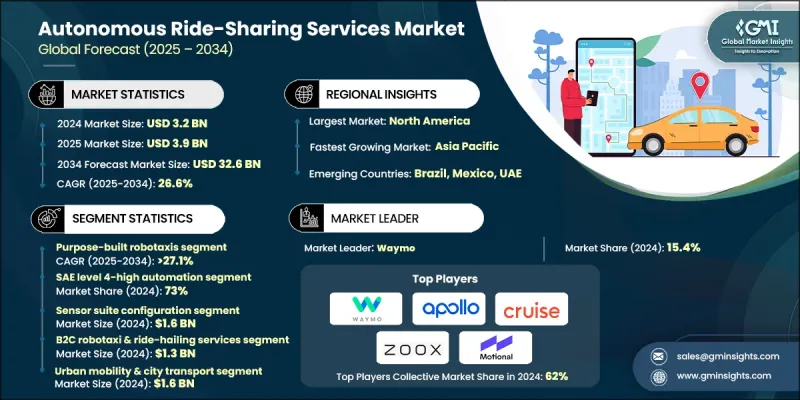
快速發展的自動駕駛系統創新、日益成長的經濟型城市出行需求以及對智慧交通網路投資的不斷擴大,共同推動了自動駕駛共享出行平台的普及。隨著城市致力於緩解交通壓力、減少排放並提高出行效率,自動駕駛共享出行平台正成為未來交通運輸中可擴展的支柱。人工智慧感知、先進的自動化功能、連網感測器、高速網路和即時車隊智慧的融合,正在重塑自動駕駛車隊的運作方式。這些技術支援精準操控、預測路線規劃、碰撞規避決策流程以及對車輛性能的持續監控。透過自適應學習模型、路線模擬環境和雲端協調的車隊工具,營運商能夠提升安全性、減少營運中斷,並提供更快捷、更可靠的按需出行服務。自動駕駛共享出行平台、協調的車隊管理系統、整合式出行即服務框架和自動調度技術的擴展,也加速了其應用。這些解決方案簡化了用戶註冊流程,支援響應式定價,增強了與道路基礎設施的通訊,並實現了多種出行方式之間的更順暢協調。出行服務提供者、技術開發商和交通運輸機構之間的合作,正在進一步推動共享和私人出行環境中的自動駕駛出行。
| 市場範圍 | |
|---|---|
| 起始年份 | 2024 |
| 預測年份 | 2025-2034 |
| 起始值 | 32億美元 |
| 預測值 | 326億美元 |
| 複合年成長率 | 26.6% |
2024年,專用無人駕駛計程車市佔率達到48%,預計到2034年將以27.1%的年成長率持續成長。該細分市場之所以佔據領先地位,是因為其車輛專為自動駕駛而設計,配備了高冗餘度的感測系統、最佳化的共享內裝以及高效的電力基礎。這些車輛能夠實現更低的營運成本、更高的利用率和可擴展的部署,從而鞏固了其在各大都會地區的市場主導地位。
2024年,SAE 4級高自動化系統市佔率達到73%,預計2025年至2034年間將以26.2%的年成長率成長。這個類別之所以佔據領先地位,是因為它支援在預定義運行區域內實現完全自主運行,從而在結構化環境中建立可靠的商用車隊。營運商擴大選擇4級系統,原因在於其性能穩定、對人工監控的依賴性降低以及與現有行動基礎設施的兼容性。
美國自動駕駛共享旅遊服務市場佔88%的佔有率,預計2024年市場規模將達到11億美元。該地區的強勁地位得益於其強大的數位化能力、高度發展的出行生態系統以及對自動駕駛技術的早期應用。有利的監管環境、廣泛的測試項目以及對大規模車隊部署的大量投資,使北美成為全球領先者,而用戶對更安全、更清潔、更高效的出行方式日益成長的需求,進一步鞏固了北美在該領域的領先地位。
目錄
第1章:方法論與範圍
第2章:執行概要
第3章:行業洞察
- 產業生態系分析
- 供應商格局
- 利潤率
- 成本結構
- 每個階段的價值增加
- 影響價值鏈的因素
- 中斷
- 產業影響因素
- 成長促進因素
- 自動駕駛技術的快速發展
- 對經濟高效的城市交通的需求日益成長
- 政府大力推動智慧交通和低排放出行
- 科技巨頭和出行業者的投資不斷增加
- 產業陷阱與挑戰
- 自動駕駛車隊部署成本高
- 監管和安全方面的不確定性
- 市場機遇
- 拓展至智慧城市與旅遊即服務(MaaS)領域
- 採用電動自動駕駛車隊
- 企業、校園與封閉迴路境的流動性
- 技術進步與人工智慧融合
- 成長促進因素
- 成長潛力分析
- 監管環境
- 聯邦法規(NHTSA、FMCSA、FTA 指南)
- 州級許可和測試要求
- 地方法規(路邊管理、地理圍籬、營業時間)
- ADA合規性和無障礙要求
- 安全標準與自願性自我評估
- 責任與保險框架
- 資料隱私和網路安全法規
- 國際監管協調
- 波特的分析
- PESTEL 分析
- 技術與創新格局
- 感測器技術演進(LiDAR、雷達、攝影機、融合)
- 感知與定位演算法
- 運動規劃與控制系統
- 高清地圖和無地圖導航方法
- V2 X 通訊與協作自動化
- 遠端操作和遙操作系統
- 網路安全與資料隱私技術
- 無障礙車輛設計及自動化安全系統
- 價格趨勢
- 按地區
- 依產品
- 成本細分分析
- 專利分析
- 永續性和環境方面
- 永續實踐
- 減少廢棄物策略
- 生產中的能源效率
- 環保舉措
- 最佳情況
- 專利與智慧財產權分析
- 按技術領域分類的專利申請趨勢
- 主要專利持有者(Waymo、Cruise、Zoox、Motional、Aurora)
- 感測器融合與知覺專利格局
- 運動規劃與控制專利集群
- 高清地圖和定位 IP
- 專利訴訟與許可動態
- 投資與融資分析
- 創投與私募股權投資趨勢
- 企業策略投資
- 聯邦撥款項目
- 公開市集活動
- 開發階段的資金
- 投資的地理分佈
- 運行設計域(ODD)分析
- 地理 ODD 限制(地理圍欄、城市覆蓋範圍)
- 道路類型 ODD(城市幹道、高速公路、住宅街道)
- 速度範圍 ODD
- 天氣與環境異常
- ODD 擴展策略及時間表
- 無障礙設計與通用設計實施標準
- ADA對自動駕駛共享出行的合規要求
- 無障礙車輛設計要求
- 無障礙人機介面
- 尋路與導航輔助
- 聯邦無障礙研究與資助
- 自動駕駛車輛的通用設計原則
- 合規性監控與執行
- 遠端操作與遠端操作基礎設施分析
- 遠端運維架構及用例
- 遠端操作與遠端協助的區別
- 美國國家公路交通安全管理局 (NHTSA) 對遠端操作安全性的研究
- 網路基礎設施需求
- 遠端營運中心設計
- 遠端操作的監管要求
- 經濟因素
- 基礎設施依賴性和生態系統準備度評估
- 道路基礎設施需求
- 車路通訊(V2I)
- 電動自動駕駛車隊的充電基礎設施
- 高清地圖基礎設施及維護
- 路邊空間管理與上下客區
- 電信基礎設施
- 生態系準備度評估框架
第4章:競爭格局
- 介紹
- 公司市佔率分析
- 北美洲
- 歐洲
- 亞太地區
- 拉丁美洲
- 中東和非洲
- 主要市場參與者的競爭分析
- 競爭定位矩陣
- 戰略展望矩陣
- 關鍵進展
- 併購
- 合作夥伴關係與合作
- 新產品發布
- 擴張計劃和資金
第5章:市場估算與預測:依自動化程度分類,2021-2034年
- SAE 4級-高度自動化
- SAE 5級-全自動
第6章:市場估計與預測:依技術平台分類,2021-2034年
- 感測器套件配置
- LiDAR-主系統
- 雷達演進系統
- 多模態感測器融合
- 運算架構
- 連接類型
- 地圖繪製與定位方法
第7章:市場估算與預測:依服務模式分類,2021-2034年
- B2C 機器人計程車與叫車服務
- B2B 企業及校園接駁車服務
- B2G市政與交通綜合服務
- 機場及專用通道接駁車
第8章:市場估算與預測:依車輛類型分類,2021-2034年
- 專用無人計程車
- 乘用車和轎車
- 廂型車和多用途車輛
- 低速自動穿梭巴士
- 全尺寸公車(40英尺以上)
第9章:市場估計與預測:依應用領域分類,2021-2034年
- 城市交通與城市交通
- 首末公里交通連接
- 校園及封閉迴路境交通
- 農村和低度開發地區的流動性
- 輔助客運與無障礙服務
第10章:市場估計與預測:依地區分類,2021-2034年
- 北美洲
- 美國
- 加拿大
- 歐洲
- 英國
- 德國
- 法國
- 義大利
- 西班牙
- 比利時
- 荷蘭
- 瑞典
- 亞太地區
- 中國
- 印度
- 日本
- 澳洲
- 新加坡
- 韓國
- 越南
- 印尼
- 拉丁美洲
- 巴西
- 墨西哥
- 阿根廷
- MEA
- 阿拉伯聯合大公國
- 南非
- 沙烏地阿拉伯
第11章:公司簡介
- Global Player
- Cruise LLC
- Geely/Zeekr
- General Motors
- Hyundai Motor Group
- Jaguar Land Rover
- Motional
- Toyota Motor Corporation
- Volkswagen Group
- Waymo LLC
- Zoox Inc.
- Regional Player
- Alphabet Inc.
- Amazon
- Aptiv PLC
- Continental AG
- EasyMile
- Intel/Mobileye
- May Mobility
- New Flyer
- NVIDIA Corporation
- Qualcomm
- 新興參與者
- Aurora Innovation
- Beep Inc.
- Innoviz Technologies
- Luminar Technologies
- Perrone Robotics
The Global Autonomous Ride-Sharing Services Market was valued at USD 3.2 billion in 2024 and is estimated to grow at a CAGR of 26.6% to reach USD 32.6 billion by 2034.
Growth is fueled by fast-moving innovation in autonomous driving systems, increasing demand for affordable urban travel options, and expanding investment in intelligent transportation networks. As cities work toward reducing traffic pressure, cutting emissions, and improving mobility efficiency, autonomous ride-sharing platforms are becoming a scalable pillar of future transportation. The fusion of AI-based perception, advanced automation features, connected sensors, high-speed networks, and real-time fleet intelligence is reshaping how self-driving fleets function. These technologies support accurate maneuvering, predictive routing, collision-avoidance decision processes, and continuous monitoring of vehicle performance. Through adaptive learning models, route simulation environments, and cloud-coordinated fleet tools, operators improve safety outcomes, reduce operational disruptions, and deliver quicker and more dependable mobility on demand. Adoption is also gaining momentum with the expansion of autonomous ride-service platforms, orchestrated fleet management systems, integrated mobility-as-a-service frameworks, and automated dispatch technologies. These solutions streamline user onboarding, support responsive pricing, enhance communication with roadway infrastructure, and enable smoother coordination across multiple modes of travel. Collaboration among mobility providers, technology developers, and transportation agencies is further advancing autonomous mobility in both shared and private travel settings.
| Market Scope | |
|---|---|
| Start Year | 2024 |
| Forecast Year | 2025-2034 |
| Start Value | $3.2 Billion |
| Forecast Value | $32.6 Billion |
| CAGR | 26.6% |
The purpose-built robotaxis category held a 48% share in 2024 and is projected to grow at a 27.1% through 2034. This segment leads due to vehicles designed specifically for autonomous operation, engineered with high-redundancy sensing, optimized interiors for shared use, and efficient electric foundations. Their ability to achieve lower operating costs, higher utilization, and scalable deployment has reinforced their dominance across major metropolitan areas.
The SAE Level 4-High Automation segment accounted for a 73% share in 2024 and is set to grow at 26.2% from 2025 to 2034. This category leads because it supports fully autonomous service within predefined operating zones, enabling dependable commercial fleets across structured environments. Operators increasingly choose Level 4 systems due to their consistent performance, reduced reliance on human monitors, and compatibility with existing mobility infrastructure.
US Autonomous Ride-Sharing Services Market held an 88% share, generating USD 1.1 billion in 2024. The region's strong position reflects robust digital capabilities, a highly developed mobility ecosystem, and early adoption of autonomous technologies. Supportive regulatory pathways, extensive testing programs, and significant investment in large-scale fleet rollout have positioned North America as a global leader, strengthened by rising user interest in safer, cleaner, and more efficient mobility options.
Major companies active in the Autonomous Ride-Sharing Services Market include Hyundai Motor Group, Zoox, Cruise, Waymo, Baidu Apollo, Motional, General Motors, AutoX, Pony.ai, and Jaguar Land Rover. Companies in the Autonomous Ride-Sharing Services Market are enhancing their market foothold by accelerating development of autonomous driving stacks, investing in scalable electric fleet platforms, and expanding AI-based operational intelligence. Many firms focus on forming alliances with automakers, software developers, and mobility partners to secure technology integration and broaden deployment opportunities. Continuous testing across controlled environments helps improve system reliability and regulatory acceptance.
Table of Contents
Chapter 1 Methodology & Scope
- 1.1 Market scope and definition
- 1.2 Research design
- 1.2.1 Research approach
- 1.2.2 Data collection methods
- 1.3 Data mining sources
- 1.3.1 Global
- 1.3.2 Regional/Country
- 1.4 Base estimates and calculations
- 1.4.1 Base year calculation
- 1.4.2 Key trends for market estimation
- 1.5 Primary research and validation
- 1.5.1 Primary sources
- 1.6 Forecast
- 1.7 Research assumptions and limitations
Chapter 2 Executive Summary
- 2.1 Industry 3600 synopsis, 2021 - 2034
- 2.2 Key market trends
- 2.2.1 Regional
- 2.2.2 Automation level
- 2.2.3 Technology platform
- 2.2.4 Service model
- 2.2.5 Vehicle
- 2.2.6 Application
- 2.3 TAM Analysis, 2025-2034
- 2.4 CXO perspectives: Strategic imperatives
- 2.4.1 Executive decision points
- 2.4.2 Critical success factors
- 2.5 Future outlook and strategic recommendations
Chapter 3 Industry Insights
- 3.1 Industry ecosystem analysis
- 3.1.1 Supplier Landscape
- 3.1.2 Profit Margin
- 3.1.3 Cost structure
- 3.1.4 Value addition at each stage
- 3.1.5 Factor affecting the value chain
- 3.1.6 Disruptions
- 3.2 Industry impact forces
- 3.2.1 Growth drivers
- 3.2.1.1 Rapid advancements in autonomous driving technologies
- 3.2.1.2 Rising demand for cost-efficient urban mobility
- 3.2.1.3 Government push for smart transportation & low-emission mobility
- 3.2.1.4 Increasing investments from tech giants & mobility operators
- 3.2.2 Industry pitfalls and challenges
- 3.2.2.1 High cost of autonomous fleet deployment
- 3.2.2.2 Regulatory & safety uncertainty
- 3.2.3 Market opportunities
- 3.2.3.1 Expansion into smart cities & mobility-as-a-service (maas)
- 3.2.3.2 Adoption of electric autonomous fleets
- 3.2.3.3 Corporate, campus, and closed-environment mobility
- 3.2.3.4 Technological advancements and AI integration
- 3.2.1 Growth drivers
- 3.3 Growth potential analysis
- 3.4 Regulatory landscape
- 3.4.1 Federal regulations (NHTSA, FMCSA, FTA guidance)
- 3.4.2 State-level permitting & testing requirements
- 3.4.3 Local ordinances (curb management, geofencing, operating hours)
- 3.4.4 Ada compliance & accessibility mandates
- 3.4.5 Safety standards & voluntary self-assessments
- 3.4.6 Liability & insurance framework
- 3.4.7 Data privacy & cybersecurity regulations
- 3.4.8 International regulatory harmonization
- 3.5 Porter's analysis
- 3.6 PESTEL analysis
- 3.7 Technology and Innovation Landscape
- 3.7.1 Sensor technology evolution (lidar, radar, camera, fusion)
- 3.7.2 Perception & localization algorithms
- 3.7.3 Motion planning & control systems
- 3.7.4 HD mapping & map-less navigation approaches
- 3.7.5. V2 X communication & cooperative automation
- 3.7.6 Remote operations & teleoperation systems
- 3.7.7 Cybersecurity & data privacy technologies
- 3.7.8 Accessible vehicle design & automated securement systems
- 3.8 Price trends
- 3.8.1 By region
- 3.8.2 By product
- 3.9 Cost breakdown analysis
- 3.10 Patent analysis
- 3.11 Sustainability and Environmental Aspects
- 3.11.1 Sustainable practices
- 3.11.2 Waste reduction strategies
- 3.11.3 Energy efficiency in production
- 3.11.4 Eco-friendly initiatives
- 3.12 Best case scenarios
- 3.13 Patent & Intellectual Property Analysis
- 3.13.1 Patent filing trends by technology domain
- 3.13.2 Leading patent holders (waymo, cruise, zoox, motional, aurora)
- 3.13.3 Sensor fusion & perception patent landscape
- 3.13.4 Motion planning & control patent clusters
- 3.13.5 HD mapping & localization IP
- 3.13.6 Patent litigation & licensing dynamics
- 3.14 Investment & Funding Analysis
- 3.14.1 Venture capital & private equity investment trends
- 3.14.2 Corporate strategic investments
- 3.14.3 Federal grant programs
- 3.14.4 Public market activity
- 3.14.5 Funding by development stage
- 3.14.6 Geographic distribution of investment
- 3.15 Operational Design Domain (ODD) Analysis
- 3.15.1 Geographic ODD Constraints (Geofencing, City Coverage)
- 3.15.2 Road Type ODD (Urban Arterials, Highways, Residential Streets)
- 3.15.3 Speed Range ODD
- 3.15.4 Weather & Environmental ODD
- 3.15.5 ODD Expansion Strategies & Timelines
- 3.16 Accessibility & Universal Design Implementation Standards
- 3.16.1 ADA compliance requirements for autonomous ride-sharing
- 3.16.2 Accessible vehicle design requirements
- 3.16.3 Accessible human-machine interface
- 3.16.4 Wayfinding & navigation assistance
- 3.16.5 Federal accessibility research & funding
- 3.16.6 Universal design principles for autonomous vehicles
- 3.16.7 Compliance monitoring & enforcement
- 3.17 Remote Operations & Teleoperation Infrastructure Analysis
- 3.17.1 Remote operations architecture & use cases
- 3.17.2 Teleoperation vs. Remote assistance distinction
- 3.17.3 NHTSA research on remote operations safety
- 3.17.4 Network infrastructure requirements
- 3.17.5 Remote operations center design
- 3.17.6 Regulatory requirements for remote operations
- 3.17.7 Economic considerations
- 3.18 Infrastructure Dependencies & Ecosystem Readiness Assessment
- 3.18.1 Road infrastructure requirements
- 3.18.2 Vehicle-to-infrastructure (V2I) communication
- 3.18.3 Charging infrastructure for electric autonomous fleets
- 3.18.4 HD mapping infrastructure & maintenance
- 3.18.5 Curb space management & pick-up/drop-off zones
- 3.18.6 Telecommunications infrastructure
- 3.18.7 Ecosystem readiness assessment framework
Chapter 4 Competitive Landscape, 2024
- 4.1 Introduction
- 4.2 Company market share analysis
- 4.2.1 North America
- 4.2.2 Europe
- 4.2.3 Asia Pacific
- 4.2.4 Latin America
- 4.2.5 Middle East & Africa
- 4.3 Competitive analysis of major market players
- 4.4 Competitive positioning matrix
- 4.5 Strategic outlook matrix
- 4.6 Key developments
- 4.6.1 Mergers & acquisitions
- 4.6.2 Partnerships & collaborations
- 4.6.3 New product launches
- 4.6.4 Expansion plans and funding
Chapter 5 Market Estimates & Forecast, By Automation Level, 2021 - 2034 ($ Bn)
- 5.1 Key trends
- 5.2 SAE level 4-high automation
- 5.3 SAE level 5-full automation
Chapter 6 Market Estimates & Forecast, By Technology Platform, 2021 - 2034 ($ Bn)
- 6.1 Key trends
- 6.2 Sensor suite configuration
- 6.2.1 Lidar-primary system
- 6.2.2 Radar-evolving system
- 6.2.3 Multi-modal sensor fusion
- 6.3 Compute architecture
- 6.4 Connectivity type
- 6.5 Mapping & localization approach
Chapter 7 Market Estimates & Forecast, By Service Model, 2021 - 2034 ($ Bn, Fleet Size)
- 7.1 Key trends
- 7.2 B2C robotaxi & ride-hailing services
- 7.3 B2B corporate & campus shuttle services
- 7.4 B2G municipal & transit-integrated services
- 7.5 Airport & specialized corridor shuttles
Chapter 8 Market Estimates & Forecast, By Vehicle, 2021 - 2034 ($ Bn, Fleet Size)
- 8.1 Key trends
- 8.2 Purpose-built robotaxis
- 8.3 Passenger cars & sedans
- 8.4 Vans & multi-purpose vehicles
- 8.5 Low-speed automated shuttles
- 8.6 Full-size transit buses (40-ft+)
Chapter 9 Market Estimates & Forecast, By Application, 2021 - 2034 ($ Bn, Fleet Size)
- 9.1 Key trends
- 9.2 Urban mobility & city transport
- 9.3 First/last-mile transit connectivity
- 9.4 Campus & closed-environment transport
- 9.5 Rural & underserved area mobility
- 9.6 Paratransit & accessibility services
Chapter 10 Market Estimates & Forecast, By Region, 2021 - 2034 ($ Bn, Fleet Size)
- 10.1 Key trends
- 10.2 North America
- 10.2.1 US
- 10.2.2 Canada
- 10.3 Europe
- 10.3.1 UK
- 10.3.2 Germany
- 10.3.3 France
- 10.3.4 Italy
- 10.3.5 Spain
- 10.3.6 Belgium
- 10.3.7 Netherlands
- 10.3.8 Sweden
- 10.4 Asia Pacific
- 10.4.1 China
- 10.4.2 India
- 10.4.3 Japan
- 10.4.4 Australia
- 10.4.5 Singapore
- 10.4.6 South Korea
- 10.4.7 Vietnam
- 10.4.8 Indonesia
- 10.5 Latin America
- 10.5.1 Brazil
- 10.5.2 Mexico
- 10.5.3 Argentina
- 10.6 MEA
- 10.6.1 UAE
- 10.6.2 South Africa
- 10.6.3 Saudi Arabia
Chapter 11 Company Profiles
- 11.1 Global Player
- 11.1.1 Cruise LLC
- 11.1.2 Geely/Zeekr
- 11.1.3 General Motors
- 11.1.4 Hyundai Motor Group
- 11.1.5 Jaguar Land Rover
- 11.1.6 Motional
- 11.1.7 Toyota Motor Corporation
- 11.1.8 Volkswagen Group
- 11.1.9 Waymo LLC
- 11.1.10 Zoox Inc.
- 11.2 Regional Player
- 11.2.1 Alphabet Inc.
- 11.2.2 Amazon
- 11.2.3 Aptiv PLC
- 11.2.4 Continental AG
- 11.2.5 EasyMile
- 11.2.6 Intel/Mobileye
- 11.2.7 May Mobility
- 11.2.8 New Flyer
- 11.2.9 NVIDIA Corporation
- 11.2.10 Qualcomm
- 11.3 Emerging Players
- 11.3.1 Aurora Innovation
- 11.3.2 Beep Inc.
- 11.3.3 Innoviz Technologies
- 11.3.4 Luminar Technologies
- 11.3.5 Perrone Robotics
 共享旅遊市場:2026-2032年全球市場預測(按服務類型、平台類型、營運模式、車輛類型、車輛所有權和最終用戶分類)
 共享旅遊市場報告:按服務類型、預訂方式、會員類型、旅遊目的和地區分類(2026-2034 年)
 社群共享旅遊市場預測—全球服務類型、經營模式、會員類型、平台類型、資料與服務層、最終用戶與地區分析—2034年
 2026年全球共享旅遊市場報告
 共享出行市場規模、佔有率、成長及全球產業分析:按類型、應用和地區分類的洞察,2026-2034 年預測2026-2034年全球共乘市場規模、佔有率、趨勢和成長分析報告
 共乘:市場佔有率分析、產業趨勢與統計、成長預測(2026-2031)社區共享共乘市場預測至2032年:按服務類型、車輛類型、平台類型、支付方式、最終用戶和地區分類的全球分析
 共乘:全球市場佔有率和排名、總收入和需求預測(2025-2031 年)2025年共享旅遊保險全球市場報告