


 |
市場調查報告書
商品編碼
1907319
鋰:市場佔有率分析、產業趨勢和統計數據、成長預測(2026-2031)Lithium - Market Share Analysis, Industry Trends & Statistics, Growth Forecasts (2026 - 2031) |
||||||
※ 本網頁內容可能與最新版本有所差異。詳細情況請與我們聯繫。
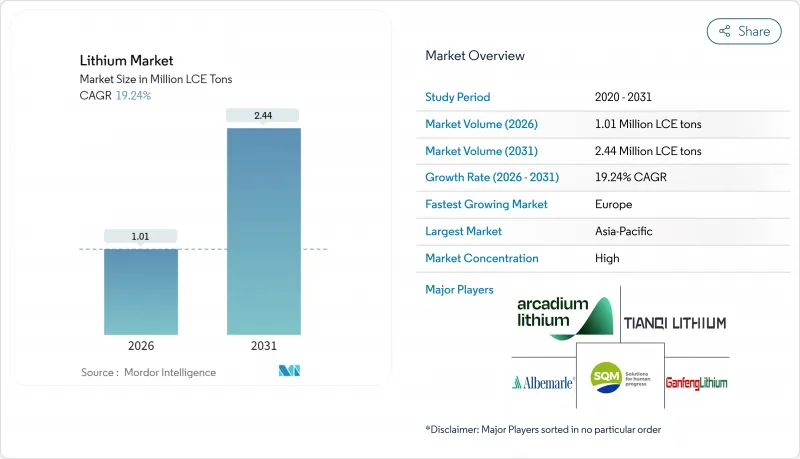
預計到 2026 年,鋰市場規模將達到 101 萬噸 LCE,高於 2025 年的 85 萬噸 LCE。
預計到 2031 年,全球煤炭消費量將達到 244 萬噸,2026 年至 2031 年的複合年成長率為 19.24%。
電池需求佔據新增供應的大部分,電動車銷售的強制規定和大規模儲能部署明確了長期需求前景。隨著高鎳正極材料成為高階電動車的主流化學體系,氫氧化鋰的消費成長速度超過了碳酸鋰。新的直接鋰提取(DLE)計劃正在縮短計劃前置作業時間並減少用水量,使礦業公司能夠更快地應對需求激增。區域生產和消費缺口依然存在,中國在加工方面佔據主導地位,但蘊藏量有限,而歐洲正在加快下游投資以避免未來的供應衝擊。一級生產商和科技公司之間日益加劇的整合加劇了競爭壓力,並推動了大規模的資本支出計畫。
全球鋰市場趨勢及展望
電動車滲透率目標和電池成本並行化
電池組價格持續下降,目標是每千瓦時100美元,這將縮小電動車和內燃機汽車之間的價格差距,即使在補貼減少後,電動車的普及速度也將加快。特斯拉每年從Liontown Resources採購15萬噸鋰輝石礦石,顯示汽車製造商正在為未來數年儲備上游原料。 Stellantis已與Vulcan Energy簽署了一份為期五年的供應協議,採購高達9.9萬噸氫氧化鋰,為歐洲在2035年逐步淘汰內燃機汽車做好準備。高鎳正極材料(例如NMC811)需要氫氧化物而非碳酸鹽,這將進一步加速化合物的轉化。中國新能源汽車滲透率將在2024年達到35%,顯示政策和成本的趨同正在創造永續的需求週期。類似的勢頭也在美國形成,聯邦政府的零排放目標與各州的法規一致,推動了鋰市場的需求。
美國、歐盟和中國強制要求建造電網級儲能設施(4小時或以上)。
具有法律約束力的儲能要求將確保汽車產業以外的鋰需求達到最低水準。美國《通膨控制法案》為獨立儲能計畫提供30%的投資稅額扣抵。加州要求到2026年新增11.5吉瓦的儲能容量。中國的「十四五」規劃設定了2025年實現30吉瓦儲能的目標,並要求各省風能和太陽能發電工程的儲能比例達到10%至20%。歐洲電網營運商估計,到2030年,需要200吉瓦的儲能容量來平衡可再生能源。鋰離子電池技術正逐漸成為主流,因為它符合四小時的續航標準,並且擁有最低的生命週期成本。這些強制性要求降低了氫氧化鋰和碳酸鋰生產商的收入波動,並為鋰市場的長期價格預測奠定了基礎。
中國二線加工商短期內供應過剩
中國鋰加工企業計畫在2024年將其碳酸鋰產能擴大至每年120萬噸,遠超過國內每年80萬噸的需求。由於長期合約有限,這些企業被迫將過剩產品傾銷至現貨市場,導致電池級碳酸鋰價格跌至每噸9,000-12,000美元,年減65%。價格波動抑制了其他領域的投資,並給高成本的生產者帶來了壓力。不斷上漲的環保法規合規成本和高能耗製程成本預計將逐步淘汰效率低下的企業。隨著產業整合的持續進行,鋰市場的定價權預計將趨於穩定。
細分市場分析
由於高高成本的碳酸鹽轉化,特斯拉在其4680電池中也全部使用氫氧化鋰。氫氧化鋰的高價(1000-2000美元/噸)反映了其供應緊張和加工過程的複雜性。歐洲的回收法規傾向於採用能夠在多個生命週期內保持純度的氫氧化鋰生產方法,這進一步推動了市場需求。氯化鋰和其他化合物服務於空氣處理、製藥和特殊化學品等細分市場,其市場成長持續但相對緩慢。
對氫氧化鋰日益成長的需求正對以碳酸鹽鋰為核心的供應鏈構成挑戰。澳洲和美國的計劃計劃在現場提煉氫氧化鋰,以降低物流成本。在中國,加工廠正投資進行製程最佳化,以提高鋰輝石製氫氧化鋰的產率。成功的直接鋰醚(DLE)試點計畫提供了高純度的原料解決方案,從而擴大了適用於氫氧化鋰生產的來源基礎。隨著汽車製造商轉向高鎳含量的鋰合金,合約訂單量也傾向於氫氧化鋰,加速了鋰市場內部化合物的遷移。
本鋰市場報告按化學化合物(碳酸鹽、氯化物等)、應用領域(電池、潤滑油和潤滑脂、空氣處理、製藥等)、終端用戶行業(工業、家用電子電器、儲能、醫療、汽車等)以及地區(亞太地區、北美、歐洲、南美、中東和非洲)進行細分。市場預測以噸為單位。
區域分析
到2025年,亞太地區將佔全球鋰市場61.65%的佔有率。這主要得益於中國精煉了全球約70%的鋰供應,但區域政策制定者正密切關注市場集中度風險。日本和韓國是先進電池製造領域的主導,需要高純度氫氧化鋰來製造富鎳正極材料。印度的乘用車電氣化計劃和生產連結獎勵計畫(PLI)正在吸引電池製造商,從而推動鋰需求的成長。澳洲雖然在硬岩礦石生產方面保持領先地位,但不得不出口大部分精礦進行加工,未能充分利用其增值潛力。區域進口商正在與南美鹽湖計劃和北美氫氧化鋰工廠洽談新的合作關係,以減少對中國冶煉廠的依賴。
歐洲將迎來最快成長,到2031年複合年成長率將達到25.33%。歐洲電池聯盟的目標是年產能達到550吉瓦時,《關鍵原料法》要求採購來源多元化。德國將憑藉其汽車產業叢集支撐需求,而北歐國家將利用可再生能源並推動高能量煉油。法國、義大利和西班牙將吸引超級工廠投資,進而振興當地的化學中間體產業。戰略儲備和回收義務將為本地加工的鋰創造穩定的需求,使當地價格高於全球平均水平。
北美正利用《通膨控制法案》的激勵措施,大力發展國內生產。美國正在擴大位於薩克帕斯和北卡羅來納州的採礦和精煉產能;加拿大正根據其關鍵礦產戰略推進電池級計劃;墨西哥則受益於《美國墨加協定》(USMCA)下的優惠貿易。南美洲正從出口國向部分消費國轉型,阿根廷和智利正在探索建造正極材料和電池工廠。巴西正在探索下游產業,以獲得更大價值。中東和非洲仍處於發展初期,但隨著波灣合作理事會(GCC)成員國和南非公共產業可再生能源和網格儲存的擴張,它們的重要性可能日益凸顯。
其他福利:
- Excel格式的市場預測(ME)表
- 3個月的分析師支持
目錄
第1章 引言
- 研究假設和市場定義
- 調查範圍
第2章調查方法
第3章執行摘要
第4章 市場情勢
- 市場概覽
- 市場促進因素
- 電動車滲透率目標和電池成本並行化
- 美國、歐盟和中國強制要求建造電網級儲能設施(4小時或以上)。
- 簽訂承購協議以確保供應並獲得原始設備製造商 (OEM) 的支持
- 直接鋰萃取(DLE)技術的興起及成功的初步試驗
- 《通膨控制法》下的下游稅額扣抵
- 市場限制
- 中國二級加工商短週期產品供應過剩
- 由於利率急劇上升,儲能系統採購意外放緩。
- 鈉離子電池的商業化才剛開始。
- 價值鏈分析
- 波特五力模型
- 供應商的議價能力
- 買方的議價能力
- 新進入者的威脅
- 替代品的威脅
- 競爭程度
- 定價分析
- 技術概述
第5章 市場規模與成長預測
- 化合物
- 碳酸鹽
- 氯化物
- 氫氧化物
- 其他
- 透過使用
- 電池
- 潤滑劑和潤滑脂
- 空氣處理
- 製藥
- 玻璃和陶瓷(包括玻璃料)
- 聚合物
- 其他用途
- 按最終用戶行業分類
- 產業
- 家用電子電器
- 儲能
- 醫療保健
- 車
- 其他終端用戶產業
- 按地區
- 生產和蘊藏量分析
- 澳洲
- 智利
- 中國
- 阿根廷
- 辛巴威
- 美國
- 其他地區
- 消費分析
- 亞太地區
- 中國
- 日本
- 印度
- 韓國
- 澳洲和紐西蘭
- 亞太其他地區
- 北美洲
- 美國
- 加拿大
- 墨西哥
- 歐洲
- 德國
- 英國
- 法國
- 義大利
- 北歐國家
- 其他歐洲地區
- 南美洲
- 巴西
- 阿根廷
- 南美洲其他地區
- 中東和非洲
- 沙烏地阿拉伯
- 南非
- 其他中東和非洲地區
- 亞太地區
- 生產和蘊藏量分析
第6章 競爭情勢
- 市場集中度
- 策略趨勢
- 市佔率(%)/排名分析
- 公司簡介
- Albemarle Corporation
- Arcadium Lithium(Rio Tinto)
- Avalon Advanced Materials Inc.
- Ganfeng Lithium Group Co., Ltd.
- Lithium Americas Corp.
- Lithium Australia
- Mineral Resources
- Morella Corporation Limited
- Pilbara Minerals
- Sichuan Yahua Industrial Group Co. Ltd
- SQM
- Tianqi Lithium Corporation Limited
第7章 市場機會與未來展望
Lithium market size in 2026 is estimated at 1.01 Million LCE tons, growing from 2025 value of 0.85 Million LCE tons with 2031 projections showing 2.44 Million LCE tons, growing at 19.24% CAGR over 2026-2031.
Battery demand accounts for most incremental volumes, with policies that mandate electric-vehicle sales and grid-scale storage creating long-term visibility on offtake. Hydroxide consumption is expanding faster than carbonate as high-nickel cathodes become the preferred chemistry for premium electric cars. New direct-lithium-extraction (DLE) projects shorten project lead times and lowering water use, helping miners respond more quickly to demand spikes. Regional production-consumption gaps persist: China dominates processing yet owns limited reserves, while Europe accelerates downstream investments to avoid future supply shocks. Consolidation among tier-1 producers and technology companies intensifies competitive pressure and supports larger capital-spending plans.
Global Lithium Market Trends and Insights
EV Penetration Targets and Battery-Cost Parity
Battery packs moving toward USD 100/kWh enable price parity between electric and combustion vehicles, accelerating adoption even when subsidies fade. Tesla's 150,000 DMT annual spodumene offtake from Liontown Resources demonstrates how automakers now secure upstream inputs years in advance. Stellantis signed a five-year agreement for up to 99,000 MT of lithium hydroxide from Vulcan Energy to prepare for the 2035 European engine phase-out. Higher-nickel cathodes such as NMC 811 demand hydroxide rather than carbonate, reinforcing the compound shift. China's new-energy-vehicle penetration reached 35% in 2024, indicating that policy and cost convergence create self-sustaining demand cycles. Similar momentum is building in the United States as federal zero-emission targets align with state mandates, in the lithium market
Grid-Scale Storage Mandates (>=4 h) in US, EU and China
Legally binding storage requirements guarantee a minimum level of lithium demand outside the vehicle cycle. The U.S. Inflation Reduction Act offers a 30% investment tax credit for standalone storage, while California must add 11.5 GW by 2026. China's 14th Five-Year Plan sets a 30 GW storage target by 2025, and provinces enforce 10-20% storage ratios on wind and solar projects. Europe's transmission operators estimate 200 GW of storage will be needed by 2030 to balance renewables. Lithium-ion technology dominates because it meets the four-hour duration standard at the lowest life-cycle cost. These mandates reduce revenue volatility for hydroxide and carbonate producers and anchor long-run pricing expectations across the lithium market.
Short-Cycle Oversupply from Tier-2 Chinese Converters
Chinese converters expanded lithium carbonate capacity to 1.2 million tpy in 2024, overshooting domestic demand of 800,000 tpy. With limited long-term contracts, these firms dump excess product on spot markets, pushing battery-grade carbonate to USD 9,000-12,000/t, 65% lower than a year earlier. Price volatility deters investment elsewhere and squeezes producers with higher cost bases. Environmental compliance costs and energy-intensive processes are rising, which will gradually remove the least efficient operators. Once consolidation progresses, pricing power is expected to stabilise across the lithium market.
Other drivers and restraints analyzed in the detailed report include:
- OEM-Backed Off-take Agreements Securing Supply
- Rise of Direct-Lithium-Extraction (DLE) Pilot Successes
- Slower-than-Expected ESS Procurement due to Interest-Rate Spikes
For complete list of drivers and restraints, kindly check the Table Of Contents.
Segment Analysis
Lithium hydroxide posted a 23.02% CAGR outlook through 2031 because high-nickel cathodes need higher reactivity, while lithium carbonate maintained 64.78% market share in 2025 through well-established industrial routes. Battery manufacturers now specify hydroxide directly to avoid costly carbonate conversion, and Tesla employs only hydroxide in its 4680 cells. The hydroxide premium of USD 1,000-2,000/t reflects tighter supply and higher processing complexity. Recycling mandates in Europe favour hydroxide pathways because they preserve purity across multiple life cycles, further lifting demand. Lithium chloride and other compounds serve niche air-treatment, pharmaceutical and specialty-chemical markets with steady but comparatively slow expansion.
Growing hydroxide demand challenges supply chains optimised for carbonate. Projects in Australia and the United States plan hydroxide refining adjacent to mines to cut logistics costs. In China, converters invest in debottlenecking to raise hydroxide yield from spodumene. Successful DLE pilots broaden the resource base suitable for hydroxide production by delivering high-purity feed solutions. As more automakers shift to high-nickel chemistries, contract volumes favour hydroxide, sharpening the compound transition inside the lithium market.
The Lithium Market Report is Segmented by Compound (Carbonate, Chloride, and More), Application (Battery, Lubricants and Grease, Air Treatment, Pharmaceuticals, and More), End-User Industry (Industrial, Consumer Electronics, Energy Storage, Medical, Automotive, and More), and Geography (Asia-Pacific, North America, Europe, South America, and Middle East and Africa). The Market Forecasts are Provided in Terms of Volume (Tons).
Geography Analysis
Asia-Pacific retained 61.65% of the Lithium market size in 2025 because China refines about 70% of global supply, yet regional policymakers watch concentration risk closely. Japan and South Korea lead advanced battery manufacturing, demanding high-purity hydroxide for nickel-rich cathodes. India's passenger-vehicle electrification program and PLI incentives attract cell makers, creating incremental lithium pull. Australia dominates hard-rock production but must ship most concentrate for processing, leaving value-addition opportunities underexploited. Regional importers negotiate new partnerships with South American brine projects and North American hydroxide plants to reduce reliance on Chinese converters.
Europe expands fastest, recording a 25.33% CAGR to 2031. The European Battery Alliance targets 550 GWh annual capacity, and the Critical Raw Materials Act mandates diversified sourcing. Germany anchors demand through automotive clusters, while Nordic nations deploy renewable power to host energy-intensive refining. France, Italy and Spain attract gigafactory investment, stimulating local chemical intermediates. Strategic stockpiling and recycling quotas create captive demand for regionally processed lithium, supporting local prices above global averages.
North America leverages Inflation Reduction Act incentives that value domestic content. The United States adds extraction at Thacker Pass and refinery capacity in North Carolina, Canada promotes battery-grade projects under its Critical Minerals Strategy, and Mexico benefits from the United States-Mexico-Canada Agreement (USMCA) preferential trade. South America evolves from exporter to part-time consumer as Argentina and Chile explore cathode and cell plants. Brazil studies downstream options to capture greater value. The Middle East and Africa remain nascent but could gain prominence as renewables and grid storage scale across Gulf Cooperation Council states and South African utilities.
- Albemarle Corporation
- Arcadium Lithium (Rio Tinto)
- Avalon Advanced Materials Inc.
- Ganfeng Lithium Group Co., Ltd.
- Lithium Americas Corp.
- Lithium Australia
- Mineral Resources
- Morella Corporation Limited
- Pilbara Minerals
- Sichuan Yahua Industrial Group Co. Ltd
- SQM
- Tianqi Lithium Corporation Limited
Additional Benefits:
- The market estimate (ME) sheet in Excel format
- 3 months of analyst support
TABLE OF CONTENTS
1 Introduction
- 1.1 Study Assumptions and Market Definition
- 1.2 Scope of the Study
2 Research Methodology
3 Executive Summary
4 Market Landscape
- 4.1 Market Overview
- 4.2 Market Drivers
- 4.2.1 EV Penetration Targets and Battery-cost Parity
- 4.2.2 Grid-scale Storage Mandates (>=4 h) in U.S., EU and China
- 4.2.3 OEM-backed Off-take Agreements Securing Supply
- 4.2.4 Rise of Direct-lithium-extraction (DLE) Pilot Successes
- 4.2.5 Inflation-Reduction-Act Downstream Tax Credits
- 4.3 Market Restraints
- 4.3.1 Short-cycle Oversupply from Tier-2 Chinese Converters
- 4.3.2 Slower-than-expected ESS Procurement due to Interest-rate Spikes
- 4.3.3 Nascent Sodium-ion Battery Commercialization
- 4.4 Value Chain Analysis
- 4.5 Porter's Five Forces
- 4.5.1 Bargaining Power of Suppliers
- 4.5.2 Bargaining Power of Buyers
- 4.5.3 Threat of New Entrants
- 4.5.4 Threat of Substitutes
- 4.5.5 Degree of Competition
- 4.6 Pricing Analysis
- 4.7 Technology Snapshot
5 Market Size and Growth Forecasts (Volume)
- 5.1 By Compound
- 5.1.1 Carbonate
- 5.1.2 Chloride
- 5.1.3 Hydroxide
- 5.1.4 Others
- 5.2 By Application
- 5.2.1 Battery
- 5.2.2 Lubricants and Grease
- 5.2.3 Air Treatment
- 5.2.4 Pharmaceuticals
- 5.2.5 Glass and Ceramics (Including Frits)
- 5.2.6 Polymer
- 5.2.7 Other Applications
- 5.3 By End-user Industry
- 5.3.1 Industrial
- 5.3.2 Consumer Electronics
- 5.3.3 Energy Storage
- 5.3.4 Medical
- 5.3.5 Automotive
- 5.3.6 Other End-user Industries
- 5.4 By Geography
- 5.4.1 Production and Reserve Analysis
- 5.4.1.1 Australia
- 5.4.1.2 Chile
- 5.4.1.3 China
- 5.4.1.4 Argentina
- 5.4.1.5 Zimbabwe
- 5.4.1.6 United States
- 5.4.1.7 Other Regions
- 5.4.2 Consumption Analysis
- 5.4.2.1 Asia-Pacific
- 5.4.2.1.1 China
- 5.4.2.1.2 Japan
- 5.4.2.1.3 India
- 5.4.2.1.4 South Korea
- 5.4.2.1.5 Australia and New Zealand
- 5.4.2.1.6 Rest of Asia-Pacific
- 5.4.2.2 North America
- 5.4.2.2.1 United States
- 5.4.2.2.2 Canada
- 5.4.2.2.3 Mexico
- 5.4.2.3 Europe
- 5.4.2.3.1 Germany
- 5.4.2.3.2 United Kingdom
- 5.4.2.3.3 France
- 5.4.2.3.4 Italy
- 5.4.2.3.5 Nordic Countries
- 5.4.2.3.6 Rest of Europe
- 5.4.2.4 South America
- 5.4.2.4.1 Brazil
- 5.4.2.4.2 Argentina
- 5.4.2.4.3 Rest of South America
- 5.4.2.5 Middle East and Africa
- 5.4.2.5.1 Saudi Arabia
- 5.4.2.5.2 South Africa
- 5.4.2.5.3 Rest of Middle East and Africa
- 5.4.2.1 Asia-Pacific
- 5.4.1 Production and Reserve Analysis
6 Competitive Landscape
- 6.1 Market Concentration
- 6.2 Strategic Moves
- 6.3 Market Share (%)**/Ranking Analysis
- 6.4 Company Profiles (includes Global level Overview, Market level overview, Core Segments, Financials as available, Strategic Information, Market Rank/Share, Products and Services, Recent Developments)
- 6.4.1 Albemarle Corporation
- 6.4.2 Arcadium Lithium (Rio Tinto)
- 6.4.3 Avalon Advanced Materials Inc.
- 6.4.4 Ganfeng Lithium Group Co., Ltd.
- 6.4.5 Lithium Americas Corp.
- 6.4.6 Lithium Australia
- 6.4.7 Mineral Resources
- 6.4.8 Morella Corporation Limited
- 6.4.9 Pilbara Minerals
- 6.4.10 Sichuan Yahua Industrial Group Co. Ltd
- 6.4.11 SQM
- 6.4.12 Tianqi Lithium Corporation Limited
7 Market Opportunities and Future Outlook
- 7.1 White-space and Unmet-need Assessment
 鋰萃取膜市場分析及預測(至2035年):類型、技術、應用、材料類型、製程、最終用戶、功能、安裝配置
 鋰市場:依形態、等級、應用和最終用戶分類-2026-2032年全球市場預測
 鋰提取市場規模、佔有率和趨勢分析報告:按資源類型、地區和細分市場預測(2026-2033 年)
 2026-2034年全球鋰市場規模、佔有率、趨勢和成長分析報告氯化鋰市場規模、佔有率、成長及全球產業分析:按類型、應用和地區分類,並預測至2026-2034年
 2026年全球鋰市場報告全球直接鋰萃取 (DLE) 市場 (2026-2036)鋰離子電池電解液(LiFSI)市場規模、佔有率、成長及全球產業分析:依類型、應用和地區劃分的洞察與預測(2026–2034)2026年全球鋰電池電氣設備市場報告
 鋰市場-全球產業規模、佔有率、趨勢、機會、預測:按產品、應用、地區和競爭對手分類,2021-2031年