


 |
市場調查報告書
商品編碼
1906938
印尼可再生能源市場:市場佔有率分析、產業趨勢與統計、成長預測(2026-2031年)Indonesia Renewable Energy - Market Share Analysis, Industry Trends & Statistics, Growth Forecasts (2026 - 2031) |
||||||
※ 本網頁內容可能與最新版本有所差異。詳細情況請與我們聯繫。
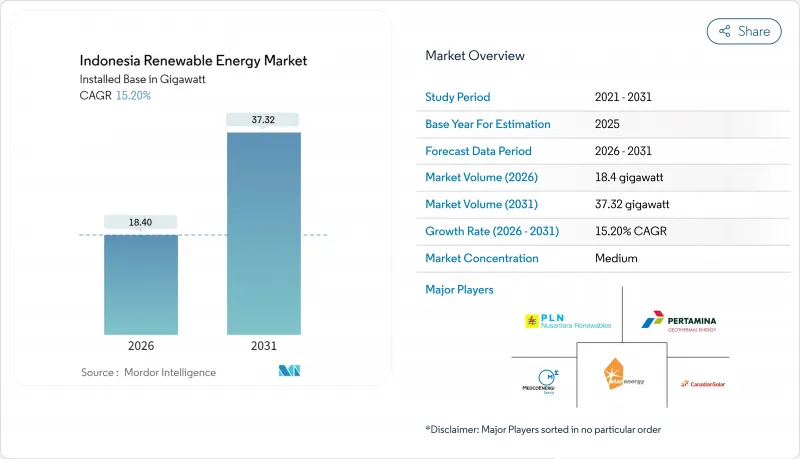
預計到 2026 年,印尼可再生能源市場規模將達到 18.4 吉瓦,高於 2025 年的 15.97 吉瓦,預計到 2031 年將達到 37.32 吉瓦,2026 年至 2031 年的複合年成長率為 15.20%。
強力的政策支持、不斷下降的技術成本以及日益成長的商業需求,正推動著這一發展勢頭,因為政府力求在實現氣候目標的同時促進經濟成長。普拉博沃·蘇比安托總統於2025年1月為總投資72兆印尼幣(約44億美元)的37個電力計劃舉行了奠基儀式,這凸顯了國家對電網升級和新增產能的支持。儘管水力發電在發電結構中仍佔據主導地位,但由於計劃經濟效益的提升以及獨立發電商(IPP)資產多元化經營,太陽能光電發電正經歷最快的成長。隨著包括200億美元「公正能源轉型夥伴關係」在內的氣候融資的流入,資本約束正在緩解,但燃煤電廠產能過剩以及國有電力公司PLN的單一買家模式仍然阻礙著私人投資。
印尼可再生能源市場趨勢與分析
太陽能和風能發電的平準化電成本(LCOE)下降
2024年,全球太陽能光電發電成本將降至平均每千瓦時0.044美元,陸域風電成本將降至每千瓦時0.033美元,均低於煤炭發電的基準值每千瓦時0.065美元。隨著印尼於2024年8月放寬在地採購限制,允許開發商在保持國內組裝的同時進口更便宜的組件,印尼的計劃儲備正在加速成長。這些經濟因素促使印尼國家電力公司(PLN)將重點放在控制發電成本上,特別是燃料成本節約和碳價格風險,使得新建設的經濟效益向可再生傾斜。因此,印尼的可再生能源市場正穩步轉向太陽能和風能,以增加新增裝置容量。正在進行的資金籌措改革透過降低開發商先前面臨的溢價,進一步擴大了這種成本差距。
根據 RUPTL 2025-34 年計劃,新增可再生能源裝置容量為 53 吉瓦。
印尼電力供應計畫要求2034年新增69.5吉瓦的電力裝置容量,其中76%將來自可再生能源或儲能。這將需要2,967兆印尼幣(約1,825億美元)的投資。該計畫預計73%的資金將透過公私夥伴關係資金籌措,將推動印尼可再生能源市場走向更深層的技術多元化。藍圖規劃了17.1吉瓦的太陽能、7.2吉瓦的風能和5.2吉瓦的地熱能,旨在打破傳統水力發電主導的局面,建造更靈活的電網。計劃建造的兩台250兆瓦核能發電機組標誌著印尼致力於實現長期低碳基本負載供電,而2040年可再生能源佔比達到41%的目標則為投資者提供了更清晰的投資前景。
煤炭產能過剩及強制性營運購電協議
傳統的燃煤購電協議(PPA)要求印尼國家電力公司(PLN)即使在電廠運作的情況下也需支付容量費,每年造成該公司超過80億美元的損失。這些「主運行」條款阻礙了更廉價的可再生能源的普及,並限制了其近期成長,儘管再生能源在經濟上具有優勢。雖然預計隨著能源轉型機制下的提前退役機制獲得資金籌措和合約重新談判,煤炭的結構性鎖定將有所緩解,但時間表仍不明朗,並繼續制約著印尼可再生能源市場的成長。
細分市場分析
截至2025年,水力發電將佔印尼可再生能源市場佔有率的47.70%,這主要得益於2020年前已運作的現有水壩。同時,預計2026年至2031年間,風力發電裝置容量將以55.95%的複合年成長率成長,這主要得益於蘇拉威西島的離岸風力發電區域和南蘇拉威西島的優質陸上風電場。印尼水力發電領域的可再生能源市場規模預計將緩慢成長,因為未來的擴張將傾向於避免安置問題的小規模徑流式水力發電計劃。同時,在爪哇島、峇里島和浮動水庫,太陽能光電發電裝置正在快速擴張,這主要得益於符合容量支付條件的四小時儲能系統的增加。
風電的快速成長得益於ACWA Power和Masdar的合資投資以及較高的裝置容量利用率,但海底電纜連接和海上區域開發仍不成熟。地熱計劃雖然受到鑽井風險和高昂前期成本的限制,但仍以每年200-300兆瓦的速度穩定成長,為印尼國家電力公司(PLN)的電網規劃提供可調節的基本負載電源。生質能源的成長遵循B40和B50混合能源指令,該指令穩定了棕櫚油生產的生質能原料需求。海洋能源仍處於試驗階段,收費系統尚待明確。預計到本世紀末,這種不斷變化的能源構成比將使印尼的可再生能源市場向可變可再生和儲能轉型。
印尼可再生能源市場報告按技術(太陽能、風力發電、水力發電、生質能源、地熱能和海洋能)和最終用戶(公共產業、商業和工業以及住宅)進行細分。市場規模和預測以裝置容量(吉瓦)為單位。
其他福利:
- Excel格式的市場預測(ME)表
- 3個月的分析師支持
目錄
第1章 引言
- 研究假設和市場定義
- 調查範圍
第2章調查方法
第3章執行摘要
第4章 市場情勢
- 市場概覽
- 市場促進因素
- 太陽能和風能發電的平準化電成本(LCOE)下降
- RUPTL 2025-34 年計畫引進 53 吉瓦的新增可再生能源
- JETP和多邊氣候融資流動
- 推廣強制性B40/B50生質燃料摻混
- 資料中心和企業購電協議的快速成長
- 用於最後一公里電氣化的離網微電網
- 市場限制
- 煤炭產能過剩及強制性營運購電協議
- 與東南亞國協相比,資本成本較高
- PLN的壟斷地位限制了競爭。
- 風力發電廠和水力發電廠的土地徵用爭議
- 供應鏈分析
- 監管環境
- 技術展望
- 波特五力模型
- 供應商的議價能力
- 買方的議價能力
- 新進入者的威脅
- 替代品的威脅
- 競爭對手之間的競爭
- PESTEL 分析
第5章 市場規模與成長預測
- 透過技術
- 太陽能(光伏和聚光太陽能)
- 風力發電(陸上和海上)
- 水力發電(小規模、大型、抽水蓄能)
- 生質能源
- 地熱
- 海洋能源(潮汐能和波浪能)
- 最終用戶
- 電力公司
- 商業和工業
- 住宅
第6章 競爭情勢
- 市場集中度
- 策略性舉措(併購、夥伴關係、購電協議)
- 市場佔有率分析(主要企業的市場排名和佔有率)
- 公司簡介
- PLN Renewables(PT Pembangkitan Jawa-Bali, PT Indonesia Power)
- Pertamina Geothermal Energy
- Star Energy Geothermal
- Medco Power Indonesia
- Canadian Solar Inc.
- Trina Solar Ltd
- PT Sumber Energi Sukses Makmur
- PT Barito Renewables Energy Tbk
- SEG Solar
- PT ATW Solar Indonesia
- Fourth Partner Energy Pvt Ltd
- Xurya Daya Indonesia
- TotalEnergies ENEOS
- ACWA Power
- Masdar
- Northstar PLTS
- Bright PLN Batam
- PT Supreme Energy
- PT Geo Dipa Energi
- PT Sarulla Operations
第7章 市場機會與未來展望
Indonesia Renewable Energy market size in 2026 is estimated at 18.4 gigawatt, growing from 2025 value of 15.97 gigawatt with 2031 projections showing 37.32 gigawatt, growing at 15.20% CAGR over 2026-2031.
Strong policy tailwinds, falling technology costs, and rising corporate demand drive this momentum while the government balances climate goals with economic growth. President Prabowo Subianto's January 2025 inauguration of 37 electricity projects worth IDR 72 trillion (USD 4.4 billion) underscored state backing for grid upgrades and new capacity. Hydropower still leads the generation mix, yet solar PV registers the fastest growth as project economics improve, and independent power producers diversify beyond legacy assets. Climate-finance inflows, including the USD 20 billion Just Energy Transition Partnership, are easing capital constraints, though coal over-capacity and PLN's single-buyer model continue to slow private investment.
Indonesia Renewable Energy Market Trends and Insights
Falling solar & wind LCOE
Global average solar costs fell to USD 0.044/kWh in 2024 and onshore wind to USD 0.033/kWh, undercutting coal's USD 0.065/kWh benchmark. Indonesia's August 2024 relaxation of local-content rules lets developers import cheaper modules while keeping assembly onshore, accelerating project pipelines. These economics sharpen PLN's focus on curbing generation costs, especially as avoided fuel outlays and carbon-pricing risks tilt new-build economics toward renewables. The result is a steady pivot in the Indonesian renewable energy market toward solar and wind for green-field capacity additions. Ongoing financing reforms further magnify this cost parity by narrowing the premium that developers once faced.
RUPTL 2025-34 Pipeline of 53 GW New Renewable Capacity
Indonesia's power-supply plan calls for 69.5 GW of new capacity by 2034, 76% of which is renewable or storage, requiring IDR 2,967 trillion (USD 182.5 billion) in investment. Private partnerships are expected to fund 73% of this pipeline, shifting the Indonesian renewable energy market toward deeper technology diversification. The roadmap earmarks 17.1 GW solar, 7.2 GW wind, and 5.2 GW geothermal, moving beyond hydropower's historic dominance and enabling a more flexible grid. Two planned 250 MW nuclear units underscore a longer-term quest for baseload low-carbon supply, while the 41% renewable target for 2040 offers clearer visibility for investors.
Coal Over-Capacity & Must-Run PPAs
Legacy coal PPAs obligate PLN to pay capacity charges even when plants are idle, costing the utility more than USD 8 billion annually. These must-run clauses crowd out procurement of cheaper renewables, limiting short-term additions despite favorable economics. Coal's structural lock-in is set to ease only as early-retirement schemes under the Energy Transition Mechanism secure funding and renegotiate contracts, but the timetable remains uncertain and continues to temper growth in the Indonesian renewable energy market.
Other drivers and restraints analyzed in the detailed report include:
- JETP & Multilateral Climate-Finance Inflows
- Mandatory B40/B50 Biofuel Blending Push
- High Cost of Capital versus ASEAN Peers
For complete list of drivers and restraints, kindly check the Table Of Contents.
Segment Analysis
Hydropower held 47.70% of Indonesia's Renewable Energy market share in 2025, owing to legacy dams commissioned before 2020. Conversely, wind capacity is forecast to post a 55.95% CAGR from 2026 to 2031, fueled by offshore zones in Sulawesi and robust onshore sites in South Sulawesi. The Indonesian Renewable Energy market size for hydropower will grow slowly as future additions skew to small run-of-river projects that skirt resettlement controversies. Solar installations are accelerating in Java, Bali, and on floating reservoirs, benefiting from 4-hour battery add-ons that qualify for capacity payments.
Wind's rapid rise rests on higher capacity factors and joint-venture finance from ACWA Power and Masdar, although subsea-cable links and marine-use zoning remain underdeveloped. Geothermal projects add a steady 200-300 MW annually, constrained by drilling risk and high upfront cost, yet provide dispatchable baseload that anchors PLN's system planning. Bioenergy growth follows B40 and B50 blending mandates that stabilize biomass feedstock demand in palm-oil provinces. Ocean energy stays at pilot scale pending tariff clarity. The evolving mix will pivot the Indonesian Renewable Energy market toward variable renewables plus storage by the late decade.
The Indonesia Renewable Energy Market Report is Segmented by Technology (Solar Energy, Wind Energy, Hydropower, Bioenergy, Geothermal, and Ocean Energy) and End-User (Utilities, Commercial and Industrial, and Residential). The Market Sizes and Forecasts are Provided in Terms of Installed Capacity (GW).
List of Companies Covered in this Report:
- PLN Renewables (PT Pembangkitan Jawa-Bali, PT Indonesia Power)
- Pertamina Geothermal Energy
- Star Energy Geothermal
- Medco Power Indonesia
- Canadian Solar Inc.
- Trina Solar Ltd
- PT Sumber Energi Sukses Makmur
- PT Barito Renewables Energy Tbk
- SEG Solar
- PT ATW Solar Indonesia
- Fourth Partner Energy Pvt Ltd
- Xurya Daya Indonesia
- TotalEnergies ENEOS
- ACWA Power
- Masdar
- Northstar PLTS
- Bright PLN Batam
- PT Supreme Energy
- PT Geo Dipa Energi
- PT Sarulla Operations
Additional Benefits:
- The market estimate (ME) sheet in Excel format
- 3 months of analyst support
TABLE OF CONTENTS
1 Introduction
- 1.1 Study Assumptions & Market Definition
- 1.2 Scope of the Study
2 Research Methodology
3 Executive Summary
4 Market Landscape
- 4.1 Market Overview
- 4.2 Market Drivers
- 4.2.1 Falling solar & wind LCOE
- 4.2.2 RUPTL 2025-34 pipeline of 53 GW new RE
- 4.2.3 JETP & multilateral climate-finance inflows
- 4.2.4 Mandatory B40/B50 biofuel blending push
- 4.2.5 Data-centre & corporate PPA boom
- 4.2.6 Off-grid microgrids for last-mile electrification
- 4.3 Market Restraints
- 4.3.1 Coal over-capacity & must-run PPAs
- 4.3.2 High cost of capital vs ASEAN peers
- 4.3.3 PLN single-buyer monopoly limits competition
- 4.3.4 Land-acquisition conflicts in wind/hydro sites
- 4.4 Supply-Chain Analysis
- 4.5 Regulatory Landscape
- 4.6 Technological Outlook
- 4.7 Porters Five Forces
- 4.7.1 Bargaining Power of Suppliers
- 4.7.2 Bargaining Power of Buyers
- 4.7.3 Threat of New Entrants
- 4.7.4 Threat of Substitutes
- 4.7.5 Competitive Rivalry
- 4.8 PESTLE Analysis
5 Market Size & Growth Forecasts
- 5.1 By Technology
- 5.1.1 Solar Energy (PV and CSP)
- 5.1.2 Wind Energy (Onshore and Offshore)
- 5.1.3 Hydropower (Small, Large, PSH)
- 5.1.4 Bioenergy
- 5.1.5 Geothermal
- 5.1.6 Ocean Energy (Tidal and Wave)
- 5.2 By End-User
- 5.2.1 Utilities
- 5.2.2 Commercial and Industrial
- 5.2.3 Residential
6 Competitive Landscape
- 6.1 Market Concentration
- 6.2 Strategic Moves (M&A, Partnerships, PPAs)
- 6.3 Market Share Analysis (Market Rank/Share for key companies)
- 6.4 Company Profiles (includes Global level Overview, Market level overview, Core Segments, Financials as available, Strategic Information, Products & Services, and Recent Developments)
- 6.4.1 PLN Renewables (PT Pembangkitan Jawa-Bali, PT Indonesia Power)
- 6.4.2 Pertamina Geothermal Energy
- 6.4.3 Star Energy Geothermal
- 6.4.4 Medco Power Indonesia
- 6.4.5 Canadian Solar Inc.
- 6.4.6 Trina Solar Ltd
- 6.4.7 PT Sumber Energi Sukses Makmur
- 6.4.8 PT Barito Renewables Energy Tbk
- 6.4.9 SEG Solar
- 6.4.10 PT ATW Solar Indonesia
- 6.4.11 Fourth Partner Energy Pvt Ltd
- 6.4.12 Xurya Daya Indonesia
- 6.4.13 TotalEnergies ENEOS
- 6.4.14 ACWA Power
- 6.4.15 Masdar
- 6.4.16 Northstar PLTS
- 6.4.17 Bright PLN Batam
- 6.4.18 PT Supreme Energy
- 6.4.19 PT Geo Dipa Energi
- 6.4.20 PT Sarulla Operations
7 Market Opportunities & Future Outlook
- 7.1 White-space & Unmet-Need Assessment
 新一輪石油危機:推動通訊業者轉向可再生能源
 可再生能源市場規模、佔有率、成長及全球產業分析:按類型、應用和地區分類的洞察,2026-2034 年預測
 農業可再生能源:生質燃料、太陽能發電廠和永續農業實踐的全球市場—按應用、產品和地區分類的分析和預測(2025-2035 年)
 2026年全球可再生能源市場報告2026年全球多元能源系統市場報告2026年全球太陽能燃料市場報告
 可再生能源市場:全球產業分析、市場規模、市場佔有率及預測(依投資類型、可再生能源類型、企業類型、應用、國家及地區分類)-2026-2033年
 風電場變電站市場按組件類型、配置類型、連接類型、電壓等級、最終用戶和安裝類型分類,全球預測(2026-2032年)全球節能設備市場:機會與策略展望(至2034年)
 節能微控制器市場分析及預測(至2035年):依類型、產品類型、服務、技術、組件、應用、最終用戶、功能、安裝類型、解決方案分類