


 |
市場調查報告書
商品編碼
1906034
計劃管理軟體系統:市場佔有率分析、產業趨勢與統計、成長預測(2026-2031)Project Management Software Systems - Market Share Analysis, Industry Trends & Statistics, Growth Forecasts (2026 - 2031) |
||||||
※ 本網頁內容可能與最新版本有所差異。詳細情況請與我們聯繫。
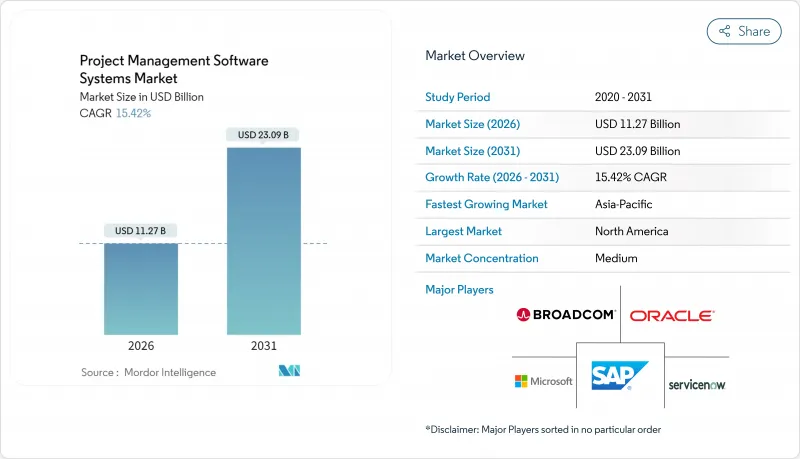
2025年計劃管理軟體系統市值為97.6億美元,預計2031年將達到230.9億美元,高於2026年的112.7億美元。
預測期(2026-2031 年)的複合年成長率預計為 15.42%。
此次擴展基於雲端優先部署、低程式碼可配置性和預測分析,這些特性共同將計劃監控從任務追蹤提升到策略協調。隨著分散式團隊需要即時協作,以及企業尋求將專案資料與財務、人力資源和客戶系統整合以實現統一的可見性,市場需求正在不斷成長。混合部署的成長速度最快,因為受監管行業仍然需要本地資料管理。中小企業 (SME) 透過繞過傳統的實施障礙來加速採用,而人工智慧原生功能則增強了風險管理和成本預測。隨著供應商整合特定產業的工作流程和開放的 API 生態系統,競爭也日益激烈。
全球計劃管理軟體系統市場趨勢與洞察
遠端和混合企劃團隊的雲端優先部署
組織機構報告稱,從桌面工具遷移到雲端原生平台後,任務完成速度提高了 54%。計劃管理軟體系統市場正蓬勃發展,即時同步功能使分散式團隊能夠跨時區保持工作進度。 IT 部門更青睞雲端的可擴展性,因為它減輕了容量規劃的負擔。混合模式市場預計將以 18.4% 的複合年成長率成長,因為受監管行業要求在可訪問性和數據控制之間取得平衡。供應商正在積極回應,提供資料居住選項,在滿足資料主權要求的同時,保持順暢的協作。
將您的專案管理平台與企業級 SaaS 堆疊整合
企業平均運行 976 個應用程式,但只有 28% 的應用程式實現了深度整合,導致專案資料流緩慢。現代平台將自身定位為整合中心,連接財務、客戶關係管理 (CRM) 和人力資源 (HR) 系統,使得計劃管理軟體系統在企業架構中的重要性日益凸顯。預計到 2025 年,SaaS 整合市場規模將超過 150 億美元,而擁有全面整合策略的公司生產力提高了 30%。雲端原生供應商憑藉開放的 API 和預先建置的連接器獲得優勢,從而減少了對昂貴的客製化編碼的需求。
遺留資產的遷移和定製成本很高
由於資料映射、檢驗和使用者培訓需要耗費大量人力,企業面臨的實施成本可能高達許可費的三倍。遷移成本平均可能比許可費高出 30%,每Terabyte存檔資料的成本可達 15,000 美元。這項障礙會減緩更新週期,並降低計劃管理軟體系統在擁有高度客製化工作流程的現有企業中的市場滲透率。
細分市場分析
到2025年,雲端採用將佔總營收的74.20%,而混合配置將在計劃管理軟體系統市場中展現出最強勁的成長勢頭,年複合成長率將達到18.12%。混合解決方案將本機儲存庫與雲端工作空間同步,這種雙重特性正吸引受資料居住法規約束的企業。本地部署解決方案在政府和國防領域依然存在,但隨著雲端區域安全認證日益嚴格,其市場佔有率正在萎縮。
混合模式的興起反映了用於管理無縫離線同步、加密隧道和選擇性儲存的工具的進步。建設公司將圖紙儲存在本地伺服器上,同時透過雲端控制面板共用現場更新資訊。供應商透過提供精細化的租戶控制和圍繞合規性來提升銷售路徑來脫穎而出。
到2025年,大型企業將佔專案管理軟體支出的60.35%,而中小企業的複合年成長率將達到16.89%,這將徹底改變計劃管理軟體市場的規模。成長主要集中在亞太地區,當地政府正在資助數位技能發展津貼。日本的中小企業正在採用人工智慧輔助的日程安排來應對勞動力短缺問題。價格層級中最低用戶數量的取消降低了市場進入門檻。
隨著大型企業在市場飽和地區的成長趨於平緩,供應商開始推出中小企業的精簡版產品和社群活動。然而,跨國公司仍然是重要的收入來源,這主要得益於其複雜的整合和高階分析軟體包。這種雙重需求為產品團隊帶來了挑戰:如何在保持擴充性的同時,避免增加實施流程的複雜性。
區域分析
預計到2025年,北美將佔據計劃管理軟體系統市場36.12%的佔有率。該地區的企業憑藉強大的基礎設施和大規模的IT預算,部署端到端的計劃生態系統。微軟在2024年實現了16%的營收成長,達到2,450億美元,主要得益於Microsoft 365中整合的計劃管理功能。創新中心仍在持續開發人工智慧模組,但隨著市場應用接近飽和,區域成長速度正在放緩。
預計到2031年,亞太地區的複合年成長率將達到16.06%,是全球成長最快的地區。中國的SaaS市場正以每年約30%的速度成長,跨國公司紛紛採用整合的Salesforce和Azure技術堆疊來管理跨國專案。在雲端運算普及和Start-Ups企業蓬勃發展的推動下,印度的SaaS收入預計將從2023年的71.8億美元成長到2032年的629.3億美元。東南亞各地的中小企業正在採用符合當地合規標準的在地化專案管理套件。
在歐洲,隨著GDPR強制要求在地化能力,提供歐盟資料中心和進階加密技術的供應商正經歷穩定成長。在南美和中東/非洲,寬頻和支付基礎設施的改善推動了雲端訂閱用戶的成長,此前由於基礎設施不足而受到阻礙。隨著連接成本的持續下降,供應商預計將實現兩位數的成長。
其他福利:
- Excel格式的市場預測(ME)表
- 分析師支持(3個月)
目錄
第1章 引言
- 研究假設和市場定義
- 調查範圍
第2章調查方法
第3章執行摘要
第4章 市場情勢
- 市場概覽
- 市場促進因素
- 遠端和混合企劃團隊的雲端優先採用
- 將您的專案管理平台與企業級 SaaS 堆疊整合
- 低程式碼/無程式碼可配置性推動了中小企業的採用。
- 人工智慧驅動的進度和成本偏差預測分析
- 行業專用計劃管理套件(例如,建設業、醫療產業)
- 將ESG合規報告嵌入計劃工作流程
- 市場限制
- 遺留資產的遷移和定製成本很高
- 多租戶雲端中的資料主權和隱私問題
- 功能商品化導致供應商鎖定風險增加
- 變革管理疲勞會阻礙大規模採用
- 關鍵法規結構評估
- 產業價值鏈分析
- 技術展望
- 波特五力分析
- 供應商的議價能力
- 買方的議價能力
- 新進入者的威脅
- 替代品的威脅
- 競爭對手之間的競爭
- 關鍵相關人員影響評估
- 主要用例和案例研究
- 宏觀經濟因素對市場的影響
- 投資分析
第5章 市場區隔
- 透過部署
- 雲
- 本地部署
- 按組織規模
- 主要企業
- 小型企業
- 按最終用戶行業分類
- 資訊科技和電信
- 衛生保健
- 建築和基礎設施
- BFSI
- 政府和公共部門
- 製造業
- 其他
- 按合約類型
- 月度訂閱
- 年度訂閱
- 一次許可證
- 按地區
- 北美洲
- 美國
- 加拿大
- 墨西哥
- 南美洲
- 巴西
- 阿根廷
- 南美洲其他地區
- 歐洲
- 英國
- 德國
- 法國
- 義大利
- 西班牙
- 北歐國家
- 其他歐洲地區
- 中東和非洲
- 中東
- 沙烏地阿拉伯
- 阿拉伯聯合大公國
- 土耳其
- 其他中東地區
- 非洲
- 南非
- 埃及
- 奈及利亞
- 其他非洲地區
- 中東
- 亞太地區
- 中國
- 印度
- 日本
- 韓國
- ASEAN
- 澳洲
- 紐西蘭
- 亞太其他地區
- 北美洲
第6章 競爭情勢
- 市場集中度
- 策略趨勢
- 市佔率分析
- 公司簡介
- Adobe Inc.(Workfront)
- AEC Software Inc.
- Asana Inc.
- Atlassian Corporation PLC
- Basecamp LLC
- Broadcom Inc.(Clarity PPM)
- ClickUp(Mango Technologies, Inc.)
- Microsoft Corporation
- Monday.com Ltd.
- Oracle Corporation
- Planview Inc.
- Procore Technologies Inc.
- SAP SE
- ServiceNow Inc.
- Smartsheet Inc.
- Teamwork.com Ltd.
- Trello Enterprise(Atlassian)
- Unit4 NV
- Wrike Inc.(Citrix Systems)
- Zoho Corporation Pvt Ltd.
第7章 市場機會與未來展望
The project management software systems market was valued at USD 9.76 billion in 2025 and estimated to grow from USD 11.27 billion in 2026 to reach USD 23.09 billion by 2031, at a CAGR of 15.42% during the forecast period (2026-2031).
Expansion remains anchored in cloud-first deployment, low-code configurability, and predictive analytics that collectively upgrade project oversight from task tracking to strategic orchestration. Demand intensifies as distributed teams require real-time collaboration, and enterprises integrate project data with finance, HR, and customer systems for unified visibility. Hybrid deployment registers the fastest growth because regulated industries still need local data control. Small and medium enterprises (SMEs) accelerate adoption by bypassing traditional implementation hurdles, while AI-native features strengthen risk management and cost forecasting. Competitive intensity increases as vendors embed industry-specific workflows and open API ecosystems.
Global Project Management Software Systems Market Trends and Insights
Cloud-First Adoption for Remote and Hybrid Project Teams
Organizations report 54% faster task completion when shifting from desktop tools to cloud-native platforms. The project management software systems market gains traction because real-time synchronization enables distributed teams to sustain momentum across time zones. IT departments prefer cloud scalability that removes capacity planning burdens. Hybrid models are projected to grow at an 18.4% CAGR because regulated sectors balance accessibility with data control. Vendors respond by offering data-residency options that satisfy sovereignty mandates while maintaining friction-free collaboration.
Integration of PM Platforms with Enterprise SaaS Stacks
Enterprises run an average of 976 applications, yet only 28% are meaningfully integrated, stalling project data flow. Modern platforms position themselves as integration hubs tied to finance, CRM, and HR systems, thereby increasing the relevance of project management software systems in enterprise architecture. The SaaS integration segment is projected to exceed USD 15 billion by 2025, and firms that deploy comprehensive integration strategies report 30% productivity lifts. Cloud-native vendors gain an advantage through open APIs and pre-built connectors, which reduce the need for expensive custom coding.
High Migration and Customization Costs for Legacy Estates
Enterprises face implementation bills that triple license fees because data mapping, validation, and user training are labor-intensive. Migration overruns average 30% and can reach USD 15,000 per terabyte of archives. The hurdle delays refresh cycles and slows the project management software systems market uptake among incumbents with heavily customized workflows.
Other drivers and restraints analyzed in the detailed report include:
- SME Uptake Boosted by Low-Code / No-Code Configurability
- AI-Driven Predictive Analytics for Schedule and Cost Variance
- Data-Sovereignty and Privacy Concerns in Multi-Tenant Clouds
For complete list of drivers and restraints, kindly check the Table Of Contents.
Segment Analysis
Cloud deployment accounted for 74.20% of revenue in 2025, but hybrid configurations grew at an 18.12% CAGR, signaling the strongest momentum within the project management software systems market. Hybrid solutions synchronize local repositories with cloud workspaces; this duality attracts firms bound by data residency statutes. On-premise solutions persist in government and defense, yet their share is shrinking as security certifications for cloud zones become tighter.
The hybrid rise reflects tools that now manage seamless offline sync, encrypted tunnels, and selective storage. Construction companies store drawings on local servers while sharing field updates through cloud dashboards. Vendors differentiate by offering granular tenancy controls, creating upsell paths around compliance.
Large enterprises controlled 60.35% of the 2025 spend, but SMEs chart a 16.89% CAGR, reshaping the project management software systems market size trajectory. Growth centers on the Asia-Pacific region, where local governments are funding digital upskilling grants. Japanese SMEs adopt AI-assisted scheduling to offset labor shortages. Pricing tiers remove user minimums, reducing the barrier to entry.
Enterprise growth plateaus in saturated regions, so vendors launch light editions and community events geared to smaller firms. Yet, multi-national corporations still anchor revenue with complex integrations and premium analytics bundles. Dual focus forces product teams to maintain scalability without complicating the onboarding process.
The Project Management Software Systems Market Report is Segmented by Deployment (Cloud and On-Premise), Organization Size (Large Enterprises, and Small and Medium Enterprises), End-User Industry (IT and Telecom, Healthcare, and More), Subscription Type (Monthly Subscription, Annual Subscription, and One-Time License), and Geography (North America, Europe, and More). The Market Forecasts are Provided in Terms of Value (USD).
Geography Analysis
North America held 36.12% of the project management software systems market in 2025. Enterprises there leverage robust infrastructure and sizable IT budgets to roll out end-to-end project ecosystems. Microsoft recorded 16% revenue growth to USD 245 billion in 2024, supported by integrated project functions within Microsoft 365. Innovation hubs continue to pioneer AI modules, yet regional growth moderates as penetration nears saturation.
Asia-Pacific grows at a 16.06% CAGR through 2031, the fastest across regions. China's SaaS segment is expanding at nearly 30% annually, with multinationals installing integrated Salesforce and Azure stacks to manage cross-border initiatives. India's SaaS revenue is forecast to increase from USD 7.18 billion in 2023 to USD 62.93 billion by 2032, driven by cloud adoption and startup momentum. SMEs across Southeast Asia adopt local-language PM suites that embed regional compliance norms.
Europe posts steady gains as GDPR compels localization features, rewarding vendors offering EU data centers and advanced encryption. South America, and Middle East, and Africa are now improving broadband and payment rails, nurturing cloud subscriptions previously held back by infrastructure gaps. Vendors anticipate double-digit uptake once connectivity costs fall further.
- Adobe Inc. (Workfront)
- AEC Software Inc.
- Asana Inc.
- Atlassian Corporation PLC
- Basecamp LLC
- Broadcom Inc. (Clarity PPM)
- ClickUp (Mango Technologies, Inc.)
- Microsoft Corporation
- Monday.com Ltd.
- Oracle Corporation
- Planview Inc.
- Procore Technologies Inc.
- SAP SE
- ServiceNow Inc.
- Smartsheet Inc.
- Teamwork.com Ltd.
- Trello Enterprise (Atlassian)
- Unit4 N.V.
- Wrike Inc. (Citrix Systems)
- Zoho Corporation Pvt Ltd.
Additional Benefits:
- The market estimate (ME) sheet in Excel format
- 3 months of analyst support
TABLE OF CONTENTS
1 INTRODUCTION
- 1.1 Study Assumptions and Market Definition
- 1.2 Scope of the Study
2 RESEARCH METHODOLOGY
3 EXECUTIVE SUMMARY
4 MARKET LANDSCAPE
- 4.1 Market Overview
- 4.2 Market Drivers
- 4.2.1 Cloud-First Adoption for Remote and Hybrid Project Teams
- 4.2.2 Integration of PM Platforms with Enterprise SaaS Stacks
- 4.2.3 SME Uptake Boosted by Low-Code / No-Code Configurability
- 4.2.4 AI-Driven Predictive Analytics for Schedule and Cost Variance
- 4.2.5 Vertical-Specific PM Suites (e.g., Construction, Healthcare)
- 4.2.6 ESG Compliance Reporting Embedded in Project Workflows
- 4.3 Market Restraints
- 4.3.1 High Migration and Customization Costs for Legacy Estates
- 4.3.2 Data-Sovereignty and Privacy Concerns in Multi-Tenant Clouds
- 4.3.3 Feature Commoditization Heightening Vendor-Lock-in Risk
- 4.3.4 Change-Management Fatigue Curbing Large-Scale Roll-Outs
- 4.4 Evaluation of Critical Regulatory Framework
- 4.5 Industry Value Chain Analysis
- 4.6 Technological Outlook
- 4.7 Porter's Five Forces Analysis
- 4.7.1 Bargaining Power of Suppliers
- 4.7.2 Bargaining Power of Buyers
- 4.7.3 Threat of New Entrants
- 4.7.4 Threat of Substitutes
- 4.7.5 Competitive Rivalry
- 4.8 Impact Assessment of Key Stakeholders
- 4.9 Key Use Cases and Case Studies
- 4.10 Impact on Macroeconomic Factors of the Market
- 4.11 Investment Analysis
5 MARKET SEGMENTATION
- 5.1 By Deployment
- 5.1.1 Cloud
- 5.1.2 On-premise
- 5.2 By Organization Size
- 5.2.1 Large Enterprises
- 5.2.2 Small and Medium Enterprises
- 5.3 By End-user Industry
- 5.3.1 IT and Telecom
- 5.3.2 Healthcare
- 5.3.3 Construction and Infrastructure
- 5.3.4 BFSI
- 5.3.5 Government and Public Sector
- 5.3.6 Manufacturing
- 5.3.7 Others
- 5.4 By Subscription Type
- 5.4.1 Monthly Subscription
- 5.4.2 Annual Subscription
- 5.4.3 One-time License
- 5.5 By Geography
- 5.5.1 North America
- 5.5.1.1 United States
- 5.5.1.2 Canada
- 5.5.1.3 Mexico
- 5.5.2 South America
- 5.5.2.1 Brazil
- 5.5.2.2 Argentina
- 5.5.2.3 Rest of South America
- 5.5.3 Europe
- 5.5.3.1 United Kingdom
- 5.5.3.2 Germany
- 5.5.3.3 France
- 5.5.3.4 Italy
- 5.5.3.5 Spain
- 5.5.3.6 Nordics
- 5.5.3.7 Rest of Europe
- 5.5.4 Middle East and Africa
- 5.5.4.1 Middle East
- 5.5.4.1.1 Saudi Arabia
- 5.5.4.1.2 United Arab Emirates
- 5.5.4.1.3 Turkey
- 5.5.4.1.4 Rest of Middle East
- 5.5.4.2 Africa
- 5.5.4.2.1 South Africa
- 5.5.4.2.2 Egypt
- 5.5.4.2.3 Nigeria
- 5.5.4.2.4 Rest of Africa
- 5.5.4.1 Middle East
- 5.5.5 Asia-Pacific
- 5.5.5.1 China
- 5.5.5.2 India
- 5.5.5.3 Japan
- 5.5.5.4 South Korea
- 5.5.5.5 ASEAN
- 5.5.5.6 Australia
- 5.5.5.7 New Zealand
- 5.5.5.8 Rest of Asia-Pacific
- 5.5.1 North America
6 COMPETITIVE LANDSCAPE
- 6.1 Market Concentration
- 6.2 Strategic Moves
- 6.3 Market Share Analysis
- 6.4 Company Profiles (includes Global level Overview, Market level overview, Core Segments, Financials as available, Strategic Information, Market Rank/Share for key companies, Products and Services, and Recent Developments)
- 6.4.1 Adobe Inc. (Workfront)
- 6.4.2 AEC Software Inc.
- 6.4.3 Asana Inc.
- 6.4.4 Atlassian Corporation PLC
- 6.4.5 Basecamp LLC
- 6.4.6 Broadcom Inc. (Clarity PPM)
- 6.4.7 ClickUp (Mango Technologies, Inc.)
- 6.4.8 Microsoft Corporation
- 6.4.9 Monday.com Ltd.
- 6.4.10 Oracle Corporation
- 6.4.11 Planview Inc.
- 6.4.12 Procore Technologies Inc.
- 6.4.13 SAP SE
- 6.4.14 ServiceNow Inc.
- 6.4.15 Smartsheet Inc.
- 6.4.16 Teamwork.com Ltd.
- 6.4.17 Trello Enterprise (Atlassian)
- 6.4.18 Unit4 N.V.
- 6.4.19 Wrike Inc. (Citrix Systems)
- 6.4.20 Zoho Corporation Pvt Ltd.
7 MARKET OPPORTUNITIES AND FUTURE OUTLOOK
- 7.1 White-space and Unmet-need Assessment
 計劃合管理市場報告:按組件、解決方案類型、部署模式、組織規模、產業和地區分類(2026-2034 年)
 專案組合管理市場規模、佔有率、成長及全球產業分析:按類型、應用和地區分類的洞察,2026-2034 年預測
 2026年全球計劃合管理市場報告
 計劃合管理 (PPM) 市場分析及至 2035 年預測:按類型、產品類型、服務、技術、組件、應用、部署類型、最終用戶、模組和功能分類全球計劃合管理市場規模、佔有率、趨勢和成長分析報告(2026-2034)
 計劃合管理市場 - 全球產業規模、佔有率、趨勢、機會及預測(按組件、部署類型、企業規模、應用、垂直產業、地區和競爭格局分類),2021-2031年日本計劃與組合管理市場報告:按組件、解決方案類型、部署類型、組織規模、產業和地區分類,2026-2034 年
 計劃合管理市場規模、佔有率和成長分析(按產品類型、部署類型、組織規模和地區分類)-2026-2033年產業預測
 計劃合管理市場:按組件、所有者、部署方式、公司規模、應用和行業分類 - 2025-2032 年全球預測
 全球計劃合管理 (PPM) 軟體市場,2025-2029