


 |
市場調查報告書
商品編碼
1852057
空氣清淨機:市場佔有率分析、行業趨勢、統計數據和成長預測(2025-2030 年)Air Purifier - Market Share Analysis, Industry Trends & Statistics, Growth Forecasts (2025 - 2030) |
||||||
※ 本網頁內容可能與最新版本有所差異。詳細情況請與我們聯繫。
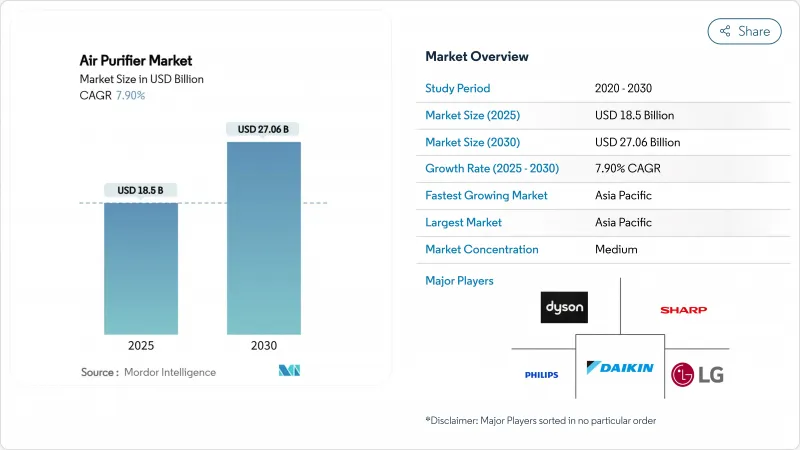
預計到 2025 年,空氣清淨機市場規模將達到 185 億美元,到 2030 年將達到 270.6 億美元,預測期(2025-2030 年)複合年成長率為 7.90%。
隨著消費者將呼吸健康、節能建築和產品品質置於優先地位,需求正從注重健康的消費轉向家庭、辦公室、醫院和半導體無塵室等關鍵基礎設施的支出。超潔淨半導體工廠的技術溢出效應、日益嚴重的城市污染預警以及疫情後人們環保意識的提高,都推動了空氣清淨機市場的穩定成長。亞太地區的成長依然強勁,這主要得益於印度的公共補貼、中國城市消費者的積極響應以及日本和韓國嚴格的空氣品質法規。智慧家庭的普及也在北美和歐洲同步推進,連網型設備在不犧牲大眾市場銷售的前提下,為市場帶來了新的淨利率。
全球空氣清淨機市場趨勢與洞察
東亞都市區新冠疫情後健康中心設備的採用情況
一項家庭調查顯示,中國主要城市62%的家庭認為空氣清淨機是必需品而非可有可無的物品。對顆粒物控制的需求以及對病原體日益成長的擔憂,推動了結合高效能空氣微粒過濾器(HEPA)和紫外線C波段(UV-C)或光催化氧化的多層解決方案的發展。對韓國2025年的分析表明,環境PM2.5濃度峰值與空氣清淨機週銷售量激增之間存在直接關聯,凸顯了室內防護需求的上升趨勢。隨著該地區智慧家庭普及率接近75%,連網設備因其即時空氣品質回饋和自主運作功能而備受青睞。
北美地區收緊PM2.5商業房地產標準(LEED v4.1)
美國擬議將PM2.5年均濃度標準從9-10µg/m3提高到9-10µg/m3,這將迫使建築物業主安裝主動淨化設備,以配合MERV等級的HVAC過濾器。一項針對37個都市區辦公大樓的實地研究表明,僅靠中央通風系統無法達到新基準值,因此促使這些辦公大樓安裝可攜式或管道式淨化設備,用於記錄顆粒物濃度並進行認證。這些合規法規反映了企業對長期環境的迫切需求,遠遠超出週期性的消費趨勢。
加州和日本的離子產生器臭氧排放法規
加州已禁止使用臭氧排放量超過0.050 ppm的空氣清淨器,這實際上淘汰了基於離子發生器的產品。日本也實施了包含多種污染物的室內空氣品質標準,帶來了類似的挑戰。製造商必須圍繞紫外線C波段或光催化階段重新設計其平台,這將增加研發成本並延長產品上市週期。
細分市場分析
儘管HEPA過濾器在2024年仍佔據空氣清淨機市場69%的佔有率,但新興的UV-C和光催化產品預計到2030年將以每年9.5%的速度成長。多級混合型空氣清淨機結合了粒狀物捕獲和殺菌光,為注重健康的消費者提供差異化產品。在國際紫外線協會會議上發布的創新技術展示了UV-C LED,該技術在不犧牲病毒去活化效果的前提下降低了能耗。光催化系統利用二氧化鈦塗層氧化惰性有機化合物,但監管機構正在密切監測其潛在的副產物。隨著這些混合型系統的規模化發展,先進過濾解決方案的空氣清淨機市場規模預計將隨著新一代健康標準的提高而成長。高階市場正在興起,醫用級性能成為標配,這將拉低基礎HEPA產品線的單件利潤率,但會增加高階產品的總收入。
由於即插即用的便利性和直覺的運作回饋,攜帶式空氣清淨機到2024年將佔據空氣清淨機市場81%的佔有率。能源模型顯示,房間級空氣清淨機達到美國疾病管制與預防中心(CDC)潔淨空氣標準時,能耗低於整組暖通空調系統改造。然而,商業整修越來越傾向於採用管道式解決方案,這種方案可以巧妙地融入現有通風管道,並減少占地面積雜物。到2030年,集中式空氣淨化系統的複合年成長率將達到8.6%,這主要得益於日益嚴格的商業建築規範。在新建築中,集中式空氣清淨機的市場規模可能與可攜式空氣清淨機趨於一致,但在老舊住宅存量中,可攜式清淨機的需求仍將保持強勁。
空氣清淨機市場報告按過濾技術(HEPA、活性碳、離子/靜電集塵器、UV-C 和光催化氧化、混合和多級系統)、類型(獨立式和管道式)、最終用戶(住宅、商業、工業)、連接方式(非智慧和智慧/物聯網)以及地區(北美、歐洲、亞太、南美、中東和非洲)進行細分。
區域分析
亞太地區將在2024年佔全球營收的44%,並在2030年之前維持9.1%的強勁複合年成長率。隨著全國PM2.5宣傳活動和消費者健康應用將空氣品質問題置於首要位置,中國一線城市的空氣清淨機普及率將超過60%。印度的國家清潔空氣計畫將為公立學校提供HEPA高效空氣過濾器,從而提振公共部門的可靠銷售,而冬季霧霾也將促進住宅銷售。日本和韓國目前優先考慮病毒惰性和智慧家居整合,這促使消費者轉向混合型UV-C平台。
北美仍然是一個規模龐大且技術嫻熟的市場。加州的臭氧法規限制了帽式離子產生器的銷售,但也推動了光催化氧化和先進HEPA等更安全技術的發展。美國的平均售價位居世界最高,反映出其大力推廣應用程式主導模式,以及為獲得LEED v4.1認證而對企業健康設施的投入。加拿大也呈現類似的趨勢,但暖氣季的能源成本促使人們更加關注節能設計。
在歐洲,消費者的偏好各不相同。北歐消費者優先考慮能源效率等級和靜音運行,而地中海地區的消費者則更關注過敏原和野火煙霧。歐盟的「近零能耗建築指令」促使人們更加依賴高效能空氣清淨器,以彌補較低的空氣交換率和更嚴格的建築圍護結構要求。東歐的成長落後於西歐,但隨著都市區霧霾引發大眾意識提升提升,東歐的成長將會復甦。在中東和非洲,海灣合作理事會國家的大型酒店計劃將推動高階產品的需求,而不斷成長的可支配收入和經濟高效的過濾器供應鏈將促進空氣清淨機的更廣泛應用。
其他福利:
- Excel格式的市場預測(ME)表
- 3個月的分析師支持
目錄
第1章 引言
- 研究假設和市場定義
- 調查範圍
第2章調查方法
第3章執行摘要
第4章 市場情勢
- 市場概覽
- 市場促進因素
- 在東亞大都會地區分發新冠疫情後以健康為重點的設備
- 北美地區收緊PM2.5商業房地產標準(LEED v4.1)
- 美國和韓國正在提高半導體潔淨室的生產能力。
- 歐盟和美國對智慧家庭整合和連網水質淨化的需求日益成長
- 海灣合作理事會地區以環境、社會和治理(ESG)主導的酒店業發展
- 印度國家清潔空氣計畫(NCAP)為公立學校提供HEPA空氣清淨機補貼
- 市場限制
- 加州和日本的離子產生器臭氧排放法規
- 東協大眾市場對濾芯更換成本高度敏感
- 消費者對CADR聲明的懷疑:缺乏統一的測試通訊協定
- 大型辦公室對暖通空調管道過濾器和獨立式過濾器的需求下降
- 供應鏈分析
- 監理展望
- 技術展望
- 波特五力分析
- 供應商的議價能力
- 買方的議價能力
- 新進入者的威脅
- 替代品的威脅
- 競爭對手之間的競爭
第5章 市場規模與成長預測
- 透過過濾技術
- HEPA
- 活性碳
- 離子/靜電分離器
- 紫外光和光催化氧化
- 混合/多層次系統
- 按類型
- 獨立式/可攜式
- 管道式/中央空調
- 連結性別
- 非智慧型(手動/類比)
- 智慧/物聯網功能(應用程式和語音控制)
- 最終用戶
- 住宅
- 商業(旅館及休閒、醫療設施及診所、教育機構、公司辦公室及零售)
- 工業(製造/倉儲、食品/飲料加工、製藥/無塵室、資料中心/伺服器機房)
- 按地區
- 北美洲
- 美國
- 加拿大
- 墨西哥
- 歐洲
- 英國
- 德國
- 法國
- 西班牙
- 北歐國家
- 俄羅斯
- 其他歐洲地區
- 亞太地區
- 中國
- 印度
- 日本
- 韓國
- 東南亞國協
- 澳洲
- 亞太其他地區
- 南美洲
- 巴西
- 阿根廷
- 哥倫比亞
- 其他南美洲
- 中東和非洲
- 阿拉伯聯合大公國
- 沙烏地阿拉伯
- 南非
- 埃及
- 其他中東和非洲地區
- 北美洲
第6章 競爭情勢
- 市場集中度
- 策略性舉措(併購、夥伴關係、購電協議)
- 市場佔有率分析(主要企業的市場排名/佔有率)
- 公司簡介
- Daikin Industries Ltd
- Sharp Corporation
- Dyson Ltd
- Koninklijke Philips NV
- LG Electronics Inc.
- Panasonic Corporation
- Whirlpool Corporation
- Resideo Technologies Inc.
- Samsung Electronics Co. Ltd
- Xiaomi Corp.
- Honeywell International Inc.
- IQAir AG
- Coway Co. Ltd
- Winix Inc.
- Blueair AB
- AllerAir Industries Inc.
- Airdog(IAQ Tech)
- Austin Air Systems Ltd
- Kent RO Systems Ltd
- TruSens(ACCO Brands)
- Medify Air LLC
第7章 市場機會與未來展望
The Air Purifier Market size is estimated at USD 18.5 billion in 2025, and is expected to reach USD 27.06 billion by 2030, at a CAGR of 7.90% during the forecast period (2025-2030).
Demand has shifted from wellness-oriented purchases to critical infrastructure spending in homes, offices, hospitals, and semiconductor cleanrooms as users prioritize respiratory health, energy-efficient buildings, and production quality. Technology spillovers from ultra-clean semiconductor fabs, rising urban pollution alerts, and intensifying post-pandemic awareness keep the air purifier market on a steady expansion path. Regional growth remains most pronounced in Asia-Pacific thanks to public subsidies in India, urban consumer sentiment in China, and stringent air-quality mandates in Japan and South Korea. Parallel momentum comes from smart-home adoption in North America and Europe, where connected devices unlock new margins without sacrificing volume at the mass-market tier.
Global Air Purifier Market Trends and Insights
Post-COVID health-centric device adoption in East Asian metros
Household surveys indicate that 62% of families in large Chinese cities now view air purifiers as essential goods rather than discretionary items. Convergence of particulate-control needs with heightened pathogen concerns drives multi-stage solutions that blend HEPA with UV-C or photocatalytic oxidation. South Korean analyses for 2025 show a direct correlation between ambient PM2.5 peaks and weekly purifier sales spikes, underscoring the behavioral pivot toward indoor protection. As smart-home penetration in the region nears 75%, connected units gain preference for real-time air-quality feedback and automated operation.
Stricter PM2.5 commercial real-estate standards in North America (LEED v4.1)
The proposed revision of the US annual PM2.5 standard to 9-10 µg/m3 pressures building owners to install active purification that supplements MERV-rated HVAC filters. Field studies of 37 urban offices show that centralized ventilation alone falls short of emerging thresholds, prompting uptake of portable or in-duct purifiers that log particulate levels for certification audits. These compliance imperatives sustain institutional demand well beyond cyclical consumer trends.
Ozone-emission restrictions on ionizers in California & Japan
California forbids air cleaner that releases more than 0.050 ppm ozone, effectively sidelining ionizer-centric products. Japan enforces multi-pollutant indoor guidelines that create similar hurdles. Manufacturers must redesign platforms around UV-C or photocatalytic stages, lifting R&D expenditure and elongating launch cycles.
Other drivers and restraints analyzed in the detailed report include:
- Semiconductor clean-room capacity build-out in the United States & South Korea
- Smart-home integration pull for connected purifiers in Europe & United States
- High filter-replacement cost sensitivity in ASEAN mass market
For complete list of drivers and restraints, kindly check the Table Of Contents.
Segment Analysis
HEPA maintained a 69% air purifier market share in 2024, yet emerging UV-C and photocatalytic products are expected to expand at 9.5% annually through 2030. Multi-stage hybrids pair particulate capture with germicidal light, creating differentiated offerings for health-conscious buyers. Innovations unveiled at the International Ultraviolet Association conference reveal UV-C LEDs that cut power draw without sacrificing virus inactivation. Photocatalytic systems leverage titanium dioxide coatings to oxidize volatile organics, though regulators keep watch on potential by-products. As these hybrid systems scale, the air purifier market size for advanced filtration solutions is projected to climb with next-generation health standards. A premium tier emerges where medical-grade performance becomes the norm, pushing down per-unit margins in basic HEPA lines but raising the total revenue pool at the high end.
Thanks to plug-and-play convenience and visible operation feedback, portable devices accounted for 81% of the air purifier market in 2024. Energy models show room-level purifiers meet CDC clean-air targets with less power than full HVAC overhauls. Commercial renovations, however, increasingly favor in-duct solutions that tuck neatly into existing ventilation paths and reduce floor-space clutter. Centralized systems are advancing at an 8.6% CAGR to 2030, reinforced by stricter commercial building codes. The air purifier market size for centralized installations will likely approach parity with portable volume in new builds, though replacement cycles keep portable demand resilient in mature housing stock.
The Air Purifier Market Report is Segmented by Filtration Technology (HEPA, Activated Carbon, Ionic/Electrostatic Precipitators, UV-C and Photocatalytic Oxidation, and Hybrid and Multi-Stage Systems), Type (Stand-Alone and In-Duct), End User (Residential, Commercial, and Industrial), Connectivity (Non-Smart and Smart/IoT-Enabled ), and Geography (North America, Europe, Asia-Pacific, South America, and Middle East and Africa).
Geography Analysis
Asia-Pacific commanded 44% of global revenue in 2024 and is moving at a robust 9.1% CAGR to 2030. China's top-tier cities log penetration rates above 60% as national PM2.5 campaigns and consumer health apps keep air quality top of mind. India funds HEPA units for public schools through its National Clean Air Programme, injecting reliable public-sector volume while residential sales climb during winter haze episodes. Japan and South Korea now prioritize virus deactivation and smart-home integration, steering buyers toward hybrid UV-C platforms.
North America remains a large, tech-savvy arena. California's ozone limits cap ionizer sales but spurs safer technologies such as photocatalytic oxidation and advanced HEPA. The United States is home to the world's highest average selling prices, reflecting a strong uptake of app-driven models and corporate wellness investments in offices aiming for LEED v4.1. Canada follows similar patterns, but heating-season energy costs sharpen the focus on power-efficient designs.
Europe shows granular preferences. Nordic consumers value energy labels and silent modes, whereas Mediterranean buyers focus on allergens and wildfire smoke. EU directives on Nearly Zero Energy Buildings keep air-change rates low, increasing reliance on high-efficiency purifiers to offset tighter building envelopes. Growth in Eastern Europe trails Western Europe but picks up as urban smog triggers public awareness campaigns. In the Middle East and Africa, GCC hospitality megaprojects create pockets of premium demand, while broader uptake hinges on disposable income gains and cost-effective filter supply chains.
- Daikin Industries Ltd
- Sharp Corporation
- Dyson Ltd
- Koninklijke Philips N.V.
- LG Electronics Inc.
- Panasonic Corporation
- Whirlpool Corporation
- Resideo Technologies Inc.
- Samsung Electronics Co. Ltd
- Xiaomi Corp.
- Honeywell International Inc.
- IQAir AG
- Coway Co. Ltd
- Winix Inc.
- Blueair AB
- AllerAir Industries Inc.
- Airdog (IAQ Tech)
- Austin Air Systems Ltd
- Kent RO Systems Ltd
- TruSens (ACCO Brands)
- Medify Air LLC
Additional Benefits:
- The market estimate (ME) sheet in Excel format
- 3 months of analyst support
TABLE OF CONTENTS
1 Introduction
- 1.1 Study Assumptions & Market Definition
- 1.2 Scope of the Study
2 Research Methodology
3 Executive Summary
4 Market Landscape
- 4.1 Market Overview
- 4.2 Market Drivers
- 4.2.1 Post-COVID Health-Centric Device Adoption in East Asian Metros
- 4.2.2 Stricter PM2.5 Commercial Real-Estate Standards in North America (LEED v4.1)
- 4.2.3 Semiconductor Clean-room Capacity Build-out in the US & South Korea
- 4.2.4 Smart-Home Integration Pull for Connected Purifiers in EU & US
- 4.2.5 ESG-Driven Hospitality Upgrades across GCC Countries
- 4.2.6 Indian NCAP Subsidies for HEPA Purifiers in Public Schools
- 4.3 Market Restraints
- 4.3.1 Ozone-Emission Restrictions on Ionizers in California & Japan
- 4.3.2 High Filter Replacement Cost Sensitivity in ASEAN Mass Market
- 4.3.3 Consumer Skepticism on CADR Claims-Lack of Unified Test Protocol
- 4.3.4 HVAC In-duct Filtration Diluting Stand-alone Unit Demand in Large Offices
- 4.4 Supply-Chain Analysis
- 4.5 Regulatory Outlook
- 4.6 Technological Outlook
- 4.7 Porter's Five Forces Analysis
- 4.7.1 Bargaining Power of Suppliers
- 4.7.2 Bargaining Power of Buyers
- 4.7.3 Threat of New Entrants
- 4.7.4 Threat of Substitutes
- 4.7.5 Intensity of Competitive Rivalry
5 Market Size & Growth Forecasts
- 5.1 By Filtration Technology
- 5.1.1 HEPA
- 5.1.2 Activated Carbon
- 5.1.3 Ionic/Electrostatic Precipitators
- 5.1.4 UV-Cand Photocatalytic Oxidation
- 5.1.5 Hybrid and Multi-stage Systems
- 5.2 By Type
- 5.2.1 Stand-alone/Portable
- 5.2.2 In-duct/Central HVAC
- 5.3 By Connectivity
- 5.3.1 Non-Smart (Manual/Analog)
- 5.3.2 Smart/IoT-Enabled (App and Voice Controlled)
- 5.4 By End User
- 5.4.1 Residential
- 5.4.2 Commercial (Hospitality and Leisure, Healthcare Facilities and Clinics, Educational Institutions and Corporate Offices and Retail)
- 5.4.3 Industrial (Manufacturing and Warehousing, Food and Beverage Processing, Pharmaceuticals and Clean-rooms and Data Centers and Server Rooms)
- 5.5 By Geography
- 5.5.1 North America
- 5.5.1.1 United States
- 5.5.1.2 Canada
- 5.5.1.3 Mexico
- 5.5.2 Europe
- 5.5.2.1 United Kingdom
- 5.5.2.2 Germany
- 5.5.2.3 France
- 5.5.2.4 Spain
- 5.5.2.5 Nordic Countries
- 5.5.2.6 Russia
- 5.5.2.7 Rest of Europe
- 5.5.3 Asia-Pacific
- 5.5.3.1 China
- 5.5.3.2 India
- 5.5.3.3 Japan
- 5.5.3.4 South Korea
- 5.5.3.5 ASEAN Countries
- 5.5.3.6 Australia
- 5.5.3.7 Rest of Asia-Pacific
- 5.5.4 South America
- 5.5.4.1 Brazil
- 5.5.4.2 Argentina
- 5.5.4.3 Colombia
- 5.5.4.4 Rest of South America
- 5.5.5 Middle East and Africa
- 5.5.5.1 United Arab Emirates
- 5.5.5.2 Saudi Arabia
- 5.5.5.3 South Africa
- 5.5.5.4 Egypt
- 5.5.5.5 Rest of Middle East and Africa
- 5.5.1 North America
6 Competitive Landscape
- 6.1 Market Concentration
- 6.2 Strategic Moves (M&A, Partnerships, PPAs)
- 6.3 Market Share Analysis (Market Rank/Share for key companies)
- 6.4 Company Profiles (includes Global level Overview, Market level overview, Core Segments, Financials as available, Strategic Information, Products & Services, and Recent Developments)
- 6.4.1 Daikin Industries Ltd
- 6.4.2 Sharp Corporation
- 6.4.3 Dyson Ltd
- 6.4.4 Koninklijke Philips N.V.
- 6.4.5 LG Electronics Inc.
- 6.4.6 Panasonic Corporation
- 6.4.7 Whirlpool Corporation
- 6.4.8 Resideo Technologies Inc.
- 6.4.9 Samsung Electronics Co. Ltd
- 6.4.10 Xiaomi Corp.
- 6.4.11 Honeywell International Inc.
- 6.4.12 IQAir AG
- 6.4.13 Coway Co. Ltd
- 6.4.14 Winix Inc.
- 6.4.15 Blueair AB
- 6.4.16 AllerAir Industries Inc.
- 6.4.17 Airdog (IAQ Tech)
- 6.4.18 Austin Air Systems Ltd
- 6.4.19 Kent RO Systems Ltd
- 6.4.20 TruSens (ACCO Brands)
- 6.4.21 Medify Air LLC
7 Market Opportunities & Future Outlook
- 7.1 White-space & Unmet-Need Assessment
 空氣清淨機市場:2026-2032年全球市場預測(依類型、技術、功能、應用、最終用途及銷售管道)煙氣收集器和煙霧收集設備市場:2026-2032年全球市場預測(按產品類型、終端用戶產業、安裝配置、風量和濾材)電子空氣清淨機和空氣清潔設備市場:依產品類型、技術、最終用戶和通路分類-2026-2032年全球市場預測空氣消毒淨化設備市場:依技術類型、產品類型、功能類型、最終用途和銷售管道分類-2026-2032年全球預測
 美國空氣清淨機市場:市場規模、佔有率和趨勢分析(按技術、銷售管道、類型、覆蓋範圍、應用和州分類),基於細分市場的預測(2026-2033 年)天花板式排煙系統市場:按過濾器類型、氣流、分配管道、應用和最終用戶產業分類,全球預測,2026-2032年
 光催化空氣清淨機市場分析及預測(至2035年):依類型、產品類型、技術、組件、應用、材質、設備、最終用戶及功能分類
 2026年全球空氣清淨機市場報告
 全球甲醛去除空氣清淨機市場分析及預測(至2031年)空氣清淨機市場規模、佔有率和趨勢分析報告:按技術、應用、覆蓋範圍、銷售管道、類型、地區和細分市場預測(2026-2033 年)