


 |
市場調查報告書
商品編碼
1773243
空氣清淨機市場機會、成長動力、產業趨勢分析及2025-2034年預測Air Purifier Market Opportunity, Growth Drivers, Industry Trend Analysis, and Forecast 2025 - 2034 |
||||||
2024年,全球空氣清淨機市場規模達1,66億美元,預計2034年將以8.5%的複合年成長率成長,達到374億美元。人們對室內外空氣品質的日益關注,尤其是在城市地區,正在加速空氣淨化系統的需求。大眾對污染空氣對健康(包括呼吸系統疾病和心血管疾病)影響的認知不斷提高,也推動了空氣淨化系統的需求成長。都市化進程加快、技術創新和可支配收入的成長進一步推動了空氣清淨機的普及。消費者越來越注重改善室內環境,尤其是在交通、建築和工業排放污染嚴重的城市。具有自動設定和基於應用程式控制功能的智慧空氣清淨機正日益受到青睞,以滿足現代生活方式的偏好。
注重健康的消費者將乾淨的空氣放在首位,空氣清淨機正成為已開發地區和發展中地區必不可少的家用電器。隨著人們越來越意識到不良室內空氣品質的健康風險,例如呼吸道感染、過敏、氣喘以及長期暴露於空氣污染物,消費者正在積極投資確保更安全生活環境的解決方案。城市居民開始使用空氣清淨機對抗交通排放、工業活動和建築粉塵造成的污染物水平上升。在新興經濟體,中產階級的壯大和可支配收入的增加,推動了對經濟實惠且高效的空氣淨化系統的需求。
| 市場範圍 | |
|---|---|
| 起始年份 | 2024 |
| 預測年份 | 2025-2034 |
| 起始值 | 166億美元 |
| 預測值 | 374億美元 |
| 複合年成長率 | 8.5% |
HEPA 過濾器細分市場在 2024 年以 60 億美元的規模領先市場,預計到 2034 年將以 9% 的複合年成長率成長。這些過濾器以其高達 99.97% 的效率捕捉過敏原、灰塵和微小污染物等超細顆粒而聞名。其卓越的過濾能力,包括捕獲 PM2.5 和其他有害病原體的能力,使其成為家用和商用空氣清淨機中最受歡迎的組件。基於 HEPA 的系統廣泛應用於醫療保健、飯店和教育等空氣品質控制至關重要的行業,這進一步刺激了市場需求。這些過濾器中纖維的隨機排列使其能夠高效去除空氣中的污染物,使其成為尋求長期室內空氣解決方案的消費者的理想選擇。
間接分銷通路在2024年佔據了69.1%的市場佔有率,預計到2034年將以8.3%的複合年成長率成長。消費者仍然傾向於透過離線零售店購買空氣清淨器,因為消費者可以在做出決定之前親身評估產品的功能和性能。店內展示、與銷售人員的面對面諮詢以及便利的售後服務是增強信任度和提升購買體驗的關鍵因素。這些管道還允許買家根據尺寸、濾網類型、能源效率和維護要求比較不同型號的產品。零售環境提供的觸覺體驗能夠增強消費者信心,並鼓勵他們更多地參與產品功能。
美國空氣清淨機市場在2024年佔據88.8%的市場佔有率,預計2034年將達到8.9%的強勁複合年成長率。城市霧霾和季節性野火等因素導致的室外空氣品質不佳持續影響消費者的偏好。越來越多的家庭選擇使用空氣清淨機對抗過敏原、空氣中的病毒以及室內污染物。日益惡化的環境,例如頻繁發布的煙霧相關空氣警報和花粉激增,提高了人們的空氣清淨機意識,並推動了全美範圍內空氣清淨機的普及。此外,越來越多的美國人願意投資於支持更健康生活方式的智慧家電,這進一步推動了市場擴張。
該市場的主要參與者包括 3M 公司、AVVIR、Ahlstrom-Munksjo Oyj、大金工業株式會社、三星電子、科德寶集團、派克漢尼汾公司、唐納森公司、IQAir、康斐爾公司、惠而浦公司、MAHLE GmbH、曼胡默爾集團、電裝公司和康明斯公司。為了擴大市場佔有率,領先的空氣清淨機製造商正在投資先進的過濾技術,並整合即時空氣品質監測、遠端控制和應用程式相容性等智慧功能。許多製造商正在擴展產品線,以滿足高階和精打細算的消費者的需求,同時也專注於永續過濾材料和節能系統。與家電零售商和電商平台的策略合作夥伴關係增強了分銷範圍。
目錄
第1章:方法論與範圍
第2章:執行摘要
第3章:行業洞察
- 產業生態系統分析
- 供應商格局
- 利潤率
- 每個階段的增值
- 影響價值鏈的因素
- 產業衝擊力
- 成長動力
- 產業陷阱與挑戰
- 機會
- 成長潛力分析
- 未來市場趨勢
- 技術和創新格局
- 當前的技術趨勢
- 新興技術
- 價格趨勢
- 按地區
- 按類型
- 監管格局
- 標準和合規性要求
- 區域監理框架
- 認證標準
- 波特的分析
- PESTEL分析
- 消費者行為分析
- 購買模式
- 偏好分析
- 消費者行為的區域差異
- 電子商務對購買決策的影響
第4章:競爭格局
- 介紹
- 公司市佔率分析
- 按地區
- 北美洲
- 歐洲
- 亞太地區
- 拉丁美洲
- MEA
- 按地區
- 公司矩陣分析
- 主要市場參與者的競爭分析
- 競爭定位矩陣
- 關鍵進展
- 併購
- 夥伴關係與合作
- 新產品發布
- 擴張計劃
第5章:市場估計與預測:依技術分類,2021 - 2034 年
- 主要趨勢
- HEPA 過濾器
- 活性碳過濾器
- 離子過濾器
- 紫外線過濾器
- 其他
第6章:市場估計與預測:按覆蓋區域,2021 年至 2034 年
- 主要趨勢
- 最多 300 平方英尺
- 300-600平方英尺
- 600-1000
- 超過1000平方英尺
第7章:市場估計與預測:依最終用途,2021 - 2034 年
- 主要趨勢
- 住宅
- 商業的
- 工業的
第8章:市場估計與預測:按配銷通路,2021 - 2034 年
- 主要趨勢
- 直銷
- 間接銷售
第9章:市場估計與預測:按地區,2021 - 2034 年
- 主要趨勢
- 北美洲
- 美國
- 加拿大
- 歐洲
- 英國
- 德國
- 法國
- 義大利
- 西班牙
- 俄羅斯
- 亞太地區
- 中國
- 印度
- 日本
- 韓國
- 澳洲
- 拉丁美洲
- 巴西
- 墨西哥
- MEA
- 阿拉伯聯合大公國
- 沙烏地阿拉伯
- 南非
第10章:公司簡介
- 3M Co.
- Ahlstrom-Munksjo Oyj
- AVVIR
- Camfil AB
- Cummins Inc.
- Daikin Industries Ltd.
- DENSO Corp.
- Donaldson Co. Inc.
- Freudenberg Group
- IQAir
- MAHLE GmbH
- MANN+HUMMEL Group
- Parker Hannifin Corp.
- Samsung Electronics
- Whirlpool Corporation
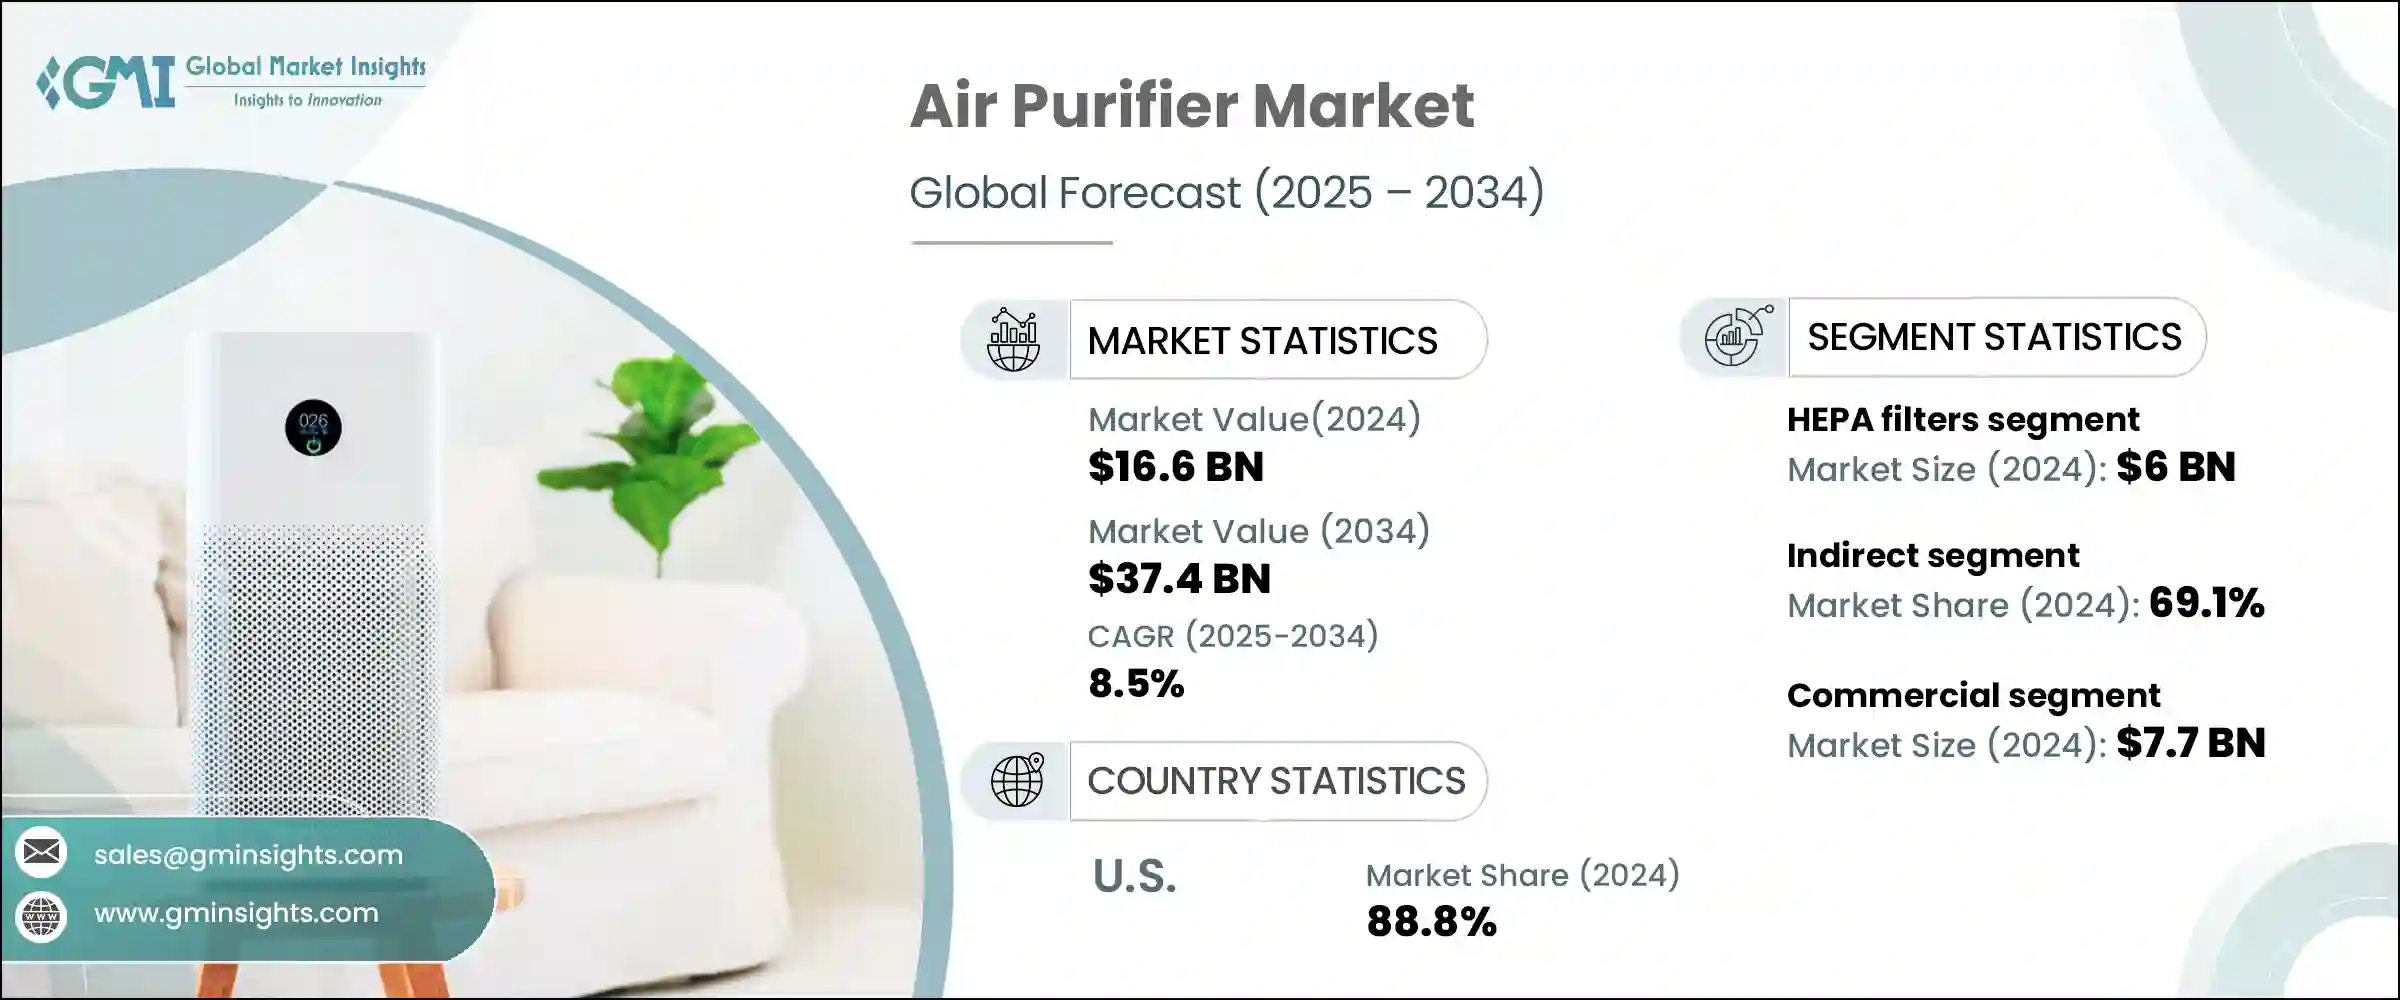
The Global Air Purifier Market was valued at USD 16.6 billion in 2024 and is estimated to grow at a CAGR of 8.5% to reach USD 37.4 billion by 2034. Rising concerns about indoor and outdoor air quality, especially in urban areas, are accelerating demand for air purification systems. This growth is supported by increasing public awareness of the health impacts of polluted air, including respiratory and cardiovascular conditions. A spike in urbanization, technological innovation, and growing disposable income is further driving product adoption. Consumers are increasingly focused on improving indoor environments, especially in cities facing high pollution from traffic, construction, and industrial emissions. Smart air purifiers with automated settings and app-based controls are gaining traction, aligning with modern lifestyle preferences.
Health-conscious consumers are prioritizing clean air, and air purifiers are becoming essential household appliances in both developed and developing regions. As awareness grows around the health risks associated with poor indoor air quality, such as respiratory infections, allergies, asthma, and long-term exposure to airborne pollutants, consumers are actively investing in solutions that ensure safer living environments. Urban dwellers are turning to air purifiers to combat the rising levels of pollutants caused by traffic emissions, industrial activity, and construction dust. In emerging economies, a growing middle class with increasing disposable income is driving demand for affordable yet efficient air purification systems.
| Market Scope | |
|---|---|
| Start Year | 2024 |
| Forecast Year | 2025-2034 |
| Start Value | $16.6 Billion |
| Forecast Value | $37.4 Billion |
| CAGR | 8.5% |
The HEPA filters segment led the market at USD 6 billion in 2024 and is forecasted to grow at a 9% CAGR through 2034. These filters are renowned for their ability to capture ultra-fine particles like allergens, dust, and microscopic pollutants with 99.97% efficiency. Their superior filtration capability, including the ability to trap PM2.5 and other harmful pathogens, has made them the most sought-after component in residential and commercial air purifiers. HEPA-based systems are used widely in sectors where air quality control is vital, such as healthcare, hospitality, and education, further boosting demand. The random fiber arrangement in these filters makes them highly effective for removing airborne contaminants, making them an ideal choice for consumers seeking long-term indoor air solutions.
The indirect distribution segment held a 69.1% share in 2024 and is expected to grow at a CAGR of 8.3% throughout 2034. Consumers continue to prefer purchasing air purifiers through offline retail stores due to the ability to physically evaluate product features and performance before deciding. In-store demonstrations, face-to-face consultation with sales staff, and access to after-sales service are key drivers that reinforce trust and ease in the buying process. These channels also allow buyers to compare various models based on size, filter types, energy efficiency, and maintenance requirements. The tactile experience offered by retail environments fosters higher consumer confidence and encourages greater engagement with product features.
U.S. Air Purifier Market held an 88.8% share in 2024 and is projected to grow a strong 8.9% CAGR through 2034. Poor outdoor air quality caused by factors like urban smog and seasonal wildfires continues to influence consumer preferences. Households are increasingly turning to air purifiers to combat allergens, airborne viruses, and pollutant exposure indoors. Worsening conditions, such as frequent smoke-related air alerts and pollen surges, have heightened awareness and driven air purifier adoption across the country. In addition, an increasing number of Americans are willing to invest in smart appliances that support a healthier lifestyle, further supporting market expansion.
Key players involved in the market include 3M Co., AVVIR, Ahlstrom-Munksjo Oyj, Daikin Industries Ltd., Samsung Electronics, Freudenberg Group, Parker Hannifin Corp., Donaldson Co. Inc., IQAir, Camfil AB, Whirlpool Corporation, MAHLE GmbH, MANN+HUMMEL Group, DENSO Corp., and Cummins Inc. To strengthen their market footprint, leading air purifier manufacturers are investing in advanced filtration technologies and integrating smart features like real-time air quality monitoring, remote control, and app compatibility. Many are expanding their product lines to cater to both premium and budget-conscious consumers, while also focusing on sustainable filter materials and energy-efficient systems. Strategic partnerships with home appliance retailers and e-commerce platforms enhance distribution reach.
Table of Contents
Chapter 1 Methodology and Scope
- 1.1 Market scope and definition
- 1.2 Research design
- 1.2.1 Research approach
- 1.2.2 Data collection methods
- 1.3 Data mining sources
- 1.3.1 Global
- 1.3.2 Regional/country
- 1.4 Base estimates and calculations
- 1.4.1 Base year calculation
- 1.4.2 Key trends for market estimation
- 1.5 Primary research and validation
- 1.5.1 Primary sources
- 1.6 Forecast model
- 1.7 Research assumptions and limitations
Chapter 2 Executive Summary
- 2.1 Industry 3600 synopsis
- 2.2 Key market trends
- 2.2.1 Regional
- 2.2.2 Technology
- 2.2.3 Coverage area
- 2.2.4 End use
- 2.2.5 Distribution channel
- 2.3 CXO perspectives: strategic imperatives
- 2.3.1 Key decision points for industry executives
- 2.3.2 Critical success factors for market players
- 2.4 Future Outlook and strategic recommendations
Chapter 3 Industry Insights
- 3.1 Industry ecosystem analysis
- 3.1.1 Supplier landscape
- 3.1.2 Profit margin
- 3.1.3 Value addition at each stage
- 3.1.4 Factor affecting the value chain
- 3.2 Industry impact forces
- 3.2.1 Growth drivers
- 3.2.2 Industry pitfalls & challenges
- 3.2.3 Opportunities
- 3.3 Growth potential analysis
- 3.4 Future market trends
- 3.5 Technology and innovation landscape
- 3.5.1 Current technological trends
- 3.5.2 Emerging technologies
- 3.6 Price trends
- 3.6.1 By region
- 3.6.2 By type
- 3.7 Regulatory landscape
- 3.7.1 Standards and compliance requirements
- 3.7.2 Regional regulatory frameworks
- 3.7.3 Certification standards
- 3.8 Porter's analysis
- 3.9 PESTEL analysis
- 3.10 Consumer behaviour analysis
- 3.10.1 Purchasing patterns
- 3.10.2 Preference analysis
- 3.10.3 Regional variations in consumer behaviour
- 3.10.4 Impact of e-commerce on buying decisions
Chapter 4 Competitive Landscape, 2024
- 4.1 Introduction
- 4.2 Company market share analysis
- 4.2.1 By region
- 4.2.1.1 North America
- 4.2.1.2 Europe
- 4.2.1.3 Asia Pacific
- 4.2.1.4 LATAM
- 4.2.1.5 MEA
- 4.2.1 By region
- 4.3 Company matrix analysis
- 4.4 Competitive analysis of major market players
- 4.5 Competitive positioning matrix
- 4.6 Key developments
- 4.6.1 Mergers & acquisitions
- 4.6.2 Partnerships & collaborations
- 4.6.3 New product launches
- 4.6.4 Expansion plans
Chapter 5 Market Estimates & Forecast, By Technology, 2021 - 2034, (USD Billion)(Thousand Units)
- 5.1 Key trends
- 5.2 HEPA filters
- 5.3 Activated carbon filters
- 5.4 Ionic filters
- 5.5 UV filters
- 5.6 Others
Chapter 6 Market Estimates & Forecast, By Coverage Area, 2021 - 2034, (USD Billion)(Thousand Units)
- 6.1 Key trends
- 6.2 Upto 300 sq ft
- 6.3 300-600 sq ft
- 6.4 600-1000
- 6.5 Above 1000sq ft
Chapter 7 Market Estimates & Forecast, By End Use, 2021 - 2034, (USD Billion)(Thousand Units)
- 7.1 Key trends
- 7.2 Residential
- 7.3 commercial
- 7.4 Industrial
Chapter 8 Market Estimates & Forecast, By Distribution Channel, 2021 - 2034, (USD Billion)(Thousand Units)
- 8.1 Key trends
- 8.2 Direct sale
- 8.3 Indirect sales
Chapter 9 Market Estimates & Forecast, By Region, 2021 - 2034, (USD Billion)(Thousand Units)
- 9.1 Key trends
- 9.2 North America
- 9.2.1 U.S.
- 9.2.2 Canada
- 9.3 Europe
- 9.3.1 UK
- 9.3.2 Germany
- 9.3.3 France
- 9.3.4 Italy
- 9.3.5 Spain
- 9.3.6 Russia
- 9.4 Asia Pacific
- 9.4.1 China
- 9.4.2 India
- 9.4.3 Japan
- 9.4.4 South Korea
- 9.4.5 Australia
- 9.5 Latin America
- 9.5.1 Brazil
- 9.5.2 Mexico
- 9.6 MEA
- 9.6.1 UAE
- 9.6.2 Saudi Arabia
- 9.6.3 South Africa
Chapter 10 Company Profiles (Business Overview, Financial Data, Product Landscape, Strategic Outlook, SWOT Analysis)
- 10.1 3M Co.
- 10.2 Ahlstrom-Munksjo Oyj
- 10.3 AVVIR
- 10.4 Camfil AB
- 10.5 Cummins Inc.
- 10.6 Daikin Industries Ltd.
- 10.7 DENSO Corp.
- 10.8 Donaldson Co. Inc.
- 10.9 Freudenberg Group
- 10.10 IQAir
- 10.11 MAHLE GmbH
- 10.12 MANN+HUMMEL Group
- 10.13 Parker Hannifin Corp.
- 10.14 Samsung Electronics
- 10.15 Whirlpool Corporation
 空氣清淨機市場:2026-2032年全球市場預測(依類型、技術、功能、應用、最終用途及銷售管道)煙氣收集器和煙霧收集設備市場:2026-2032年全球市場預測(按產品類型、終端用戶產業、安裝配置、風量和濾材)電子空氣清淨機和空氣清潔設備市場:依產品類型、技術、最終用戶和通路分類-2026-2032年全球市場預測空氣消毒淨化設備市場:依技術類型、產品類型、功能類型、最終用途和銷售管道分類-2026-2032年全球預測天花板式排煙系統市場:按過濾器類型、氣流、分配管道、應用和最終用戶產業分類,全球預測,2026-2032年
 光催化空氣清淨機市場分析及預測(至2035年):依類型、產品類型、技術、組件、應用、材質、設備、最終用戶及功能分類
 2026年全球空氣清淨機市場報告
 全球甲醛去除空氣清淨機市場分析及預測(至2031年)
 空氣清淨機市場規模、佔有率和趨勢分析報告:按技術、應用、覆蓋範圍、銷售管道、類型、地區和細分市場預測(2026-2033 年)
 2026-2030年全球空氣清淨機市場