


 |
市場調查報告書
商品編碼
1851578
光子積體電路:市場佔有率分析、產業趨勢、統計數據和成長預測(2025-2030 年)Photonic Integrated Circuit - Market Share Analysis, Industry Trends & Statistics, Growth Forecasts (2025 - 2030) |
||||||
※ 本網頁內容可能與最新版本有所差異。詳細情況請與我們聯繫。
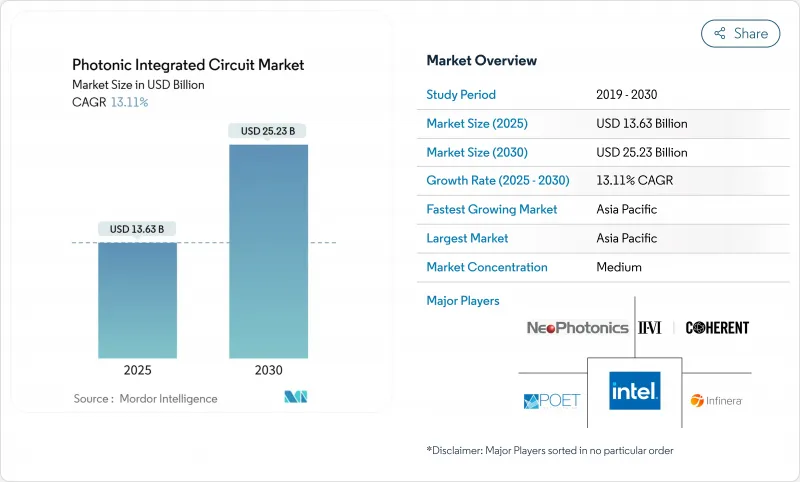
預計到 2025 年,光子積體電路市場規模將達到 136.3 億美元,到 2030 年將達到 252.3 億美元。
這項擴張反映了矽光電從實驗應用轉向資料中心、通訊網路和早期量子系統等生產規模部署。商業性發展動能主要得益於利用成熟的創業投資晶圓廠所獲得的成本優勢、活躍的創投管道以及政府為促進先進光電製造在地化而提供的激勵措施。同時,共封裝光學元件、薄膜鈮酸鋰調製器以及異質InP/矽雷射整合技術的快速發展,進一步拉大了與傳統光學元件的性能差距。鎵和鍺供應鏈風險的加劇凸顯了多元化材料平台和區域代工廠佈局的戰略價值。
全球光子積體電路市場趨勢與洞察
矽光電在400G+資料中心收發器的應用
北美超大規模營運商已過渡到 400G 和 800G 光鏈路,以降低人工智慧叢集的延遲和功耗。相干公司 (Coherent Corp.) 展示了一款 1.6 T-DR8 模組,與傳統插頭電纜相比,每位元能耗降低了 20% 以上。英偉達 (NVIDIA) 的 Spectrum-X 交換器藍圖採用共封裝光元件,可達到 30% 的功耗降低和 1.6 Tb/s 的連接埠速度。此類架構透過將光子引擎整合到交換器 ASIC 旁邊,消除了電干擾損耗,並利用成熟的 300mm CMOS 生產線實現了大規模生產。對多機架 GPU 架構日益成長的需求,使矽光電成為下一代人工智慧基礎設施的關鍵要素。
歐盟試點計畫資金將促進區域PIC代工廠發展
晶片聯合委員會 (Chips JU) 向 PIXEurope 聯盟撥款 3.8 億歐元(約 4.473 億美元),鞏固了歐洲在光子技術領域的自主競標。位於埃因霍溫和恩斯赫德的試點生產線將以開放式方式生產矽和氮化矽,使中小企業無需擁有晶圓廠即可進行原型開發。諸如舉措等計劃將專注於晶圓級異質雷射鍵合技術,確保產能能夠滿足歐洲電訊和汽車產業從 2026 年開始逐步提升的需求。該計劃與垂直整合的美國和亞洲同行形成鮮明對比,並有望建立一個去中心化且更具韌性的供應鏈。
InP光子積體電路產量比率挑戰
將 InP 晶圓尺寸縮小到 4 吋以上會增加缺陷控制的難度,並提高晶粒成本。 Coherent 公司的 6 吋生產線使理論晶粒數量翻了四倍,但需要新的外延和計量製程來維持產量比率。 Fraunhofer ISE 展示了 InP/GaAs基板,成本降低了 80%,為 8 吋晶圓的研發鋪平了藍圖。持續的產量比率下降繼續限制 InP 在成本敏感應用領域的競爭力,減緩了其近期成長。
細分市場分析
預計到2025年,與原料銷售相關的光子積體電路市場規模將達到49.3億美元,其中矽在2024年將維持37.4%的市佔率。 CMOS製程憑藉其在被動波導管和成本敏感型資料通訊組件方面的廣泛應用,繼續保持領先地位。然而,由於氮化矽具有低傳播損耗和寬透明性,適用於實驗室晶片和量子光電,預計其複合年成長率將達到15.4%。磷化銦仍然是高功率雷射的關鍵材料,而砷化鎵因其異質雷射結能夠簡化矽光源的整合而備受青睞。
對擴充性和效能的追求塑造了供應商的發展藍圖。醫療保健新興企業選擇具有生物相容性的氮化矽用於照護現場診斷,而遠距通訊供應商則堅持使用磷化銦調製器來實現 140 Gbaud 鏈路。 HyperLight 公司 3,700 萬美元的資金籌措用於開發薄膜鈮酸鋰調製器,凸顯了光電領域領導者對該領域的重新關注。日益增多的多層晶圓模糊了傳統平台的界限,預示著未來多種材料可以共存於同一光阻上。
到2025年,組件收入將超過30億美元,其中雷射將佔26.3%。光開關矩陣的複合年成長率將達到14.1%,遠超其他裝置,這反映了人工智慧資料中心叢集對完全可重構架構的需求。 Lumentum公司400Gb/s/通道的電吸收調變雷射已達到性能標竿的巔峰。
整合式光生成仍然是總成本的關鍵組成部分。代工廠將InP或GaAs增益介質鍵結到矽晶圓上,從而省去了外部雷射封裝,但熱問題和產量比率問題增加了複雜性。光電探測器和調變器受益於薄膜鈮酸鋰架構,該架構兼具超過100 GHz的頻寬和低於1V的驅動效率。可變光衰減器和波長解多工器日趨成熟,但通道數量的增加推動了陣列實現的微型化。
光子積體電路依原料(InP、Si、Sin、GaAs、Linbo3 等)、元件(雷射、檢測器、濾波器、開關、擴大機等)、整合製程(混合、單片等)、應用(通訊、資料中心、生物醫學、生命科學等)、最終用戶(通訊服務供應商、雲端和超大規模資料中心。
區域分析
北美地區佔據了最大的區域收入佔有率,在2024年佔全球收入的35.4%。大規模超大規模資料中心和《晶片法案》(CHIPS Act)的獎勵推動了超過7億美元的矽光電新投資湧入紐約州馬耳他。量子光電和人工智慧光電領域的風險投資,包括Lightsynq獲得的1800萬美元種子輪融資,促進了蓬勃發展的新興企業發展。然而,對中國鎵和鍺的依賴使市場面臨材料價格衝擊,在2024年出口限制實施後,這些材料的價格上漲了75%至250%。
亞太地區以16.5%的複合年成長率成為成長最快的地區,這主要得益於政策制定者致力於實現光電的自主研發。中國投入82億元人民幣(約11.5億美元)補貼其雷射矽一體化計畫。日本與英特爾合作投資3.05億美元,研發可降低資料中心電力消耗的光半導體。區域晶圓廠生產出6吋薄膜鈮酸鋰晶圓,彌合了晶圓技術差距。
歐洲將透過開放的晶圓代工廠和有針對性的併購活動,維持2019年至2024年製造業6.5%的複合年成長率。預計2025年,歐洲光子積體電路市場規模將達到30.2億美元。 Sivers Photonics公司與Infinera公司合作開發了用於相干模組的窄線寬可調諧雷射器,諾基亞以23億美元收購Infinera的交易也增強了歐洲大陸的光裝置能力。該地區致力於維護自身主權,扶持中小企業發展,實現全球供應鏈多元化,並減少對單一製造節點地區的過度依賴。
其他福利:
- Excel格式的市場預測(ME)表
- 3個月的分析師支持
目錄
第1章 引言
- 研究假設和市場定義
- 調查範圍
第2章調查方法
第3章執行摘要
第4章 市場情勢
- 市場概覽
- 市場促進因素
- 矽光電在400G+資料中心收發器的應用(北美)
- 歐盟試點計畫資金助力本地PIC代工廠發展
- PIC賦能的連貫5G回程傳輸部署(亞洲)
- 降低自動駕駛汽車中固體雷射雷達的成本
- 量子互連PIC的創業投資
- 利用實驗室晶片光子診斷進行快速檢測
- 市場限制
- InP光子積體電路產量比率挑戰
- 碎片化的EDA工具鏈會延長設計週期。
- 片上雷射溫度控管的局限性
- 鑄造設備供應集中且面臨地緣政治風險
- 價值鏈分析
- 規章制度和標準
- 技術藍圖與製造流程分析
- 波特五力分析
- 供應商的議價能力
- 買方的議價能力
- 新進入者的威脅
- 競爭對手之間的競爭
- 替代品的威脅
- 宏觀經濟影響評估
- 投資分析
第5章 市場規模與成長預測
- 按原料
- 磷化銦(InP)
- 矽(Si)
- 氮化矽(SiN)
- 砷化鎵(GaAs)
- 鈮酸鋰(LiNbO3)
- 矽上二氧化矽
- 其他材料(聚合物、PLC 等)
- 按組件
- 雷射
- 數據機
- 光電探測器
- 篩選
- 轉變
- 擴大機
- 多工器和解解多工器
- 衰減器和VOA
- 其他部件
- 透過整合過程
- 混合整合
- 整體整合
- 基於模組/子系統的整合
- 透過使用
- 通訊(遠距和城際)
- 資料中心(短距離和高效能運算互連)
- 生物醫學與生命科學
- 光學感測器和LiDAR
- 儀器儀表和測試/測量
- 量子計算和量子光電
- 按最終用戶行業分類
- 電信服務供應商
- 雲端和超大規模資料中心營運商
- 醫療保健和診斷相關企業
- 汽車和出行設備原始設備製造商
- 工業和製造業
- 國防/航太
- 研究與學術界
- 按地區
- 北美洲
- 美國
- 加拿大
- 墨西哥
- 歐洲
- 德國
- 法國
- 英國
- 北歐國家
- 其他歐洲地區
- 亞太地區
- 中國
- 台灣
- 韓國
- 日本
- 印度
- 亞太其他地區
- 南美洲
- 巴西
- 墨西哥
- 阿根廷
- 其他南美洲
- 中東和非洲
- 中東
- 沙烏地阿拉伯
- 阿拉伯聯合大公國
- 土耳其
- 其他中東地區
- 非洲
- 南非
- 其他非洲地區
- 北美洲
第6章 競爭情勢
- 市場集中度
- 戰略舉措和交易流
- 市佔率分析
- 公司簡介
- Infinera Corporation
- Lumentum Holdings Inc.
- Intel Corporation
- Coherent Corp.(II-VI)
- Cisco Systems Inc.(Acacia)
- NeoPhotonics Corporation
- POET Technologies Inc.
- EFFECT Photonics
- Celestial AI
- Source Photonics Inc.
- Sicoya GmbH
- HyperLight Corp
- Ayar Labs Inc.
- Lightmatter Inc.
- Marvell Technology
- Ligentec SA
- Xanadu Quantum Tech. Inc.
- Ciena Corporation
- OpenLight Photonic Inc.
- Juniper Networks(Aurrion IP)
第7章 市場機會與未來展望
The photonic integrated circuit market size stood at USD 13.63 billion in 2025 and is projected to reach USD 25.23 billion by 2030, reflecting a 13.11% CAGR.
This expansion mirrored the shift from experimental silicon photonics toward production-scale deployment in data centers, telecom networks, and early quantum systems, as rising AI workloads exposed the bandwidth and energy limits of copper interconnects. Commercial momentum benefited from cost advantages gained by leveraging established CMOS fabs, a vibrant venture capital pipeline, and growing government incentives to localize advanced photonic manufacturing. Meanwhile, rapid progress in co-packaged optics, thin-film lithium niobate modulators, and heterogeneous InP/silicon laser integration widened the performance gap with legacy optics. Intensifying supply-chain risks around gallium and germanium highlighted the strategic value of diversified materials platforms and regional foundry footprints.
Global Photonic Integrated Circuit Market Trends and Insights
Silicon-Photonics Adoption in >400 G Data-Center Transceivers
North American hyperscale operators transitioned to 400 G and 800 G optical links to curb latency and power in AI clusters. Coherent Corp demonstrated a 1.6 T-DR8 module that cut energy per bit by more than 20% versus conventional pluggables. NVIDIA's Spectrum-X switch roadmap adopted co-packaged optics that delivered 30% power savings and 1.6 Tb/s port speeds. Such architectures integrate photonic engines beside switch ASICs, eliminating electrical ingress losses and setting a volume pathway through established 300 mm CMOS lines. Growing demand for multi-rack GPU fabrics positions silicon photonics as an indispensable element of next-generation AI infrastructure.
EU Pilot-Line Funding Catalysing Local PIC Foundries
The EUR 380 million (USD 447.30 million) Chips JU award to the PIXEurope consortium underpinned Europe's bid for photonic sovereignty. Pilot lines in Eindhoven and Enschede will offer open-access silicon and silicon-nitride runs, enabling SMEs to prototype without owning fabs. Projects such as photonixFAB focus on heterogeneous laser attachment at wafer scale, positioning Europe to meet local telecom and automotive demand when volume ramps after 2026. The initiative contrasts with vertically integrated US and Asian peers, promising a distributed, resilient supply chain.
Wafer-Scale Yield Challenges for InP PICs
Scaling InP wafers beyond 4 inches, strained defect control, and pushing up the cost per die. Coherent Corp's six-inch line quadrupled theoretical die count yet required new epitaxy and metrology processes to maintain yield. Fraunhofer ISE demonstrated InP-on-GaAs substrates that cut cost by 80% and opened a roadmap to eight-inch scaling. Persistent yield drag continued to limit InP competitiveness in cost-sensitive applications, dampening near-term growth.
Other drivers and restraints analyzed in the detailed report include:
- PIC-Enabled Coherent 5G Backhaul Roll-outs
- Solid-State LiDAR Cost Downs in Autonomous Vehicles
- Fragmented EDA Toolchain Prolonging Design Cycles
For complete list of drivers and restraints, kindly check the Table Of Contents.
Segment Analysis
The photonic integrated circuit market size associated with raw-material sales reached USD 4.93 billion in 2025, and silicon retained 37.4% of the photonic integrated circuit market share in 2024. A broad installed CMOS base sustained its lead for passive waveguides and cost-critical datacom parts. Yet silicon nitride deliveries rose at a 15.4% CAGR thanks to low propagation loss and wide transparency that suited lab-on-chip and quantum photonics. Indium phosphide stayed essential for high-power lasers, while gallium arsenide gained traction through heterogeneous laser bonding that simplified silicon light-source integration.
Competition between scalability and performance shaped vendor roadmaps. Healthcare startups selected silicon-nitride biocompatibility for point-of-care diagnostics, whereas long-haul telecom vendors adhered to InP modulators for 140 Gbaud links. HyperLight's USD 37 million raise to advance thin-film lithium-niobate modulators highlighted renewed interest in electro-optic champions. Increasing multilayer wafer stacking signalled a future where mixed materials co-reside on a single reticle, blurring traditional platform boundaries.
Component revenue surpassed USD 3 billion in 2025, with lasers accounting for 26.3% that year. Optical switch matrices outpaced all other devices at a 14.1% CAGR, reflecting demand for fully reconfigurable fabrics inside AI data-center clusters. Lumentum's 400 Gb/s-per-lane electro-absorption modulated laser exemplified cresting performance benchmarks.
Integrated light generation remained the linchpin of total cost. Foundries coupled InP or GaAs gain media onto silicon to curtail external laser packaging, but thermal and yield issues added complexity. Photodetectors and modulators benefited from thin-film lithium-niobate architectures that combined >= 100 GHz bandwidth with sub-1 V drive efficiency. Variable optical attenuators and wavelength demultiplexers matured, yet rising channel counts spurred miniaturized array implementations.
Photonic Integrated Circuit is Segmented by Raw Material (InP, Si, Sin, Gaas, Linbo3, and More), Component (Lasers, Modulators, Photodetectors, Filters, Switches, Amplifiers, and More), Integration Process (Hybrid, Monolithic, and More), Application (Telecommunications, Data Centers, Biomedical and Life-Sciences, and More), End-User (Telecom Service Providers, Cloud and Hyperscale Data-Center Operators, and More), and Geography.
Geography Analysis
North America generated the largest regional revenue share in 2024, of 35.4% of global sales 2024. Massive hyperscale data centers and CHIPS-Act incentives drew over USD 700 million of new silicon-photonics capex to Malta, New York. Venture rounds for quantum and AI photonics, such as Lightsynq's USD 18 million seed, fortified a vibrant start-up pipeline. However, reliance on Chinese gallium and germanium exposed material price shocks that climbed 75%-250% after 2024 export controls.
Asia-Pacific posted the fastest 16.5% CAGR as policymakers targeted photonic self-reliance. China subsidized CNY 8.2 billion (USD 1.15 billion) for integrated laser-silicon programs. Japan invested USD 305 million with Intel for optical semiconductors that cut data-center power use. Regional fabs produced six-inch thin-film lithium-niobate wafers that closed earlier Western technology gaps.
Europe combined open-access foundries with targeted M&A to sustain a 6.5% manufacturing CAGR from 2019-2024. The photonic integrated circuit market size for Europe was USD 3.02 billion in 2025. Sivers Photonics collaborated on narrow-linewidth tunable lasers to serve coherent modules, while Nokia's USD 2.3 billion Infinera deal consolidated continental optical competence. The region's emphasis on sovereignty and SME enablement diversified global supply and reduced overdependence on single-node manufacturing geographies.
- Infinera Corporation
- Lumentum Holdings Inc.
- Intel Corporation
- Coherent Corp. (II-VI)
- Cisco Systems Inc. (Acacia)
- NeoPhotonics Corporation
- POET Technologies Inc.
- EFFECT Photonics
- Celestial AI
- Source Photonics Inc.
- Sicoya GmbH
- HyperLight Corp
- Ayar Labs Inc.
- Lightmatter Inc.
- Marvell Technology
- Ligentec SA
- Xanadu Quantum Tech. Inc.
- Ciena Corporation
- OpenLight Photonic Inc.
- Juniper Networks (Aurrion IP)
Additional Benefits:
- The market estimate (ME) sheet in Excel format
- 3 months of analyst support
TABLE OF CONTENTS
1 INTRODUCTION
- 1.1 Study Assumptions and Market Definition
- 1.2 Scope of the Study
2 RESEARCH METHODOLOGY
3 EXECUTIVE SUMMARY
4 MARKET LANDSCAPE
- 4.1 Market Overview
- 4.2 Market Drivers
- 4.2.1 Silicon-Photonics Adoption in >400 G Data-Center Transceivers (North America)
- 4.2.2 EU Pilot-Line Funding Catalysing Local PIC Foundries
- 4.2.3 PIC-Enabled Coherent 5G Backhaul Roll-outs (Asia)
- 4.2.4 Solid-State LiDAR Cost Downs in Autonomous Vehicles
- 4.2.5 Venture Capital for Quantum-Interconnect PICs
- 4.2.6 Lab-on-Chip Photonic Diagnostics for Rapid Testing
- 4.3 Market Restraints
- 4.3.1 Wafer-Scale Yield Challenges for InP PICs
- 4.3.2 Fragmented EDA Toolchain Prolonging Design Cycles
- 4.3.3 On-Chip Laser Thermal-Management Limitations
- 4.3.4 Concentrated Foundry Supply and Geopolitical Exposure
- 4.4 Value Chain Analysis
- 4.5 Regulatory and Standards Landscape
- 4.6 Technological Roadmap and Manufacturing Process Analysis
- 4.7 Porter's Five Forces Analysis
- 4.7.1 Bargaining Power of Suppliers
- 4.7.2 Bargaining Power of Buyers
- 4.7.3 Threat of New Entrants
- 4.7.4 Intensity of Competitive Rivalry
- 4.7.5 Threat of Substitute Products
- 4.8 Macroeconomic Impact Assessment
- 4.9 Investment Analysis
5 MARKET SIZE AND GROWTH FORECASTS (VALUE)
- 5.1 By Raw Material
- 5.1.1 Indium Phosphide (InP)
- 5.1.2 Silicon (Si)
- 5.1.3 Silicon Nitride (SiN)
- 5.1.4 Gallium Arsenide (GaAs)
- 5.1.5 Lithium Niobate (LiNbO3)
- 5.1.6 Silica-on-Silicon
- 5.1.7 Other Materials (Polymer, PLC, etc.)
- 5.2 By Component
- 5.2.1 Lasers
- 5.2.2 Modulators
- 5.2.3 Photodetectors
- 5.2.4 Filters
- 5.2.5 Switches
- 5.2.6 Amplifiers
- 5.2.7 Multiplexers and Demultiplexers
- 5.2.8 Attenuators and VOA
- 5.2.9 Other Components
- 5.3 By Integration Process
- 5.3.1 Hybrid Integration
- 5.3.2 Monolithic Integration
- 5.3.3 Module-based/Subsystem Integration
- 5.4 By Application
- 5.4.1 Telecommunications (Long-haul and Metro)
- 5.4.2 Data Centers (Short-Reach and HPC Interconnects)
- 5.4.3 Biomedical and Life-Sciences
- 5.4.4 Optical Sensors and LiDAR
- 5.4.5 Metrology and Test/Measurement
- 5.4.6 Quantum Computing and Quantum Photonics
- 5.5 By End-user Industry
- 5.5.1 Telecom Service Providers
- 5.5.2 Cloud and Hyperscale Data-Center Operators
- 5.5.3 Healthcare and Diagnostics Companies
- 5.5.4 Automotive and Mobility OEMs
- 5.5.5 Industrial and Manufacturing
- 5.5.6 Defense and Aerospace
- 5.5.7 Research and Academia
- 5.6 By Geography
- 5.6.1 North America
- 5.6.1.1 United States
- 5.6.1.2 Canada
- 5.6.1.3 Mexico
- 5.6.2 Europe
- 5.6.2.1 Germany
- 5.6.2.2 France
- 5.6.2.3 United Kingdom
- 5.6.2.4 Nordics
- 5.6.2.5 Rest of Europe
- 5.6.3 Asia-Pacific
- 5.6.3.1 China
- 5.6.3.2 Taiwan
- 5.6.3.3 South Korea
- 5.6.3.4 Japan
- 5.6.3.5 India
- 5.6.3.6 Rest of Asia-Pacific
- 5.6.4 South America
- 5.6.4.1 Brazil
- 5.6.4.2 Mexico
- 5.6.4.3 Argentina
- 5.6.4.4 Rest of South America
- 5.6.5 Middle East and Africa
- 5.6.5.1 Middle East
- 5.6.5.1.1 Saudi Arabia
- 5.6.5.1.2 United Arab Emirates
- 5.6.5.1.3 Turkey
- 5.6.5.1.4 Rest of Middle East
- 5.6.5.2 Africa
- 5.6.5.2.1 South Africa
- 5.6.5.2.2 Rest of Africa
- 5.6.1 North America
6 COMPETITIVE LANDSCAPE
- 6.1 Market Concentration
- 6.2 Strategic Moves and Deal Flow
- 6.3 Market Share Analysis
- 6.4 Company Profiles (includes Global overview, Market overview, Core Segments, Financials, Strategic Information, Market Rank/Share, Products and Services, Recent Developments)
- 6.4.1 Infinera Corporation
- 6.4.2 Lumentum Holdings Inc.
- 6.4.3 Intel Corporation
- 6.4.4 Coherent Corp. (II-VI)
- 6.4.5 Cisco Systems Inc. (Acacia)
- 6.4.6 NeoPhotonics Corporation
- 6.4.7 POET Technologies Inc.
- 6.4.8 EFFECT Photonics
- 6.4.9 Celestial AI
- 6.4.10 Source Photonics Inc.
- 6.4.11 Sicoya GmbH
- 6.4.12 HyperLight Corp
- 6.4.13 Ayar Labs Inc.
- 6.4.14 Lightmatter Inc.
- 6.4.15 Marvell Technology
- 6.4.16 Ligentec SA
- 6.4.17 Xanadu Quantum Tech. Inc.
- 6.4.18 Ciena Corporation
- 6.4.19 OpenLight Photonic Inc.
- 6.4.20 Juniper Networks (Aurrion IP)
7 MARKET OPPORTUNITIES AND FUTURE OUTLOOK
- 7.1 White-space and Unmet-Need Assessment
 光學積體電路市場預測(至 2032 年):按產品類型、組件、整合類型、原料、應用、最終用戶和地區進行的全球分析
 光子量子電腦市場
 光子積體電路市場規模、佔有率、趨勢及預測(按組件、原料、整合、應用和地區),2025 年至 2033 年
 毫米波和微波RF收發器市場(2025-2029)2032 年無線電頻率積體電路市場預測:按產品類型、材料類型、運作頻率、應用和地區進行的全球分析
 2025年全球厚膜混合積體電路市場報告
 光子積體電路:全球市場專注於矽光電
 信標接收器市場:2025 年至 2030 年預測
 AI-native RAN:營運商和供應商的框架
 光子積體電路市場規模、佔有率、成長分析,按整合類型、按組件、按原料、按應用、按地區 - 行業預測,2025-2032 年