


 |
市場調查報告書
商品編碼
1850359
客戶分析:市場佔有率分析、產業趨勢、統計數據、成長預測(2025-2030 年)Customer Analytics - Market Share Analysis, Industry Trends & Statistics, Growth Forecasts (2025 - 2030) |
||||||
※ 本網頁內容可能與最新版本有所差異。詳細情況請與我們聯繫。
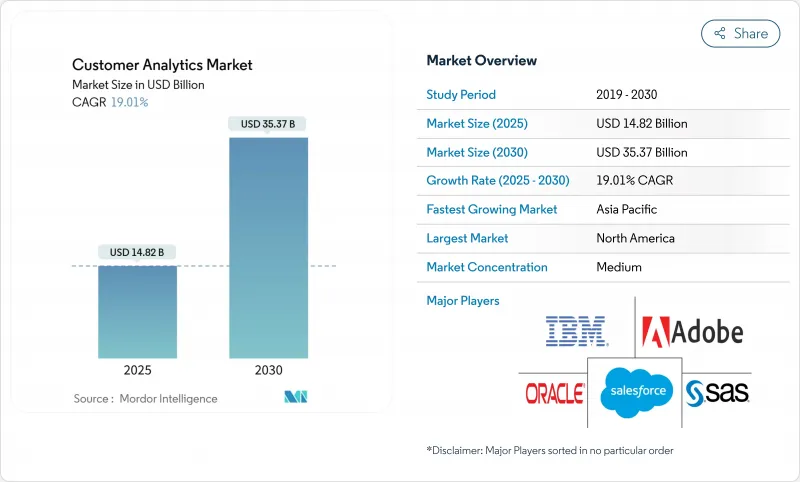
客戶分析市場預計到 2025 年將達到 148.2 億美元,到 2030 年將達到 353.7 億美元,複合年成長率為 19.01%。
隨著企業轉向數據主導互動,取代高成本的大眾行銷並整合分散的數位接點,擴充性正在加速提升。雲端部署仍然是主流架構,因為企業傾向於採用可擴展的按需付費模式,從而避免計量收費支出。然而,隨著企業尋求自動化洞察生成,人工智慧驅動的模組正日益受到關注。垂直領域的擴張仍在繼續,不僅在零售業,而且在醫療保健等高度監管的行業也是如此,在這些行業中,分析技術支援合規性和個人化醫療服務。隨著平台供應商將分析功能嵌入現有應用程式以鎖定客戶並保護市場佔有率免受規模較小的專業競爭對手的衝擊,競爭日趨激烈。同時,資料主權法規和人才短缺迫使企業重新架構或尋求外部專家支持,從而限制了短期業務擴張。
全球客戶分析市場趨勢與洞察
對高度個人化客戶體驗的需求日益成長
不斷攀升的獲客成本迫使企業將客戶留存置於首位,個人化也從行銷目標提升為核心營運原則。 Adobe 的一項研究發現,71% 的消費者希望品牌能預測他們的需求,但只有不到 40% 的企業能夠大規模地做到這一點。串流媒體服務供應商正在展現這種影響:Netflix 將約 80% 的用戶參與度歸功於其數據驅動的建議引擎,該引擎能夠根據即時行為訊號進行調整。飯店業者也正在響應這一轉變,近九成飯店正在實施人工智慧增強的客戶互動,以獲取更高的住宿。高品質洞察與收益提升之間的聯繫正在推動各行業對高級細分、趨勢建模和最佳行動引擎的投資,從而推動整個客戶分析市場的成長。
雲端原生分析降低中小企業的總擁有成本
中小企業正擴大採用雲端服務,因為訂閱模式可以省去大筆資本支出並縮短引進週期。美國調查發現,許多中小企業每年在技術方面的支出在 1 萬至 4.9 萬美元之間,這使得可擴展的計量收費分析服務在經濟上極具吸引力。公共雲端供應商預測,到 2028 年,支出將超過 1 兆美元,企業架構師報告稱,到 2025 年,85% 的新工作負載將遵循雲端優先原則。 40% 的歐洲中型企業表示,財務問題是數位化計劃的障礙,而雲端平台正在透過將固定成本轉化為營運費用來彌合這一差距。
數據主權法分類了全球營運
各國政府正收緊對個人資料儲存和跨境傳輸的管控,迫使跨國公司建構區域特定的技術堆疊和重複的資料管道。美國司法部禁止從相關國家存取美國敏感資料的規定便是這項轉變的例證。企業架構師必須權衡GDPR、雲端法規以及亞太地區不同的居住義務,通常選擇在地化處理而非集中式處理。這延緩了統一客戶視圖計劃的推進,也阻礙了客戶分析在複雜營運模式下的市場普及。
細分市場分析
預計到2024年,雲端解決方案將佔總營收的62%,並在2030年之前以21.40%的複合年成長率成長。雲端採用市場呈現細分趨勢,預計2030年,各細分市場的規模將超過250億美元。儘管金融和公共部門機構仍然固守本地部署環境,對延遲和資料駐留進行嚴格控制,但它們也在投資混合雲方案,將敏感資料保留在本地,同時將繁重的運算任務卸載到公共雲端。微軟報告稱,Azure在2025年第三季實現了35%的成長,其中近一半的營收成長歸功於支援即時細分和趨勢建模的人工智慧服務。 Oracle與Oracle的多重雲端協定表明,曾經的競爭對手平台正在相互融合,以滿足企業對靈活分析遷移路徑的需求。
遷移到雲端的公司正在經歷更快的實驗週期。資料團隊推出沙盒環境,並在模型檢驗完成後解鎖。訂閱定價模式將前期投資轉化為營運成本,從而簡化了預算核准流程,尤其對中小企業而言更是如此。隨著供應商採用特定產業的合規藍圖,受監管行業的分析工作負載也在轉變,這進一步擴大了客戶分析市場。
到2024年,儀錶板彙報軟體將佔總收入的27%。然而,人工智慧驅動的模組到2030年將以24.60%的複合年成長率成長,成為客戶分析市場中成長最快的部分。這些引擎能夠自動完成特徵工程、模型選擇和場景分析,從而縮短從原始資料到可執行洞察的路徑。 Adobe已在其數位體驗套件中整合了生成式人工智慧,預計到2024年將創造53.7億美元的收入。
客戶之聲、社群媒體和網路分析應用仍在不斷發展各自的專業應用場景,但它們正逐漸整合到更廣泛的客戶資料平台之下,這些平台集中處理模式、授權和身分解析。 ETL 工具正從批量整合演變為即時管道,可在數秒內刷新特徵存儲,使內容和定價引擎能夠在即時互動中根據客戶情境做出回應。在這些流程中直接實現資料品質和管治自動化的供應商,將在日益嚴格的隱私審查下脫穎而出。
客戶分析市場按部署類型(本地部署、雲端部署)、解決方案(社交媒體分析工具、網站分析工具等)、組織規模(中小企業、大型企業)、服務(託管服務、專業服務)、最終用戶行業(通訊和IT、旅遊和酒店等)以及地區進行細分。市場預測以美元(USD)計價。
區域分析
北美地區在人工智慧領域的支出佔據主導地位,這得益於其高度普及的雲端運算、成熟的資料科學人才儲備以及強勁的創業投資資金——預計到2024年,人工智慧新創公司將獲得超過1091億美元的投資。供應商利用遍佈美國和加拿大的密集資料中心,為即時個人化宣傳活動提供低延遲推理。監管政策相對靈活,但各州的隱私權法要求區域性的使用者同意管理。隨著零售商尋求深入了解全通路購物者的行為,墨西哥新興的電子商務生態系統也帶來了日益成長的需求。
在歐洲,各組織機構正在遵守GDPR並採用基於隱私設計的分析架構。德國和英國在製造業和金融服務業現代化的推動下走在前列,而法國和義大利則在政府支持下加速數位轉型。強制性資料本地化迫使供應商運作跨區域叢集,這雖然增加了營運成本,但也提升了注重隱私的客戶的信任度。歐盟圍繞可信任雲端標籤和安全分析沙箱的措施正在進一步影響架構決策。
亞太地區是成長最快的區域,43% 的公司計劃在未來一年內將人工智慧預算增加 20% 以上。中國正在擴大國內大規模語言模型的規模,以符合當地法規,從而建構一個與西方平台截然不同的平行生態系統。印度的銀行、金融服務和保險 (BFSI) 以及通訊業正在大力投資數據平台,以觸及行動優先用戶。日本和韓國優先發展全通路零售分析,而澳洲則憑藉強大的雲端基礎設施和有利的外匯走勢保持穩定成長。總體而言,到 2028 年,亞太地區的人工智慧支出可能超過 1,100 億美元,這將為客戶分析市場帶來強勁的成長。
其他福利:
- Excel格式的市場預測(ME)表
- 3個月的分析師支持
目錄
第1章 引言
- 研究假設和市場定義
- 調查範圍
第2章調查方法
第3章執行摘要
第4章 市場情勢
- 市場概覽
- 市場促進因素
- 對高度個人化客戶體驗(主流)的需求日益成長
- 雲端原生分析降低中小企業(主流)的總擁有成本
- 利用人工智慧驅動的自助式分析實現洞察民主化(主流)
- 客戶數據平台與行銷技術套件(主流)捆綁在一起。
- 零售媒體網路悄悄開放第一方資料通道
- 在 SaaS 工作流程中嵌入分析(非侵入式)
- 市場限制
- 資料主權法引發全球分歧(主流觀點)
- 可配置數據產品人才短缺(主流)
- 影子IT現象猖獗,會在你不知情的情況下創造重複的客戶身分。
- 由於移除第三方 Cookie 而導致的廣告技術訊號遺失(不明顯)
- 價值/供應鏈分析
- 監管格局
- 技術展望
- 波特五力分析
- 新進入者的威脅
- 買方的議價能力
- 供應商的議價能力
- 替代品的威脅
- 競爭的激烈程度
第5章 市場規模與成長預測
- 依部署類型
- 本地部署
- 雲端基礎
- 透過解決方案
- 社群媒體分析工具
- 網路分析工具
- 儀錶板和報告工具
- 客戶之聲(VoC)
- ETL(提取、轉換、載入)
- 進階分析模組
- 按公司規模
- 小型企業
- 主要企業
- 按最終用戶產業
- 通訊/IT
- 旅遊與飯店
- 零售
- BFSI
- 媒體與娛樂
- 衛生保健
- 運輸/物流
- 製造業
- 其他行業
- 透過服務
- 託管服務
- 專業服務
- 按地區
- 北美洲
- 美國
- 加拿大
- 墨西哥
- 南美洲
- 巴西
- 阿根廷
- 其他南美
- 歐洲
- 英國
- 德國
- 法國
- 義大利
- 其他歐洲地區
- 亞太地區
- 中國
- 日本
- 印度
- 韓國
- 其他亞太地區
- 中東和非洲
- 中東
- 以色列
- 沙烏地阿拉伯
- 阿拉伯聯合大公國
- 土耳其
- 其他中東地區
- 非洲
- 南非
- 埃及
- 其他非洲國家
- 北美洲
第6章 競爭情勢
- 市場集中度
- 策略趨勢
- 市佔率分析
- 公司簡介
- Adobe
- Alteryx
- Angoss Software Corp.
- Axtria
- Bridgei2i(Accenture)
- IBM
- Manthan Software
- Microsoft
- NGDATA
- Oracle
- Pitney Bowes
- Salesforce
- SAS Institute
- TEOCO
- Aruba Networks(HPE)
第7章 市場機會與未來展望
The customer analytics market size is valued at USD 14.82 billion in 2025 and is forecast to climb to USD 35.37 billion by 2030, advancing at a 19.01% CAGR.
Adoption accelerates as enterprises pivot toward data-driven engagement, replace high-cost mass marketing, and synchronize fragmented digital touchpoints. Cloud deployment remains the primary architecture because firms prefer scalable pay-as-you-go models that avoid capital outlays, while AI-augmented modules gain traction as organizations demand automated insight production. Vertical expansion continues beyond retail into highly regulated sectors such as healthcare, where analytics supports compliance and personalised care delivery. Competitive intensity rises as platform vendors embed analytics inside existing applications to lock in customers and defend share against smaller specialists. At the same time, data-sovereignty regulations and talent shortages temper short-term expansion by forcing businesses to re-engineer architectures and source external expertise.
Global Customer Analytics Market Trends and Insights
Rising Demand for Hyper-Personalised Customer Experience
Escalating acquisition costs force firms to prioritise retention, elevating personalisation from marketing goal to core operating principle. Adobe found 71% of consumers expect brands to anticipate needs, yet fewer than 40% of companies deliver at scale. Streaming providers illustrate impact: Netflix attributes roughly 80% of viewer engagement to its data-driven recommendation engine that adapts to real-time behavioural signals. Hospitality operators mirror this shift, with nearly nine in 10 hotels deploying AI-enhanced guest interactions that command premium room rates. The linkage between insight quality and revenue uplift encourages cross-industry investment in advanced segmentation, propensity modelling and next-best-action engines, fuelling growth across the customer analytics market.
Cloud-Native Analytics Lowers TCO for SMEs
Small and medium enterprises increasingly adopt cloud services because subscription models remove large capital outlays and shorten deployment cycles. US surveys show annual technology spending for many SMEs falls between USD 10,000 and USD 49,000, making scalable pay-per-use analytics financially attractive. Public cloud providers anticipate spending to top USD 1 trillion by 2028, and enterprise architects report that 85% of new workloads will follow cloud-first principles by 2025. For European mid-sized firms, 40% cite financial uncertainty as a barrier to digital projects-a gap that cloud platforms close by converting fixed costs into operating expenses.
Data-Sovereignty Laws Fragment Global Rollouts
Governments tighten control over personal data storage and cross-border transfers, forcing multinationals to build region-specific stacks and duplicate data pipelines. The US Department of Justice rule blocking access to sensitive American data by countries of concern exemplifies this shift and adds compliance overhead starting April 2025. Organisational architects must balance GDPR, the Cloud Act and divergent APAC residency mandates, often choosing to localise processing rather than centralise, which delays unified customer-view projects and slows customer analytics market adoption in complex operating models.
Other drivers and restraints analyzed in the detailed report include:
- AI-Augmented Self-Service Analytics Democratises Insights
- Customer Data Platforms Bundled into Mar-Tech Suites
- Shortage of Composable Data-Product Talent
For complete list of drivers and restraints, kindly check the Table Of Contents.
Segment Analysis
Cloud solutions account for 62% of 2024 revenue and are projected to grow at a 21.40% CAGR through 2030 as firms prefer elastic scaling and reduced maintenance overhead. In many cases the customer analytics market size for cloud deployments is expected to exceed USD 25 billion by 2030 at segment level. On-premises environments persist in finance and public-sector contexts that enforce tight latency or residency controls, yet investment concentrates on hybrid approaches that keep sensitive data local while offloading heavy computation to public clouds. Microsoft reported Azure growth of 35% in Q3 2025, attributing almost half the incremental revenue to AI services that power real-time segmentation and propensity modelling. Oracle's multicloud pact with AWS demonstrates how previously rival platforms now interconnect to meet enterprise demand for flexible analytics migration paths.
Enterprises that shift to cloud note faster experimentation cycles: data teams spin up sandbox environments within minutes and de-commission them once models are validated, a process that once required weeks of procurement and installation when hardware was on-premises. Subscription pricing converts large upfront investments into operational expense, easing budget approvals especially for SMEs. As vendors introduce industry-specific compliance blueprints, regulated sectors increasingly migrate analytical workloads, further broadening the customer analytics market.
Dashboard and reporting software still represents 27% of 2024 revenue because visual summaries remain the gateway for non-technical managers. Yet AI-augmented modules are expanding at a 24.60% CAGR to 2030, positioning them as the fastest-growing layer of the customer analytics market. These engines automate feature engineering, model selection and scenario analysis, thereby shortening the path from raw data to actionable insight. Adobe integrated generative AI across its Digital Experience suite and generated USD 5.37 billion in 2024, validating appetite for embedded intelligence.
Voice-of-Customer, social-media and web-analytical applications continue carving out specialised use cases, but they are converging under broader customer-data-platform umbrellas that centralise schema, consent and identity resolution. ETL tools evolve from batch integrations into real-time pipelines that refresh feature stores in seconds, enabling content and pricing engines to react to customer context during live engagements. Suppliers that automate data quality and governance directly within these flows differentiate strongly amid growing privacy scrutiny.
Customer Analytics Market is Segmented by Deployment Type (On-Premises and Cloud-Based), Solution (Social-Media Analytical Tools, Web Analytical Tools and More), Organization Size (SMEs, Large Enterprises), Service (Managed Service, Professional Service), End-User Industry (Telecommunications and IT, Travel and Hospitality and More) and Geography. The Market Forecasts are Provided in Terms of Value (USD).
Geography Analysis
North America dominates spending owing to deep cloud penetration, mature data-science talent pools and strong venture funding that topped USD 109.1 billion for AI start-ups in 2024. Vendors leverage dense data-centre footprints across the United States and Canada to deliver low-latency inference for real-time personalisation campaigns. Regulatory policy remains comparatively flexible, though state-level privacy acts require region-specific consent controls. Mexico's emerging e-commerce ecosystems create incremental demand as retailers seek insight into omnichannel buyer behaviour.
Europe follows closely as organisations comply with GDPR, driving uptake of privacy-by-design analytics frameworks. Germany and the United Kingdom lead adoption, supported by manufacturing and financial-services modernisation, while France and Italy accelerate digital programmes through government-backed stimulus. Data-localisation mandates compel vendors to operate multi-region clusters, increasing operating costs yet boosting trust among privacy-sensitive customers. EU initiatives around trusted-cloud labels and secure analytics sandboxes further influence architectural decisions.
APAC represents the fastest-expanding region, with 43% of enterprises planning >20% AI budget increases over the coming year. China scales domestic large-language models to serve local regulations, prompting parallel ecosystems distinct from Western platforms. India's BFSI and telecom sectors invest heavily in data platforms to reach mobile-first users. Japan and South Korea emphasise omnichannel retail analytics, and Australia maintains steady growth on the back of strong cloud infrastructure and favourable currency trends. Overall, regional AI expenditure could exceed USD 110 billion by 2028, sustaining robust expansion of the customer analytics market.
- Adobe
- Alteryx
- Angoss Software Corp.
- Axtria
- Bridgei2i (Accenture)
- IBM
- Manthan Software
- Microsoft
- NGDATA
- Oracle
- Pitney Bowes
- Salesforce
- SAS Institute
- TEOCO
- Aruba Networks (HPE)
Additional Benefits:
- The market estimate (ME) sheet in Excel format
- 3 months of analyst support
TABLE OF CONTENTS
1 INTRODUCTION
- 1.1 Study Assumptions and Market Definition
- 1.2 Scope of the Study
2 RESEARCH METHODOLOGY
3 EXECUTIVE SUMMARY
4 MARKET LANDSCAPE
- 4.1 Market Overview
- 4.2 Market Drivers
- 4.2.1 Rising demand for hyper-personalised CX (mainstream)
- 4.2.2 Cloud-native analytics lowers TCO for SMEs (mainstream)
- 4.2.3 AI-augmented self-service analytics democratises insights (mainstream)
- 4.2.4 Customer Data Platforms bundled into mar-tech suites (mainstream)
- 4.2.5 Retail media networks opening first-party data pipes (under-the-radar)
- 4.2.6 Embedded analytics inside SaaS workflows (under-the-radar)
- 4.3 Market Restraints
- 4.3.1 Data-sovereignty laws fragment global roll-outs (mainstream)
- 4.3.2 Shortage of composable data-product talent (mainstream)
- 4.3.3 Shadow-IT sprawl creates duplicate customer IDs (under-the-radar)
- 4.3.4 Ad-tech signal loss after third-party cookie deprecation (under-the-radar)
- 4.4 Value / Supply-Chain Analysis
- 4.5 Regulatory Landscape
- 4.6 Technological Outlook
- 4.7 Porter's Five Forces Analysis
- 4.7.1 Threat of New Entrants
- 4.7.2 Bargaining Power of Buyers
- 4.7.3 Bargaining Power of Suppliers
- 4.7.4 Threat of Substitutes
- 4.7.5 Intensity of Rivalry
5 MARKET SIZE AND GROWTH FORECASTS (VALUE)
- 5.1 By Deployment Type
- 5.1.1 On-premise
- 5.1.2 Cloud-based
- 5.2 By Solution
- 5.2.1 Social-Media Analytical Tools
- 5.2.2 Web Analytical Tools
- 5.2.3 Dashboard and Reporting Tools
- 5.2.4 Voice of Customer (VoC)
- 5.2.5 ETL (Extract-Transform-Load)
- 5.2.6 Advanced Analytical Modules
- 5.3 By Organisation Size
- 5.3.1 SMEs
- 5.3.2 Large Enterprises
- 5.4 By End-user Industry
- 5.4.1 Telecommunications and IT
- 5.4.2 Travel and Hospitality
- 5.4.3 Retail
- 5.4.4 BFSI
- 5.4.5 Media and Entertainment
- 5.4.6 Healthcare
- 5.4.7 Transportation and Logistics
- 5.4.8 Manufacturing
- 5.4.9 Other Industries
- 5.5 By Service
- 5.5.1 Managed Service
- 5.5.2 Professional Service
- 5.6 By Geography
- 5.6.1 North America
- 5.6.1.1 United States
- 5.6.1.2 Canada
- 5.6.1.3 Mexico
- 5.6.2 South America
- 5.6.2.1 Brazil
- 5.6.2.2 Argentina
- 5.6.2.3 Rest of South America
- 5.6.3 Europe
- 5.6.3.1 United Kingdom
- 5.6.3.2 Germany
- 5.6.3.3 France
- 5.6.3.4 Italy
- 5.6.3.5 Rest of Europe
- 5.6.4 Asia-Pacific
- 5.6.4.1 China
- 5.6.4.2 Japan
- 5.6.4.3 India
- 5.6.4.4 South Korea
- 5.6.4.5 Rest of Asia-Pacific
- 5.6.5 Middle East and Africa
- 5.6.5.1 Middle East
- 5.6.5.1.1 Israel
- 5.6.5.1.2 Saudi Arabia
- 5.6.5.1.3 UAE
- 5.6.5.1.4 Turkey
- 5.6.5.1.5 Rest of Middle East
- 5.6.5.2 Africa
- 5.6.5.2.1 South Africa
- 5.6.5.2.2 Egypt
- 5.6.5.2.3 Rest of Africa
- 5.6.1 North America
6 COMPETITIVE LANDSCAPE
- 6.1 Market Concentration
- 6.2 Strategic Moves
- 6.3 Market Share Analysis
- 6.4 Company Profiles (includes Global-level Overview, Market-level Presence, Core Segments, Financials, Strategic Information, Market Rank/Share, Products and Services, Recent Developments)
- 6.4.1 Adobe
- 6.4.2 Alteryx
- 6.4.3 Angoss Software Corp.
- 6.4.4 Axtria
- 6.4.5 Bridgei2i (Accenture)
- 6.4.6 IBM
- 6.4.7 Manthan Software
- 6.4.8 Microsoft
- 6.4.9 NGDATA
- 6.4.10 Oracle
- 6.4.11 Pitney Bowes
- 6.4.12 Salesforce
- 6.4.13 SAS Institute
- 6.4.14 TEOCO
- 6.4.15 Aruba Networks (HPE)
7 MARKET OPPORTUNITIES AND FUTURE OUTLOOK
- 7.1 White-space and Unmet Need Analysis


