


 |
市場調查報告書
商品編碼
1850165
商業智慧(BI):市場佔有率分析、產業趨勢、統計數據、成長預測(2025-2030)Business Intelligence (BI) - Market Share Analysis, Industry Trends & Statistics, Growth Forecasts (2025 - 2030) |
||||||
※ 本網頁內容可能與最新版本有所差異。詳細情況請與我們聯繫。
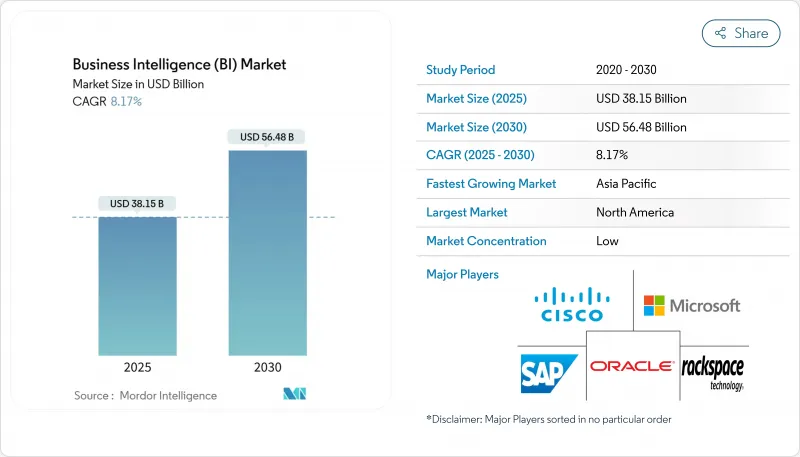
商業智慧(BI) 市場預計到 2025 年將達到 381.5 億美元,到 2030 年將達到 562.8 億美元,複合年成長率為 8.17%。
雲端原生架構、人工智慧驅動的分析以及資料驅動文化的興起,持續推動著各種規模企業對雲端原生分析的高需求。半結構化資料的即時攝取、GPU查詢的查詢執行以及嵌入式分析的日益普及,正推動著人們的討論從傳統的儀錶板轉向預測性和指導性模型。訂閱定價和託管服務降低了准入門檻,而多重雲端策略有助於減少供應商鎖定,並支援受監管行業的合規性。超大規模超大規模資料中心業者,而專注於無程式碼自動化的AI新興企業則加劇了競爭。技能短缺、跨境資料主權規則以及雲端使用費用仍然是商業情報市場的主要障礙。
全球商業智慧(BI) 市場趨勢與洞察
採用雲端優先分析
企業正在將商業智慧 (BI) 工作負載遷移到提供彈性運算和原生 AI 服務的雲端平台,以取代難以應對即時經營團隊Oracle這一成長歸因於需要可擴展 GPU 實例的 AI計劃。多重雲端架構正成為一流分析的熱門選擇,但也引發了人們對資料遷移成本和管治一致性的擔憂。受監管產業將雲端合規自動化視為競爭優勢而非風險,加速了醫療保健和金融服務業的遷移計劃。供應商正在透過區域分區資料控制來應對這項挑戰,以在保持效能的同時實現合規分析。
半結構化物聯網資料的爆炸性成長
工廠、物流中心和智慧城市計畫正在部署數十億個感測器,產生嵌套的 JSON 和時間序列資料流。傳統的關聯型資料倉儲無法解析如此龐大的資料規模和格式,因此需要採用能夠即時分析資料的串流平台。邊緣設備處理初步分析結果以降低延遲,然後將匯總資料推送至雲端 AI 模型,從而獲得全系統洞察。 Nutanix 的研究表明,85% 的企業計劃採用生成式 AI,超過一半的企業正在投資基礎設施升級以支援大量分析。這項因素推動了 GPU 加速引擎和記憶體內列式儲存在整個商業智慧市場實現摘要成長。
數據素養人才短缺
提供人工智慧輸出只是工作的一半;將其轉化為實際操作決策,需要具備深厚統計知識和領域背景知識的人員。醫療保健系統報告稱,人工智慧計劃存在41%的技能缺口,公共機構也面臨類似的短缺。人才短缺推高了薪資水平,延長了計劃週期,迫使供應商投資自動化洞察生成和自然語言介面,以彌補能力缺口。這種限制因素減緩了新興市場和區域市場的部署速度,也拖慢了商業智慧市場的發展步伐。
細分市場分析
企業對人工智慧驅動的洞察需求不斷成長,將使軟體平台繼續保持領先地位,預計到2024年將佔據67%的收入佔有率。這一主導地位將確保平台商業智慧市場規模擴大,同時,客製化和最佳化部署的服務也將以8%的複合年成長率成長。微軟的生產力和業務流程部門預計在2025年第二季將錄得294億美元的收入,其中Dynamics 365年增19%,凸顯了市場對整合商業智慧(BI)功能的整合式業務應用程式的強勁需求。
平台供應商正將自動化資料建模、自然語言搜尋和主動通知等功能整合到平台中,以區別於僅提供視覺化功能的競爭對手。 Salesforce 的 Tableau Next 引入了人工智慧代理,能夠發現工作流程中的異常情況,從而縮短從資料到行動的時間。服務團隊正從這種日益複雜的局面中獲益,他們指導受監管行業完成模型檢驗、符合審核要求的血緣關係分析以及特定領域的調優。因此,與商業情報市場相關的諮詢收入成長速度超過了傳統維護業務的收入成長速度。
預計到 2024 年,雲端業務收入將佔 SAP 總收入的 66%,到 2030 年將以 9.5% 的複合年成長率成長。混合雲模式在國防和公共部門持續普及,這些部門也將一些敏感度較低的工作負載遷移到區域雲端平台。 SAP 2025 年第一季的雲端業務收入成長 27%,達到 49 億歐元(53 億美元),這表明傳統 ERP 客戶率先遷移了他們的分析模組。
彈性運算、全球覆蓋和打包式人工智慧服務使雲端成為即時儀錶板和模型訓練的必要條件。邊緣節點處理製造業和摘要的本地遙測數據,並將匯總結果同步到雲端儲存庫,從而形成分散式架構,擴大了商業智慧市場的覆蓋範圍。本機部署解決方案主要存在於資料居住規則禁止外部託管的場景,但容器化配置現在正在私有資料中心內模擬雲端模式。
商業智慧(BI) 市場按組件(軟體和平台、服務)、配置(本地部署和雲端部署)、經營模式(訂閱/SaaS 許可、永久許可等)、最終用戶行業(銀行、金融服務和保險 (BFSI)、IT 和通訊等)以及地區進行細分。市場預測以美元計價。
區域分析
北美地區預計在2024年將維持38.3%的營收成長,這主要得益於由超大規模資料中心業者和獨立軟體開發商(ISV)組成的密集生態系統,推動了分析功能的快速迭代和交叉銷售,使其融入現有軟體。目前,投資重點在於利用生成式人工智慧和對話式商業智慧來增強現有部署,從而加深應用。嚴格的隱私和人工智慧倫理準則正在影響全球產品藍圖,進一步提升其在北美商業智慧市場的影響力。
亞太地區將在2030年前實現最高成長,年複合成長率將達到12.7%,這主要得益於傳統技術的突破和政府支持的數位化計畫。亞太地區43%的企業計畫在未來一年內將人工智慧支出增加20%以上。中國將加速發展,主要由銀行業現代化和醫院數據分析引領;而印度和東南亞將受益於資料中心容量的快速擴張,預計到2024年將達到12.2吉瓦。
隨著GDPR和即將推出的歐盟人工智慧立法重塑採購格局,歐洲將迎來穩定成長。供應商強調“隱私設計”、“聯邦學習”和“本地化託管”,以滿足144個國家/地區的資料隱私法律(這些法律與GDPR原則相符)。在政府雲端政策和日益增強的網路連結的推動下,拉丁美洲和非洲正在崛起為新興熱點地區,但人才短缺和監管體系的不完全限制了它們在短期內對商業智慧市場的貢獻。
其他福利:
- Excel格式的市場預測(ME)表
- 3個月的分析師支持
目錄
第1章 引言
- 研究假設和市場定義
- 調查範圍
- 關鍵績效指標(KPI)
第2章調查方法
第3章執行摘要
第4章 市場情勢
- 市場概覽
- 市場促進因素
- 雲端優先分析成為主流
- 半結構化物聯網資料正迅速成為主流
- 主流SaaS業務應用程式中的嵌入式BI
- 在注重隱私的廣告領域,建立謹慎的資料無塵室夥伴關係
- 非侵入式 GPU 加速查詢引擎可降低整體擁有成本
- 非侵入式分析即程式碼和 GitOps 實踐的興起
- 市場限制
- 數據素養人才短缺
- 主流傳統核心系統的初始整合成本
- 多重雲端BI架構中隱藏的出口價格飆升
- 新興數位貿易規則中對資料主權的悄悄打壓
- 價值/供應鏈分析
- 監管環境
- 技術展望
- 波特五力分析
- 供應商的議價能力
- 買方/消費者的議價能力
- 新進入者的威脅
- 替代品的威脅
- 競爭對手之間的競爭
- 定價分析
第5章 市場規模與成長預測
- 按組件
- 軟體和平台
- 服務
- 透過部署
- 本地部署
- 雲
- 按最終用戶行業分類
- BFSI
- 資訊科技/通訊
- 零售與電子商務
- 衛生保健
- 製造業
- 政府和公共部門
- 按經營模式
- 訂閱/SaaS 許可
- 永久許可
- 免費增值/按使用量付費
- 託管服務/BI即服務
- 按地區
- 北美洲
- 美國
- 加拿大
- 南美洲
- 巴西
- 阿根廷
- 其他南美洲
- 歐洲
- 德國
- 英國
- 法國
- 義大利
- 西班牙
- 其他歐洲地區
- 亞太地區
- 中國
- 日本
- 韓國
- 印度
- 澳洲
- 紐西蘭
- 亞太其他地區
- 中東和非洲
- 阿拉伯聯合大公國
- 沙烏地阿拉伯
- 南非
- 其他中東和非洲地區
- 北美洲
第6章 競爭情勢
- 市場集中度
- 策略趨勢
- 市佔率分析
- 公司簡介
- Microsoft Corporation
- SAP SE
- Oracle Corporation
- International Business Machines Corp.(IBM)
- SAS Institute Inc.
- Salesforce Inc.(Tableau and Einstein Analytics)
- Amazon Web Services Inc.(QuickSight)
- Google LLC(Looker Studio)
- QlikTech International AB
- MicroStrategy Inc.
- Domo Inc.
- TIBCO Software
- Infor Inc.
- Zoho Corporation(Zoho Analytics)
- Teradata Corp.
- Alteryx Inc.
- Sisense Inc.
- ThoughtSpot Inc.
- Yellowfin International
- GoodData Corp.
第7章 市場機會與未來展望
The business intelligence market stands at USD 38.15 billion in 2025 and will reach USD 56.28 billion by 2030 on an 8.17% CAGR.
Cloud-native architectures, AI-enhanced analytics, and growing data-driven cultures keep demand high across enterprises of all sizes. Real-time ingestion of semi-structured data, GPU-accelerated query execution, and rising adoption of embedded analytics move the conversation beyond historical dashboards toward predictive and prescriptive models. Subscription pricing and managed services lower entry barriers, while multi-cloud strategies mitigate vendor lock-in and support compliance in regulated sectors. Intensifying competition comes from hyperscalers that bundle analytics with infrastructure and from AI-native start-ups focused on no-code automation. Skills shortages, cross-border data-sovereignty rules, and cloud egress fees remain the main speed bumps for the business intelligence market.
Global Business Intelligence (BI) Market Trends and Insights
Cloud-first analytics adoption
Enterprises move BI workloads to cloud platforms that deliver elastic compute and native AI services, replacing on-premises stacks that struggle with real-time model execution. Oracle's cloud revenue reached USD 6.2 billion in Q3 2025 with a 25% gain, and management linked the surge to AI projects that demand scalable GPU instances. Multicloud architectures become popular for best-of-breed analytics but raise issues around data movement costs and governance consistency. Regulated industries now treat cloud compliance automation as a competitive advantage rather than a risk, accelerating migration projects across healthcare and financial services. Vendors respond with regionally partitioned data controls, enabling compliant analytics while preserving performance.
Explosion of semi-structured IoT data
Factories, logistics hubs, and smart-city programs deploy billions of sensors that generate nested JSON and time-series streams. Classical relational warehouses cannot parse the scale or format, prompting uptake of streaming platforms that analyse data in motion. Edge appliances handle first-pass analytics to cut latency, then push summarized data to cloud AI models for fleet-wide insights. Nutanix found 85% of firms have a generative-AI deployment plan, and more than half are funding infrastructure upgrades to support high-volume analytics. This driver sustains double-digit growth for GPU-accelerated engines and in-memory column stores across the business intelligence market.
Shortage of data-literate workforce
Delivering AI outputs is only half the job; turning them into operational decisions requires staff fluent in statistics and domain context. Healthcare systems report 41% skill gaps for AI projects, and public agencies cite similar shortages. Talent scarcity inflates salaries, extends project timelines, and forces vendors to invest in automated insight generation and natural-language interfaces to bridge capability gaps. The constraint slows rollouts in emerging economies and rural regions, tempering the trajectory of the business intelligence market.
Other drivers and restraints analyzed in the detailed report include:
- Embedded BI in SaaS business apps
- Restraint % Impact on CAGR Forecast Geographic Relevance Impact Timeline
- Up-front integration cost for legacy core systems
For complete list of drivers and restraints, kindly check the Table Of Contents.
Segment Analysis
Growing enterprise demand for AI-fuelled insights keeps software platforms at the forefront, representing 67% revenue in 2024. This dominance ensures the business intelligence market size for platforms will climb alongside an 8% CAGR for services that customize and optimize deployments. Microsoft's Productivity and Business Processes division logged USD 29.4 billion in Q2 2025, with Dynamics 365 up 19% year-on-year, underscoring appetite for integrated business apps with built-in BI.
Platform vendors embed automated data modelling, natural-language search, and proactive notifications to distinguish themselves from visualization-only rivals. Salesforce's Tableau Next introduced AI agents that surface anomalies inside workflows, shrinking time from data to action. Services teams profit from the added complexity, guiding regulated industries through model validation, audit-ready lineage, and domain-specific tuning. As a result, consulting revenues tied to the business intelligence market rise faster than legacy maintenance streams.
Cloud held 66% of revenue in 2024 and is on pace for a 9.5% CAGR through 2030, reflecting its role as the default setting for new analytics. Hybrid adoption endures in defence and public sectors, but even these groups push non-sensitive workloads to regional cloud zones. SAP recorded EUR 4.9 billion (USD 5.3 billion) in cloud sales during Q1 2025, up 27%, showing legacy ERP clients migrating analytics modules first.
Elastic compute, global presence, and packaged AI services make cloud indispensable for real-time dashboards and model training. Edge nodes process local telemetry in manufacturing and retail, then sync summaries to cloud repositories, forming a distributed architecture that enlarges the business intelligence market footprint. On-premises solutions survive mainly where data-residency rules forbid external hosting, though containerized deployments now emulate cloud patterns inside private data centers.
Business Intelligence (BI) Market Segmented by Component (Software and Platform, Services), Deployment (On-Premise and Cloud), Business Model (Subscription / SaaS License, Perpetual License and More), End-User Industry (BFSI, IT and Telecommunication and More), and Geography. The Market Forecasts are Provided in Terms of Value (USD).
Geography Analysis
North America retained 38.3% revenue in 2024, anchored by a dense ecosystem of hyperscalers and ISVs that iterate quickly and cross-sell analytics into existing software estates. Investments now center on augmenting established deployments with generative AI and conversational BI to deepen usage. Stringent privacy and AI-ethics guidelines influence global product roadmaps, further elevating North America's sway over the business intelligence market.
Asia-Pacific delivers the highest growth at 12.7% CAGR to 2030, a function of leapfrogging legacy constraints and state-backed digital programs. Forty-three percent of APAC firms plan to raise AI spend by more than 20% in the upcoming year. China accelerates around banking modernization and hospital analytics, while India and Southeast Asia benefit from rapidly expanding data-center capacity that reached 12.2 GW operational in 2024.
Europe grows steadily as GDPR and the forthcoming EU AI Act shape procurement. Vendors emphasize privacy-by-design, federated learning, and localized hosting to satisfy 144 national data-privacy laws that mirror GDPR principles. Latin America and Africa emerge as nascent hotspots, propelled by government cloud mandates and improving connectivity, yet limited by talent shortages and patchwork regulations that temper near-term contributions to the business intelligence market.
- Microsoft Corporation
- SAP SE
- Oracle Corporation
- International Business Machines Corp. (IBM)
- SAS Institute Inc.
- Salesforce Inc. (Tableau and Einstein Analytics)
- Amazon Web Services Inc. (QuickSight)
- Google LLC (Looker Studio)
- QlikTech International AB
- MicroStrategy Inc.
- Domo Inc.
- TIBCO Software
- Infor Inc.
- Zoho Corporation (Zoho Analytics)
- Teradata Corp.
- Alteryx Inc.
- Sisense Inc.
- ThoughtSpot Inc.
- Yellowfin International
- GoodData Corp.
Additional Benefits:
- The market estimate (ME) sheet in Excel format
- 3 months of analyst support
TABLE OF CONTENTS
1 INTRODUCTION
- 1.1 Study Assumptions and Market Definition
- 1.2 Scope of the Study
- 1.3 Key Performance Indicators (KPIs)
2 RESEARCH METHODOLOGY
3 EXECUTIVE SUMMARY
4 MARKET LANDSCAPE
- 4.1 Market Overview
- 4.2 Market Drivers
- 4.2.1 Mainstream Cloud-first analytics adoption
- 4.2.2 Mainstream Explosion of semi-structured IoT data
- 4.2.3 Mainstream Embedded BI in SaaS business apps
- 4.2.4 Under-the-radar Data clean-room partnerships in privacy-first advertising
- 4.2.5 Under-the-radar GPU-accelerated query engines lowering TCO
- 4.2.6 Under-the-radar Rise of Analytics-as-Code and GitOps practices
- 4.3 Market Restraints
- 4.3.1 Mainstream Shortage of data-literate workforce
- 4.3.2 Mainstream Up-front integration cost for legacy core systems
- 4.3.3 Under-the-radar Escalating egress fees in multi-cloud BI architectures
- 4.3.4 Under-the-radar Data-sovereignty clampdowns in emerging digital-trade rules
- 4.4 Value / Supply-Chain Analysis
- 4.5 Regulatory Landscape
- 4.6 Technological Outlook
- 4.7 Porter's Five Forces Analysis
- 4.7.1 Bargaining Power of Suppliers
- 4.7.2 Bargaining Power of Buyers/Consumers
- 4.7.3 Threat of New Entrants
- 4.7.4 Threat of Substitute Products
- 4.7.5 Intensity of Competitive Rivalry
- 4.8 Pricing Analysis
5 MARKET SIZE AND GROWTH FORECASTS (VALUE)
- 5.1 By Component
- 5.1.1 Software and Platform
- 5.1.2 Services
- 5.2 By Deployment
- 5.2.1 On-Premise
- 5.2.2 Cloud
- 5.3 By End-User Industry
- 5.3.1 BFSI
- 5.3.2 IT and Telecommunication
- 5.3.3 Retail and e-Commerce
- 5.3.4 Healthcare
- 5.3.5 Manufacturing
- 5.3.6 Government and Public Sector
- 5.4 By Business Model
- 5.4.1 Subscription / SaaS License
- 5.4.2 Perpetual License
- 5.4.3 Freemium / Usage-based
- 5.4.4 Managed Service / BI-as-a-Service
- 5.5 By Geography
- 5.5.1 North America
- 5.5.1.1 United States
- 5.5.1.2 Canada
- 5.5.2 South America
- 5.5.2.1 Brazil
- 5.5.2.2 Argentina
- 5.5.2.3 Rest of South America
- 5.5.3 Europe
- 5.5.3.1 Germany
- 5.5.3.2 United Kingdom
- 5.5.3.3 France
- 5.5.3.4 Italy
- 5.5.3.5 Spain
- 5.5.3.6 Rest of Europe
- 5.5.4 Asia-Pacific
- 5.5.4.1 China
- 5.5.4.2 Japan
- 5.5.4.3 South Korea
- 5.5.4.4 India
- 5.5.4.5 Australia
- 5.5.4.6 New Zealand
- 5.5.4.7 Rest of Asia-Pacific
- 5.5.5 Middle East and Africa
- 5.5.5.1 United Arab Emirates
- 5.5.5.2 Saudi Arabia
- 5.5.5.3 South Africa
- 5.5.5.4 Rest of Middle East and Africa
- 5.5.1 North America
6 COMPETITIVE LANDSCAPE
- 6.1 Market Concentration
- 6.2 Strategic Moves
- 6.3 Market Share Analysis
- 6.4 Company Profiles (includes Global-level Overview, Market-level Overview, Core Segments, Financials, Strategic Information, Market Rank/Share, Products and Services, Recent Developments)
- 6.4.1 Microsoft Corporation
- 6.4.2 SAP SE
- 6.4.3 Oracle Corporation
- 6.4.4 International Business Machines Corp. (IBM)
- 6.4.5 SAS Institute Inc.
- 6.4.6 Salesforce Inc. (Tableau and Einstein Analytics)
- 6.4.7 Amazon Web Services Inc. (QuickSight)
- 6.4.8 Google LLC (Looker Studio)
- 6.4.9 QlikTech International AB
- 6.4.10 MicroStrategy Inc.
- 6.4.11 Domo Inc.
- 6.4.12 TIBCO Software
- 6.4.13 Infor Inc.
- 6.4.14 Zoho Corporation (Zoho Analytics)
- 6.4.15 Teradata Corp.
- 6.4.16 Alteryx Inc.
- 6.4.17 Sisense Inc.
- 6.4.18 ThoughtSpot Inc.
- 6.4.19 Yellowfin International
- 6.4.20 GoodData Corp.
7 MARKET OPPORTUNITIES AND FUTURE OUTLOOK
- 7.1 White-space and Unmet Need Assessment
 GMIPulse - 專業服務市場情報訂閱
 2025年銀行、金融服務和保險(BFSI)商業智慧全球市場報告
 社群商業智慧市場分析及至2034年的預測:按類型、產品、服務、技術、組件、應用、部署、最終用戶和功能
 商業智慧市場:按組件、功能、技術、部署類型、組織規模和產業分類 - 2025-2032 年全球預測2025年自助商業智慧(BI)全球市場報告
 全球社交商業智慧市場:市場規模、佔有率、趨勢分析(按組件、業務功能、最終用途和地區)、展望和預測(2025-2032年)社交商業智慧市場規模、佔有率和趨勢分析報告:按組件、業務功能、最終用途、地區和細分市場預測,2025 年至 2033 年2025年社交商業智慧全球市場報告
 社群商業智慧市場,規模,佔有率,趨勢,產業分析報告:各零件,商務機能,各最終用途,各地區,2025年~2034年的市場預測
 行動商業智慧:市場佔有率分析、產業趨勢、統計數據和成長預測(2025-2030)