


 |
市場調查報告書
商品編碼
1836719
行動商業智慧:市場佔有率分析、產業趨勢、統計數據和成長預測(2025-2030)Mobile Business Intelligence - Market Share Analysis, Industry Trends & Statistics, Growth Forecasts (2025 - 2030) |
||||||
※ 本網頁內容可能與最新版本有所差異。詳細情況請與我們聯繫。
預計2025年行動商業智慧市場規模將達199.3億美元,到2030年將擴大至555.6億美元。
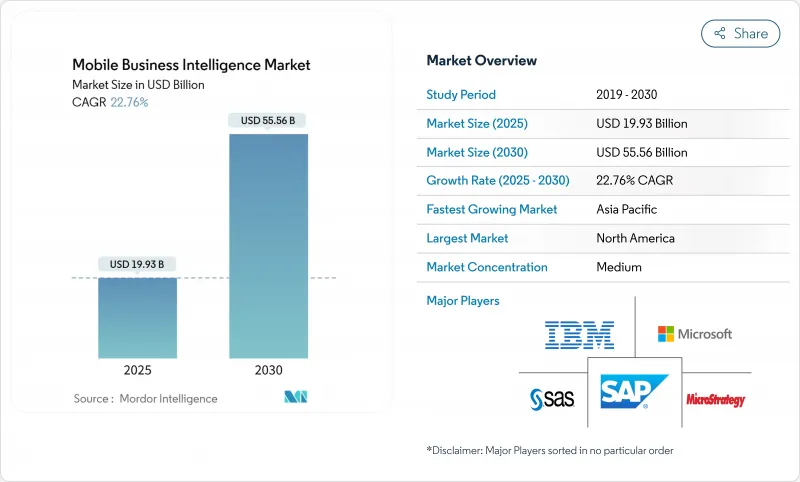
這一成長反映了將資料存取從固定桌面擴展到大眾的緊迫性,以便分散式員工能夠即時根據洞察採取行動。強大的推動因素包括:5G 的成熟降低了延遲;邊緣運算的廣泛應用使資料處理更接近資料來源;以及生成式人工智慧的採用簡化了非技術用戶的查詢創建。儘管軟體解決方案的表現持續優於服務,但隨著企業努力應對複雜的雲端、人工智慧和安全需求,對實施和託管產品的需求正在迅速成長。北美憑藉其日趨成熟的行動框架保持主導,但亞太地區擁有最大的上升空間,因為當地企業在「行動優先」的指導下加速數位轉型。
全球行動商業智慧市場趨勢與洞察
大型企業採用雲端優先移動 BI
大型企業正在以雲端原生行動商業智慧 (BI) 取代本地部署堆疊,使全球各地的員工無需 VPN 即可存取儀表板。超過 52,000 家公司積極使用 Microsoft Power BI 將分析功能嵌入其 Microsoft 365 工作流程。這種轉變透過消除伺服器維護並在高峰使用期間擴展彈性資源,降低了整體擁有成本。 SAP Analytics Cloud 同樣將即時交易資料與行動視覺化相鏈接,同時保持嚴格的身份控制。隨著這種模式的普及,行動商業智慧市場正在向先前抵制雲端遷移的受監管產業擴展。
5G/Edge 部署快速成長,實現即時分析
目前,亞太地區有七個國家已運作獨立的5G網路,支撐著該地區8,800億美元的移動經濟。邊緣運算將處理流程轉移到本地閘道器,使行動儀表板能夠在幾毫秒內更新。東京的金融交易部門已開始使用亞毫秒的資料流在手持設備上對衍生性商品進行定價。這些案例表明,5G與邊緣運算的結合將如何提升行動商業智慧市場的使用強度。
對個人設備安全和隱私的持續擔憂
儘管業務績效顯著提升,但 60% 的企業認為行動安全是廣泛採用商業智慧 (BI) 的主要障礙。 BYOD 政策(混合使用消費者和企業應用程式)增加了資料外洩的風險,而 Apple 的新隱私宣言只能部分緩解此風險。銀行和醫院通常將行動商業智慧 (BI) 限制在公司配發的行動電話上,即使加密和生物識別登入技術有所改進,也仍然會減緩高價值領域的應用。
報告中分析的其他促進因素和限制因素
- 中小企業中 BYOD 和 MDM 整合的擴展
- 嵌入在 SaaS 應用程式和行動工作流程中的分析
- 行動儀表板的可用性有限,無法進行複雜的分析
細分分析
提供視覺化工具、查詢引擎和管治層的軟體仍然是收益的關鍵,到2024年將佔66.5%的佔有率。這些產品支撐著大多數企業分析堆疊,並與身分套件、資料倉儲和低程式碼平台整合。然而,由於對實施、客製化和託管營運的需求激增,服務供應商的簽約速度比授權供應商更快。許多客戶正在外包大規模語言模型、邊緣部署腳本和零信任控制的微調。隨著企業從純軟體投資轉向基於結果的契約,預計到2030年,行動商業智慧服務市場規模將以兩位數的高複合年成長率擴張。
顧問公司將資料工程、使用者培訓和第二天最佳化捆綁在一起,幫助客戶在部署後立即獲得價值。託管服務合作夥伴簽訂多年期協議,以修補行動應用程式、監控使用情況並最佳化語義層,從而使企業能夠專注於獲取洞察,而不是維護平台。 MicroStrategy 在 Google Cloud Marketplace 上的上市體現了這一趨勢:自動化配置加速了部署,認證合作夥伴提供持續的管治。此類模式進一步證明,即使自助服務工具不斷改進,服務豐富的成長曲線仍將持續。
大型企業憑藉其全球企業發展、充足的IT人員以及支援強大行動BI套件的合規義務,將佔2024年收入的75.1%。大型企業正在將分析圖表整合到ERP和CRM工作流程中,使數千名員工能夠即時追蹤關鍵績效指標(KPI)。多租戶管治、單一登入和精細的角色管理能夠滿足金融、醫療和公共部門審核。儘管存在這些優勢,中小企業市場目前擴張最為迅速,因為承包SaaS降低了進入門檻。
中小企業青睞計量收費量付費的訂閱模式、自動擴展功能以及基於嚮導的報表構建器,這些功能都包含在熟悉的生產力套件中。預計中小企業的行動商業智慧市場將快速成長,因為創辦人希望能夠即時了解現金流、庫存和客戶情緒,而無需建立昂貴的本地資料庫。克羅埃西亞的調查數據顯示,成功的應用落地與高層的支持和明確的績效目標息息相關。隨著應用程式商店充斥著 Shopify、QuickBooks 和 Stripe 的預置連接器,中小企業無需聘請資料科學家即可融入數據主導的文化,這也印證了為什麼這類群體的表現持續優於整個行動商業智慧產業。
區域分析
2024年,北美市場將維持全球收入的36.7%,這得益於無處不在的LTE-Advanced覆蓋範圍、5G的快速部署以及企業對行動安全框架的熟悉。矽谷供應商正在其國內地區試行語音查詢和基於攝影機的資料擷取等新功能,之後再在全球發布,從而推動該地區的早期生產力提升。與微軟Entra ID和Okta的深度整合簡化了從桌面到行動電話的身份傳播,從而增加了有效用戶數量。高昂的人事費用也促使企業追求分析主導的效率,因此需要持續為行動商業智慧市場升級分配預算。
亞太地區尤為突出,預計到2030年,該地區的複合年成長率將達到23.2%,因為各國政府將補貼5G頻譜,並強制要求數據本地化,以支援其境內的雲端區域。中國的電商巨頭將PB級遙測Petabyte導入即時儀錶板,以便在幾分鐘內最佳化閃購。印度的統一支付介面將數十億的每日交易推送到分析雲端,使銀行能夠在農村代理商的智慧型手機上完善詐騙模型。許多東協製造商正在跳過傳統的MES系統,率先採用行動儀錶板,這顯示出一種跨越式的效應,其行動商業智慧市場規模的擴張速度超過了其他任何地區。
在 GDPR、永續性目標和工業 5.0 策略的壓力下,歐洲正在穩步擴張。公共產業正在使用行動 BI 來監控可再生能源發電,汽車製造商正在使用手持式分析設備來協調準時交貨。嚴格的隱私法規正在推動假名化和設備加密,這增加了開發的複雜性,但也區分了透過合規性審核的供應商。同時,新的領域正在拉丁美洲、中東和非洲擴張。巴西的 PIX即時支付網路正在向渴望獲得行動洞察的金融科技公司提供行為數據。墨西哥灣沿岸的電信業者正在將分析儀表板捆綁到企業資料方案中,向油田營運商、醫院和智慧城市管理者出售一站式行動和智慧服務。
其他福利:
- Excel 格式的市場預測 (ME) 表
- 3個月的分析師支持
目錄
第1章 引言
- 研究假設和市場定義
- 調查範圍
第2章調查方法
第3章執行摘要
第4章 市場狀況
- 市場概況
- 市場促進因素
- 大型企業採用雲端優先移動 BI
- 5G/Edge 的快速採用實現了即時分析
- 中小企業中 BYOD 和 MDM 整合的擴展
- 將分析嵌入到 SaaS 應用程式和行動工作流程中
- 生成式人工智慧自然語言查詢介面
- 通訊業者主導的「網路分析即服務」產品
- 市場限制
- 個人設備持續存在的安全和隱私問題
- 行動儀表板對於複雜分析的可用性限制
- 多重雲端中的分散化資料管理
- 應用商店政策變更限制 SDK 資料獲取
- 價值鏈分析
- 監管狀況
- 技術展望
- 波特五力分析
- 供應商的議價能力
- 消費者議價能力
- 新進入者的威脅
- 替代品的威脅
- 競爭對手之間的競爭強度
- 評估宏觀經濟趨勢對市場的影響
第5章市場規模及成長預測(金額)
- 按解決方案
- 軟體
- 行動BI平台
- 數據視覺化工具
- 儀表板彙報應用程式
- 服務
- 專業服務
- 託管服務
- 軟體
- 按組織規模
- 主要企業
- 中小企業
- 按用途
- 銷售和行銷分析
- 財務和風險分析
- 營運和供應鏈分析
- 人力資源和勞動力分析
- 客戶體驗分析
- 按行業
- BFSI
- 資訊科技/通訊
- 醫療保健和生命科學
- 零售與電子商務
- 政府及公共機構
- 其他行業
- 按地區
- 北美洲
- 美國
- 加拿大
- 墨西哥
- 歐洲
- 德國
- 英國
- 法國
- 義大利
- 西班牙
- 其他歐洲國家
- 亞太地區
- 中國
- 日本
- 印度
- 韓國
- 澳洲
- 其他亞太地區
- 南美洲
- 巴西
- 阿根廷
- 其他南美
- 中東和非洲
- 中東
- 沙烏地阿拉伯
- 阿拉伯聯合大公國
- 土耳其
- 其他中東地區
- 非洲
- 南非
- 埃及
- 奈及利亞
- 其他非洲國家
- 北美洲
第6章 競爭態勢
- 市場集中度
- 策略趨勢
- 市佔率分析
- 公司簡介
- Microsoft Corporation
- SAP SE
- IBM Corporation
- Salesforce Inc.(Tableau)
- Oracle Corporation
- QlikTech International AB
- SAS Institute
- MicroStrategy Inc.
- TIBCO Software
- Sisense Inc.
- ThoughtSpot Inc.
- Google LLC(Looker)
- Domo Inc.
- Yellowfin International
- Phocas Software
- Zoho Corporation
- Board International
- Dundas Data Visualization
- TARGIT A/S
- e-Zest Solutions Ltd.
- Information Builders Inc.
第7章 市場機會與未來展望
The mobile business intelligence market size reached USD 19.93 billion in 2025 and will advance to USD 55.56 billion by 2030, translating to a 22.8% CAGR and confirming a rapid scale-up in enterprise spending on mobile analytics platforms.
This growth reflects the urgency to democratize data access beyond fixed desktops so that distributed employees can act on insights in real time. Strong tailwinds include 5G maturation that lowers latency, the spread of edge computing that keeps processing close to data sources, and the injection of generative AI that simplifies query creation for non-technical users. Software solutions continue to outsell services, yet demand for implementation and managed offerings expands quickly as firms wrestle with complex cloud, AI, and security requirements. North America retains leadership because of mature mobility frameworks, but Asia-Pacific offers the highest upside as local enterprises accelerate digital transformation under mobile-first mandates.
Global Mobile Business Intelligence Market Trends and Insights
Cloud-first Mobile BI Adoption Among Large Enterprises
Large corporations are swapping on-premises stacks for cloud-native mobile BI so global staff can reach dashboards without VPN friction. More than 52,000 companies actively use Microsoft Power BI, embedding analytics into Microsoft 365 work streams. The shift lowers total cost of ownership because server upkeep disappears and elastic resources scale during peak usage. SAP Analytics Cloud similarly links live transactional data with mobile visualizations while preserving strict identity controls. As this model proliferates, mobile business intelligence market penetration deepens across regulated sectors that once resisted cloud migration.
Surge in 5G/Edge Deployments Enabling Real-time Analytics
Standalone 5G networks now run in seven Asia-Pacific countries, undergirding a USD 880 billion regional mobile economy that prizes responsive analytics. Edge computing moves processing to local gateways so mobile dashboards refresh in milliseconds, a necessity for factory predictive-maintenance alerts and retail shelf-stocking decisions. Financial-trading desks in Tokyo already exploit sub-millisecond feeds to price derivatives on handheld devices. These examples illustrate how 5G plus edge collectively raise usage intensity inside the mobile business intelligence market.
Persistent Security and Privacy Concerns on Personal Devices
Sixty percent of enterprises cite mobile security as the main barrier to broader BI rollout despite clear sales-performance gains. BYOD policies mingle consumer and corporate apps, raising leakage risks that new Apple privacy manifests only partly mitigate. Banks and hospitals often restrict mobile BI to company-issued phones, slowing penetration in high-value verticals even as encryption and biometric log-ins improve.
Other drivers and restraints analyzed in the detailed report include:
- BYOD Expansion and MDM Integration in SMEs
- Embedded Analytics Within SaaS Apps and Mobile Workflows
- Limited Mobile Dashboard Usability for Complex Analysis
For complete list of drivers and restraints, kindly check the Table Of Contents.
Segment Analysis
Software remains the revenue cornerstone, supplying visualization tools, query engines and governance layers that earned a 66.5% share in 2024. These offerings anchor most enterprise analytics stacks and integrate with identity suites, data warehouses and low-code platforms. Still, surging demand for implementation, customization and managed operations means service providers are booking faster contracts than license vendors. Many clients now outsource fine-tuning of large language models, edge-deployment scripts and zero-trust controls because internal teams lack bandwidth. The mobile business intelligence market size for services is projected to expand at high double-digit CAGR through 2030 as organizations shift from pure software spend toward outcome-based engagements.
Consulting firms bundle data engineering, user-training and day-two optimization so clients can unlock value soon after go-live. Managed-services partners sign multiyear agreements to keep mobile apps patched, monitor usage and refine semantic layers, freeing business units to focus on insight consumption instead of platform care. MicroStrategy's listing on Google Cloud Marketplace illustrates the trend: automated provisioning trims deployment timelines, while certified partners step in for ongoing governance. These patterns reinforce a service-rich growth arc likely to continue even as self-service tooling improves.
Large enterprises controlled 75.1% revenue in 2024 because they possess global operations, ample IT staff, and compliance obligations that favor robust mobile BI suites. They embed analytic graphs into ERP and CRM workflows so thousands of employees can track KPIs in the field. Multi-tenant governance, single sign-on, and fine-grained role controls satisfy auditors in finance, healthcare, and public-sector domains. Despite this dominance, the small-business segment now logs the briskest expansion as turnkey SaaS lowers entry barriers.
SMEs appreciate pay-as-you-go subscriptions, automated scaling, and wizard-based report builders that appear within familiar productivity suites. The mobile business intelligence market size for SMEs is forecast to climb steeply as founders seek instant visibility into cash flow, inventory, and customer sentiment without spinning up expensive on-prem databases. Croatian survey data shows that adoption success correlates with top-management sponsorship and clear performance targets. As app stores flood with pre-built connectors to Shopify, QuickBooks, and Stripe, smaller firms can join data-driven cultures without hiring data scientists, underscoring why this cohort will keep outpacing the overall mobile business intelligence industry.
The Mobile Business Intelligence Market Report is Segmented by Solution (Software and Services), Organization Size (Large Enterprises and Small and Medium Enterprises (SMEs)), Application (Sales and Marketing Analytics, Finance and Risk Analytics, and More), End-User Vertical (BFSI, IT and Telecommunications, Healthcare and Life Sciences, and More), and Geography. The Market Forecasts are Provided in Terms of Value (USD).
Geography Analysis
North America kept 36.7% of global revenue in 2024, anchored by ubiquitous LTE-Advanced coverage, swift 5G roll-outs, and enterprise familiarity with mobile security frameworks. Silicon Valley vendors pilot novel features-voice query, camera-based data capture-domestically before global releases, giving the region early productivity gains. Tight integrations with Microsoft Entra ID and Okta simplify identity propagation from desktop to phone, boosting active-user counts. High labor costs also motivate firms to chase analytics-driven efficiency, ensuring continued budget allocation for upgrades in the mobile business intelligence market.
Asia-Pacific stands out with a projected 23.2% CAGR through 2030 as governments subsidize 5G spectrum and mandate data-localization that favors cloud regions inside national borders. China's e-commerce giants stream petabyte-scale telemetry into real-time dashboards that optimize flash sales in minutes. India's Unified Payments Interface pushes billions of daily transactions into analytics clouds, letting banks refine fraud models on smartphones carried by rural agents. Many ASEAN manufacturers skip legacy MES systems and adopt mobile dashboards first, illustrating a leapfrog effect that expands the mobile business intelligence market size faster than any other region.
Europe posts steady expansion under the weight of GDPR, sustainability targets, and Industry 5.0 strategies. Utilities use mobile BI to monitor renewable generation, while carmakers rely on handheld analytics to coordinate just-in-sequence deliveries. Strict privacy rules encourage pseudonymization and on-device encryption, raising development complexity but also differentiating vendors that pass compliance audits. Meanwhile, Latin America and the Middle East and Africa open fresh territory. Brazil's PIX instant-payment network feeds behavioral data to fintechs hungry for mobile insights. Gulf telcos bundle analytics dashboards with enterprise data plans, selling one-stop mobility plus intelligence to oil-field operators, hospitals, and smart-city managers.
- Microsoft Corporation
- SAP SE
- IBM Corporation
- Salesforce Inc. (Tableau)
- Oracle Corporation
- QlikTech International AB
- SAS Institute
- MicroStrategy Inc.
- TIBCO Software
- Sisense Inc.
- ThoughtSpot Inc.
- Google LLC (Looker)
- Domo Inc.
- Yellowfin International
- Phocas Software
- Zoho Corporation
- Board International
- Dundas Data Visualization
- TARGIT A/S
- e-Zest Solutions Ltd.
- Information Builders Inc.
Additional Benefits:
- The market estimate (ME) sheet in Excel format
- 3 months of analyst support
TABLE OF CONTENTS
1 INTRODUCTION
- 1.1 Study Assumptions and Market Definition
- 1.2 Scope of the Study
2 RESEARCH METHODOLOGY
3 EXECUTIVE SUMMARY
4 MARKET LANDSCAPE
- 4.1 Market Overview
- 4.2 Market Drivers
- 4.2.1 Cloud-first mobile BI adoption among large enterprises
- 4.2.2 Surge in 5G/edge deployments enabling real-time analytics
- 4.2.3 BYOD expansion and MDM integration in SMEs
- 4.2.4 Embedded analytics within SaaS apps and mobile workflows
- 4.2.5 Generative-AI-powered natural language query interfaces
- 4.2.6 Telco-led "network analytics-as-a-service" offerings
- 4.3 Market Restraints
- 4.3.1 Persistent security and privacy concerns on personal devices
- 4.3.2 Limited mobile dashboard usability for complex analysis
- 4.3.3 Data-governance fragmentation across multi-cloud estates
- 4.3.4 App-store policy changes throttling SDK data capture
- 4.4 Value Chain Analysis
- 4.5 Regulatory Landscape
- 4.6 Technological Outlook
- 4.7 Porter's Five Forces Analysis
- 4.7.1 Bargaining Power of Suppliers
- 4.7.2 Bargaining Power of Consumers
- 4.7.3 Threat of New Entrants
- 4.7.4 Threat of Substitutes
- 4.7.5 Intensity of Competitive Rivalry
- 4.8 Assessment of the Impact of Macroeconomic Trends on the Market
5 MARKET SIZE AND GROWTH FORECASTS (VALUE)
- 5.1 By Solution
- 5.1.1 Software
- 5.1.1.1 Mobile BI Platforms
- 5.1.1.2 Data Visualization Tools
- 5.1.1.3 Dashboard and Reporting Apps
- 5.1.2 Services
- 5.1.2.1 Professional Services
- 5.1.2.2 Managed Services
- 5.1.1 Software
- 5.2 By Organization Size
- 5.2.1 Large Enterprises
- 5.2.2 Small and Medium Enterprises (SMEs)
- 5.3 By Application
- 5.3.1 Sales and Marketing Analytics
- 5.3.2 Finance and Risk Analytics
- 5.3.3 Operations and Supply-chain Analytics
- 5.3.4 HR and Workforce Analytics
- 5.3.5 Customer Experience Analytics
- 5.4 By End-user Vertical
- 5.4.1 BFSI
- 5.4.2 IT and Telecommunications
- 5.4.3 Healthcare and Life Sciences
- 5.4.4 Retail and E-commerce
- 5.4.5 Government and Public Sector
- 5.4.6 Other End-user Verticals
- 5.5 By Geography
- 5.5.1 North America
- 5.5.1.1 United States
- 5.5.1.2 Canada
- 5.5.1.3 Mexico
- 5.5.2 Europe
- 5.5.2.1 Germany
- 5.5.2.2 United Kingdom
- 5.5.2.3 France
- 5.5.2.4 Italy
- 5.5.2.5 Spain
- 5.5.2.6 Rest of Europe
- 5.5.3 Asia-Pacific
- 5.5.3.1 China
- 5.5.3.2 Japan
- 5.5.3.3 India
- 5.5.3.4 South Korea
- 5.5.3.5 Australia
- 5.5.3.6 Rest of Asia-Pacific
- 5.5.4 South America
- 5.5.4.1 Brazil
- 5.5.4.2 Argentina
- 5.5.4.3 Rest of South America
- 5.5.5 Middle East and Africa
- 5.5.5.1 Middle East
- 5.5.5.1.1 Saudi Arabia
- 5.5.5.1.2 United Arab Emirates
- 5.5.5.1.3 Turkey
- 5.5.5.1.4 Rest of Middle East
- 5.5.5.2 Africa
- 5.5.5.2.1 South Africa
- 5.5.5.2.2 Egypt
- 5.5.5.2.3 Nigeria
- 5.5.5.2.4 Rest of Africa
- 5.5.1 North America
6 COMPETITIVE LANDSCAPE
- 6.1 Market Concentration
- 6.2 Strategic Moves
- 6.3 Market Share Analysis
- 6.4 Company Profiles (includes Global level Overview, Market level overview, Core Segments, Financials as available, Strategic Information, Market Rank/Share, Products and Services, Recent Developments)
- 6.4.1 Microsoft Corporation
- 6.4.2 SAP SE
- 6.4.3 IBM Corporation
- 6.4.4 Salesforce Inc. (Tableau)
- 6.4.5 Oracle Corporation
- 6.4.6 QlikTech International AB
- 6.4.7 SAS Institute
- 6.4.8 MicroStrategy Inc.
- 6.4.9 TIBCO Software
- 6.4.10 Sisense Inc.
- 6.4.11 ThoughtSpot Inc.
- 6.4.12 Google LLC (Looker)
- 6.4.13 Domo Inc.
- 6.4.14 Yellowfin International
- 6.4.15 Phocas Software
- 6.4.16 Zoho Corporation
- 6.4.17 Board International
- 6.4.18 Dundas Data Visualization
- 6.4.19 TARGIT A/S
- 6.4.20 e-Zest Solutions Ltd.
- 6.4.21 Information Builders Inc.
7 MARKET OPPORTUNITIES AND FUTURE OUTLOOK
- 7.1 White-space and Unmet-need Assessment
 2026年全球社交商業智慧市場報告2026年全球自助式商業智慧(BI)市場報告
 社交商業智慧市場:2026-2032年全球市場預測(依產品類型、服務模式、最終用戶產業、部署模式、企業規模及通路分類)行動商業情報市場:2026-2032年全球市場預測(依裝置類型、作業系統、企業規模、部署模式和產業分類)2026年全球商業智慧(BI)供應商市場報告2026年全球雲端平台商業智慧(BI)解決方案市場報告
 社交智慧市場規模、佔有率和成長分析:按組件、組織規模、部署類型、應用和地區分類-2026-2033年產業預測
 2026-2030年全球多重雲端成本智慧平台市場
 Tableau 服務市場分析及預測(至 2035 年):按類型、產品、技術、元件、應用、部署類型、最終使用者、功能和解決方案分類商業智慧(BI) 市場分析及預測(至 2035 年):按類型、產品類型、服務、技術、組件、應用、部署類型、最終用戶和功能分類