


 |
市場調查報告書
商品編碼
1850082
視訊即服務 (VaaS):市場佔有率分析、產業趨勢、統計數據和成長預測 (2025-2030)VaaS - Market Share Analysis, Industry Trends & Statistics, Growth Forecasts (2025 - 2030) |
||||||
※ 本網頁內容可能與最新版本有所差異。詳細情況請與我們聯繫。
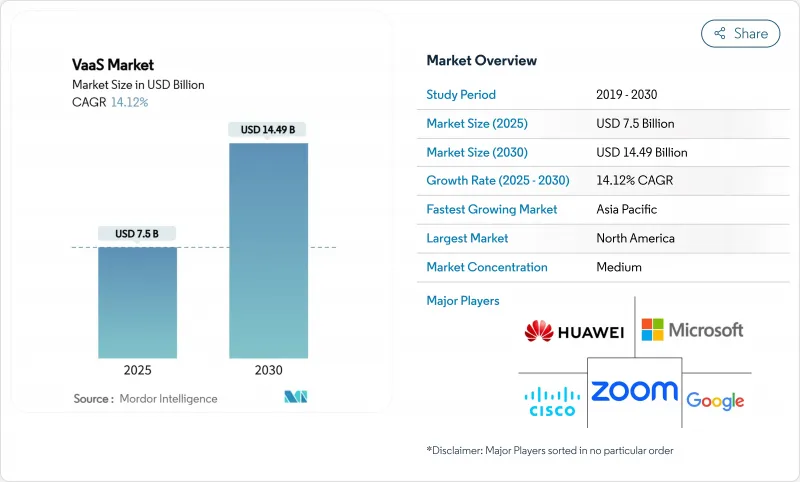
視訊即服務 (VaaS) 市場預計將在 2024 年達到 75 億美元,並在 2025 年至 2030 年以 14.1% 的複合年成長率成長,到 2030 年達到 144.9 億美元。
頻寬定價、5G 滲透率的不斷提高以及買家對訂閱收費而非資本支出的偏好持續推動著雲端視訊服務的普及。財務主管們越來越將雲端視訊支出視為可預測的營運成本,即使在 IT 預算緊張的情況下也能平滑現金流。亞太地區受惠於新增資料中心容量和廣泛的 5G 獨立組網部署,正在加速發展。投資人正在評估那些能夠將經常性收入與合規功能結合的供應商,這促使供應商制定了專注於加密、審核日誌記錄和自主部署範本的藍圖。碳減排要求和混合辦公模式維修計畫正在推動資本支出需求,進一步鞏固了視訊即服務 (VaaS) 市場的發展勢頭。
全球虛擬即服務 (VaaS) 市場趨勢與洞察
從資本支出轉向營運支出
到2024年,企業將把預算從專用橋接器轉向計量收費的雲端視訊服務。美國一家領先的通訊業者報告稱,透過將四分之一的影片業務組合遷移到服務模式,實現了年度折舊免稅額兩位數的下降,並提高了營運自由現金流。節省下來的折舊免稅額資金通常用於頻寬升級,從而形成良性循環,提高利用率。財務部門重視每月的價格可見性,這有助於在宏觀經濟逆風時期緩衝視訊即服務 (VaaS) 的支出。供應商則透過簡化按使用者許可等級來應對,從而降低採購複雜性。早期採用者發現,隨著雲端平台吸收版本控制,這種轉變降低了生命週期支援成本。
將影片API 嵌入到您的應用程式中
一家歐洲保險公司利用API閘道器,將即時保單資料匯入模板場景,並在2025年交付了4萬個個人化續保影片。隨著行銷部門的直接相關人員,過去由IT部門主導的購買週期正在加速。將客戶關係管理資料整合到影片中,可加速客戶留存宣傳活動,並支援動態提升銷售提示。隨著API的成熟度不斷提高,保險公司在影片播放的同時,也加入了用戶同意和點擊驗證功能,從而加強了合規流程。此外,由於影片時長可以根據合約的複雜程度進行調整,這種方法還能降低託管成本。
主權資料居住要求
一家澳洲銀行集團於2025年將所有會議錄影遷移到本地託管實例,以符合更新後的審慎監管標準。地理圍欄流量路由支援營運,但也增加了對跨區域監控工具的需求。供應商必須維護多個司法管轄區的合規模板,這增加了工程成本。在受監管行業,數據處理協議的談判延長了銷售週期。一些買家正在採用混合雲端模式,以平衡本地控制和全球彈性,這使得部署架構更加複雜。
細分市場分析
到2024年,應用程式管理套件將佔據影片即服務(VaaS)市場最大的佔有率,佔全球收入的34%。企業對會議編配、日曆整合和即時安全管理有基本需求。低程式碼連接器使人力資源團隊無需提交IT工單即可安排入職培訓,從而擴大用戶群並提高每個租戶的容量。供應商透過會議生命週期可視性來脫穎而出,該可追蹤參與者的參與度,甚至細緻到表情符號的使用頻率。
然而,內容管理平台預計將超越其他類別,到 2030 年將以 16.5% 的複合年成長率成長。買家越來越將元資料、章節分類和合規性標籤視為核心功能。開發人員正透過軟體開發套件(SDK) 將Widgets整合到員工入口網站中,從而實現這些功能。隨著內容保留策略與 ESG 歸檔要求的整合,以內容為中心的視訊即服務 (VaaS) 市場規模預計將會擴大。設備管理子模組現在可以顯示能耗指標,使永續性團隊能夠追蹤每個終端的能耗,並將平台更新討論與企業應對氣候變遷的目標聯繫起來,從而增加價值。
到 2024 年,企業運算終端仍將佔據視訊即服務 (VaaS) 市場規模的 55%。桌面和筆記型電腦用戶端整合了單一登入和策略執行功能,以滿足法規和政策要求。豐富的螢幕共用和鍵盤輔助功能可確保知識工作者保持高度參與。供應商正在改進開放式辦公室的背景噪音抑制功能,在不增加位元率的情況下提高視訊清晰度。
行動裝置的新用戶成長速度將最快,2025年至2030年的複合年成長率將達到18%。旗艦設備將支援即時深度映射的電影模式,使行銷團隊能夠完全透過行動工作流程製作內部更新影片。這一轉變將把影片製作週期從數週縮短至數小時。隨著5G網路覆蓋範圍擴展到農村地區,行動視訊即服務(VaaS)的市場佔有率預計將會成長,從而消除現場工作人員對網路可靠性的顧慮。在房間規模的場景下,配備智慧音訊分區功能的吸頂式360度全景攝影機將受到青睞,確保遠端參與者都能獲得相同的音訊拾取效果。
視訊即服務 (VaaS) 市場按平台(應用管理、設備管理及其他)、設備(行動裝置、企業運算、會議室終端)、服務(託管服務、專業服務)、部署模式(公共雲端、私有雲端、混合雲端)、終端用戶產業(政府和國防、銀行、金融服務和保險 (BFSI) 及其他)和地區進行細分。市場預測以美元計價。
區域分析
北美將繼續保持主導地位,預計到2024年將佔全球收入的38%,這主要得益於雲端運算的成熟度、資本市場對經常性收入軟體的強勁投資以及人工智慧內容管治的早期應用。美國企業正在將語音分析技術整合到高階主管簡報庫中,而加拿大的雙語法規也刺激了對機器翻譯的需求。政府資助的寬頻津貼正在保障農村地區的頻寬,並將影片覆蓋範圍擴展到較小的城鎮。該地區也是率先試驗邊緣運算卸載的地區之一,從而減少了物聯網視訊分析所需的中央雲端跳躍次數。
預計到2030年,亞太地區的複合年成長率將達到17%,成為所有地區中成長最快的地區。新加坡在2024年新增了150兆瓦的託管容量,首爾的5G獨立組網覆蓋範圍加倍,從而推動了區域SaaS業務的擴張。許多東協企業完全跳過了傳統的PBX階段,因此它們的第一批視訊部署都是原生雲端為基礎的。語言多樣性推動了應用程式內字幕本地化的發展,使擁有豐富語言套件的供應商獲得了競爭優勢。在印尼和菲律賓部署的邊緣節點降低了首公里抖動,提高了群島各地用戶的體驗一致性。
在歐洲,嚴格的資料保護法規和積極的脫碳目標仍然有效。一家德國汽車集團計劃在2024年用影片取代8,000個城際航班,進而將範圍3的排放強度降低4%。排放審核接受視訊即服務(VaaS)儀表板作為減少出行的替代證據,並將視訊預算納入環境、社會和治理(ESG)框架。主權雲端偏好導致供應商支援需求分散在多個子區域。歐元區的《數位市場法案》促進開放互通性,鼓勵供應商採用基於標準的轉碼器和身分驗證外掛程式。
其他福利:
- Excel格式的市場預測(ME)表
- 3個月的分析師支持
目錄
第1章 引言
- 研究假設和市場定義
- 調查範圍
第2章調查方法
第3章執行摘要
第4章 市場情勢
- 市場概覽
- 市場促進因素
- 越來越多的企業正在從高資本支出(CAPEX)的視訊基礎設施遷移到營運成本(OPEX)更低的雲端訂閱模式。
- 面向客戶的應用程式(銀行、零售、遠端醫療)中嵌入式視訊 API 的使用量激增
- 北美和亞洲的低延遲 5G 網路將加速超高清視訊即服務 (UHD VaaS) 的普及。
- 混合辦公模式的興起推動全球1000強企業升級多攝影機會議室。
- 人工智慧驅動的視訊內容管理提升了受監管行業的合規性和搜尋。
- 歐洲的碳排放目標正促使人們更傾向於選擇雲端影片而非旅行。
- 市場限制
- 人們持續擔憂政府機構和銀行、金融服務和保險(BFSI)產業的自主資料儲存問題。
- 高昂的頻寬成本限制了新興非洲和加勒比市場的高清視訊質量
- 大型通訊和製造公司複雜舊有系統的整合
- 跨境視訊分發中的智慧財產權和內容授權風險
- 監理展望
- 技術展望
- 波特五力分析
- 買方的議價能力
- 供應商的議價能力
- 新進入者的威脅
- 替代品的威脅
- 競爭對手之間的競爭
- 評估宏觀經濟趨勢的影響
第5章 市場規模與成長預測
- 按平台
- 應用程式管理
- 設備管理
- 網管
- 影片內容管理
- 透過裝置
- 行動裝置
- 企業運算
- 基於房間的終端
- 透過服務
- 管理
- 專業的
- 按部署模式
- 公共雲端
- 私有雲端
- 混合雲端
- 按最終用戶行業分類
- 政府和國防部
- BFSI
- 醫療保健和生命科學
- 資訊科技和通訊
- 媒體與娛樂
- 製造業
- 教育
- 零售與電子商務
- 其他終端用戶產業
- 按地區
- 北美洲
- 美國
- 加拿大
- 墨西哥
- 南美洲
- 巴西
- 阿根廷
- 其他南美洲
- 歐洲
- 德國
- 英國
- 法國
- 義大利
- 西班牙
- 其他歐洲地區
- 亞太地區
- 中國
- 日本
- 韓國
- 印度
- 澳洲
- 紐西蘭
- 亞太其他地區
- 中東和非洲
- 阿拉伯聯合大公國
- 沙烏地阿拉伯
- 南非
- 其他中東和非洲地區
- 北美洲
第6章 競爭情勢
- 策略發展
- 供應商定位分析
- 公司簡介
- Cisco Systems Inc.
- Zoom Video Communications Inc.
- Microsoft Corporation
- Google LLC
- Huawei Technologies Co. Ltd.
- Adobe Inc.
- Poly(HP Inc.)
- Avaya LLC
- Brightcove Inc.
- Symphony Communication Services
- Pexip AS
- LogMeIn Inc.(GoTo)
- Agora.io
- RingCentral Inc.
- 8x8 Inc.
- Amazon Web Services(Amazon Chime)
- Orange Business Services
- Vonage
- Tata Communications Ltd.
- Kaltura Inc.
- Genesys Telecommunications Labs
第7章 市場機會與未來展望
The video as a service market stood at USD 7.5 billion in 2024 and is projected to reach USD 14.49 billion by 2030, advancing at a 14.1% CAGR between 2025 and 2030.
Stable cloud bandwidth pricing, deeper 5G penetration, and buyers' preference for subscription billing over capital investment continue to widen adoption. Finance chiefs increasingly tag cloud video spending as a predictable operating cost, which smooths cash flows even when IT budgets tighten. Asia-Pacific is accelerating on the back of new data-centre capacity and extensive 5G standalone roll-outs. Investors reward vendors that pair recurring revenue with compliance-ready features, prompting road maps that emphasise encryption, audit logging, and sovereign deployment templates. Heightened carbon-reduction mandates and hybrid-work retrofit programmes extend demand into facilities budgets, further reinforcing the video as a service market trajectory.
Global VaaS Market Trends and Insights
Shift from Capital Expenditure to Operating Expenditure
Enterprises redirected budgets from proprietary bridges to pay-per-use cloud video throughout 2024. A tier-one US telco reported that moving one-quarter of its video portfolio to a service model cut annual depreciation by double digits and lifted operating free cash flow. Depreciation relief often funds bandwidth upgrades, forming a self-reinforcing flywheel that multiplies usage. Finance units appreciate monthly fee visibility, which cushions VaaS spending during macro headwinds. Vendors respond by simplifying per-user licensing tiers, reducing procurement complexity. Early adopters confirm that the switch trims lifecycle support overhead because cloud platforms absorb version management.
Embedded Video APIs in Customer Applications
A European insurer distributed 40,000 personalised renewal videos in 2025 using an API gateway that pulls real-time policy data into templated scenes. Marketing departments, now direct stakeholders, accelerate purchase cycles that were previously IT-led. Integration of customer relationship management data inside video accelerates retention campaigns and supports dynamic upsell prompts. As API maturity grows, insurers embed consent capture and click-through next to playback, tightening compliance loops. This approach also shrinks hosting costs because content length can be tailored to policy complexity, reducing storage minutes per customer while boosting engagement.
Sovereign Data-Residency Requirements
An Australian banking group migrated all meeting recordings to a locally hosted instance in 2025 to align with updated prudential standards. Geo-fenced traffic routing fragments support operations and raise tooling needs for cross-region monitoring. Vendors must maintain compliance templates for multiple jurisdictions, increasing engineering overhead. Negotiating data-processing agreements lengthens sales cycles in regulated verticals. Some buyers adopt hybrid-cloud models to balance local control with global elasticity, complicating deployment architectures.
Other drivers and restraints analyzed in the detailed report include:
- Low-Latency 5G and Edge Acceleration
- Hybrid-Work Mandates Driving Room Upgrades
- Bandwidth Constraints in Emerging Economies
For complete list of drivers and restraints, kindly check the Table Of Contents.
Segment Analysis
Application-management suites accounted for the largest video as a service market share in 2024, accounting for 34% of global revenue. Enterprises rank meeting orchestration, calendar integration, and real-time security controls as baseline requirements. Low-code connectors allow human resources teams to schedule onboarding sessions without IT tickets, widening user bases and lifting per-tenant minute volumes. Vendors differentiate in meeting-lifecycle visualisations that trace attendee engagement down to reaction-emoji frequency.
Content-management platforms, however, are forecast to outpace other categories with a 16.5% CAGR to 2030. Buyers increasingly view metadata, chaptering, and compliance tagging as core. Providers expose these functions through software development kits that insert playback widgets in employee portals. The video as a service market size for content-centric modules is anticipated to expand as retention policies converge with ESG archiving mandates. Device-management submodules now surface energy metrics, letting sustainability teams track per-endpoint power draw, a value add that ties platform renewal conversations to corporate climate goals.
Enterprise computing endpoints still captured 55% of the video as a service market size in 2024. Desktop and laptop clients integrate single sign-on and policy enforcement, supporting regulated industries. Rich screen-share functions and keyboard accessibility features keep knowledge-worker engagement high. Vendors refine background-noise suppression tuned for open-plan offices, improving clarity without raising bitrate.
Mobile devices will add the most net new users at an 18% CAGR between 2025 and 2030. Flagship handsets now support cinematic mode with real-time depth mapping, encouraging marketing teams to produce internal updates entirely on mobile workflows. This shift compresses video production timelines from weeks to hours. The video as a service market share for mobile is expected to broaden once 5G coverage blankets suburban zones, removing reliability hesitation among field staff. At the room scale, demand coalesces around ceiling-mounted 360-degree cameras with intelligent audio zoning, equalising voice pickup for remote participants.
Video As A Service Market is Segmented by Platform (Application Management, Device Management, and More), Device (Mobility Devices, Enterprise Computing, Room-Based Endpoints), Service (Managed, Professional), Deployment Model (Public Cloud, Private Cloud, Hybrid Cloud), End-User Industry (Government and Defense, BFSI, and More), Geography. The Market Forecasts are Provided in Terms of Value (USD).
Geography Analysis
North America preserved leadership with 38% of global revenue in 2024, underpinned by high cloud maturity, robust capital-market appetite for recurring-revenue software, and early AI content-governance deployments. US enterprises integrate speech analytics with executive briefing libraries, while Canadian bilingual regulations spur automatic translation demand. Government-funded broadband grants sustain rural bandwidth, extending video reach into smaller municipalities. The region is also early to trial edge-compute offload, reducing central-cloud hops for IoT video analytics.
Asia-Pacific is projected to post a 17% CAGR to 2030, the fastest among all territories. Singapore added 150 MW of new colocation capacity in 2024, and Seoul doubled 5G standalone coverage, enabling regional SaaS expansion. Many ASEAN enterprises skipped legacy PBX stages altogether, so first-time video roll-outs are natively cloud-based. Linguistic diversity drives in-app caption localisation, creating competitive differentiation for providers with broad language packs. Edge nodes launched in Indonesia and the Philippines trim first-mile jitter, improving experience parity for archipelagic users.
Europe remains defined by stringent data-protection statutes and aggressive decarbonisation goals. A German automotive group replaced 8 000 inter-city flights with video in 2024, lowering Scope 3 emissions intensity by 4%. Emissions auditors accept VaaS dashboards as proxy evidence for avoided travel, anchoring video budgets inside ESG frameworks. Sovereign-cloud preferences fragment vendor support demands across multiple sub-regions. The bloc's Digital Markets Act pushes for open interoperability, nudging providers to adopt standards-based codecs and authentication plugins.
- Cisco Systems Inc.
- Zoom Video Communications Inc.
- Microsoft Corporation
- Google LLC
- Huawei Technologies Co. Ltd.
- Adobe Inc.
- Poly (HP Inc.)
- Avaya LLC
- Brightcove Inc.
- Symphony Communication Services
- Pexip AS
- LogMeIn Inc. (GoTo)
- Agora.io
- RingCentral Inc.
- 8x8 Inc.
- Amazon Web Services (Amazon Chime)
- Orange Business Services
- Vonage
- Tata Communications Ltd.
- Kaltura Inc.
- Genesys Telecommunications Labs
Additional Benefits:
- The market estimate (ME) sheet in Excel format
- 3 months of analyst support
TABLE OF CONTENTS
1 INTRODUCTION
- 1.1 Study Assumptions and Market Definition
- 1.2 Scope of the Study
2 RESEARCH METHODOLOGY
3 EXECUTIVE SUMMARY
4 MARKET LANDSCAPE
- 4.1 Market Overview
- 4.2 Market Drivers
- 4.2.1 Growing Corporate Shift from CAPEX-Heavy Video Infrastructure to OPEX-Friendly Cloud Subscriptions
- 4.2.2 Surging Consumption of Embedded Video APIs in Customer-Facing Apps (Banking, Retail, Tele-health)
- 4.2.3 Proliferation of Low-Latency 5G Networks in North America and Asia Accelerating UHD VaaS Adoption
- 4.2.4 Hybrid-Work Mandates Triggering Multi-Camera Room Upgrades Across Global 1000 Firms
- 4.2.5 AI-Powered Video Content Management Enhancing Compliance and Searchability for Regulated Industries
- 4.2.6 Rising Carbon-Reduction Targets Driving Preference for Cloud Video over Travel in Europe
- 4.3 Market Restraints
- 4.3.1 Persistent Concerns over Sovereign Data Residency in Government and BFSI Verticals
- 4.3.2 High Bandwidth Costs in Emerging African and Caribbean Markets Limiting HD Video Quality
- 4.3.3 Complex Legacy System Integration in Large Telecom and Manufacturing Enterprises
- 4.3.4 Intellectual-Property and Content-Licensing Risks in Cross-Border Video Distribution
- 4.4 Regulatory Outlook
- 4.5 Technological Outlook
- 4.6 Porter's Five Forces Analysis
- 4.6.1 Bargaining Power of Buyers
- 4.6.2 Bargaining Power of Suppliers
- 4.6.3 Threat of New Entrants
- 4.6.4 Threat of Substitutes
- 4.6.5 Intensity of Competitive Rivalry
- 4.7 Assessment of Impact of Macro-Economic Trends
5 MARKET SIZE AND GROWTH FORECASTS (VALUE)
- 5.1 By Platform
- 5.1.1 Application Management
- 5.1.2 Device Management
- 5.1.3 Network Management
- 5.1.4 Video Content Management
- 5.2 By Device
- 5.2.1 Mobility Devices
- 5.2.2 Enterprise Computing
- 5.2.3 Room-based Endpoints
- 5.3 By Service
- 5.3.1 Managed
- 5.3.2 Professional
- 5.4 By Deployment Model
- 5.4.1 Public Cloud
- 5.4.2 Private Cloud
- 5.4.3 Hybrid Cloud
- 5.5 By End-user Industry
- 5.5.1 Government and Defense
- 5.5.2 BFSI
- 5.5.3 Healthcare and Life Sciences
- 5.5.4 IT and Telecom
- 5.5.5 Media and Entertainment
- 5.5.6 Manufacturing
- 5.5.7 Education
- 5.5.8 Retail and E-Commerce
- 5.5.9 Other End-user Industries
- 5.6 By Geography
- 5.6.1 North America
- 5.6.1.1 United States
- 5.6.1.2 Canada
- 5.6.1.3 Mexico
- 5.6.2 South America
- 5.6.2.1 Brazil
- 5.6.2.2 Argentina
- 5.6.2.3 Rest of South America
- 5.6.3 Europe
- 5.6.3.1 Germany
- 5.6.3.2 United Kingdom
- 5.6.3.3 France
- 5.6.3.4 Italy
- 5.6.3.5 Spain
- 5.6.3.6 Rest of Europe
- 5.6.4 Asia-Pacific
- 5.6.4.1 China
- 5.6.4.2 Japan
- 5.6.4.3 South Korea
- 5.6.4.4 India
- 5.6.4.5 Australia
- 5.6.4.6 New Zealand
- 5.6.4.7 Rest of Asia-Pacific
- 5.6.5 Middle East and Africa
- 5.6.5.1 United Arab Emirates
- 5.6.5.2 Saudi Arabia
- 5.6.5.3 South Africa
- 5.6.5.4 Rest of Middle East and Africa
- 5.6.1 North America
6 COMPETITIVE LANDSCAPE
- 6.1 Strategic Developments
- 6.2 Vendor Positioning Analysis
- 6.3 Company Profiles (includes Global level Overview, Market level overview, Core Segments, Financials as available, Strategic Information, Products and Services, and Recent Developments)
- 6.3.1 Cisco Systems Inc.
- 6.3.2 Zoom Video Communications Inc.
- 6.3.3 Microsoft Corporation
- 6.3.4 Google LLC
- 6.3.5 Huawei Technologies Co. Ltd.
- 6.3.6 Adobe Inc.
- 6.3.7 Poly (HP Inc.)
- 6.3.8 Avaya LLC
- 6.3.9 Brightcove Inc.
- 6.3.10 Symphony Communication Services
- 6.3.11 Pexip AS
- 6.3.12 LogMeIn Inc. (GoTo)
- 6.3.13 Agora.io
- 6.3.14 RingCentral Inc.
- 6.3.15 8x8 Inc.
- 6.3.16 Amazon Web Services (Amazon Chime)
- 6.3.17 Orange Business Services
- 6.3.18 Vonage
- 6.3.19 Tata Communications Ltd.
- 6.3.20 Kaltura Inc.
- 6.3.21 Genesys Telecommunications Labs
7 MARKET OPPORTUNITIES AND FUTURE OUTLOOK
- 7.1 White-space and Unmet-Need Assessment
 視訊即服務 (VaaS) 市場:2026-2032 年全球市場預測(按服務類型、組件、部署模式、組織規模和行業分類)
 2026年全球視訊即服務(VaaS)市場報告
 視訊即服務市場分析及至2035年預測:按類型、產品類型、服務、技術、組件、應用、部署類型、最終用戶、解決方案和模式分類
 全球影片發送服務市場規模、佔有率、趨勢和成長分析報告(2026-2034)視訊即服務 (VaaS) 市場規模、佔有率、成長及全球產業分析:依類型、應用和地區劃分的洞察與預測 (2026–2034)
 視訊即服務市場規模、佔有率和成長分析(按應用程式、部署類型、垂直產業和地區分類)-2026-2033年產業預測
 2025-2029 年全球視訊即服務市場
 視訊即服務市場-全球產業規模、佔有率、趨勢、機會與預測(按應用程式、按雲端部署模式、按垂直產業、按地區、按競爭細分,2020-2030 年)
 VaaS(視訊即服務)市場規模、佔有率、趨勢分析報告:按應用程式、雲端部署模式、產業、地區和細分市場預測,2025-2030 年
 亞太地區視訊即服務市場預測至 2030 年 - 區域分析 - 按部署模式和產業垂直