


 |
市場調查報告書
商品編碼
1849842
擴增實境:市場佔有率分析、產業趨勢、統計數據和成長預測(2025-2030)Augmented Reality - Market Share Analysis, Industry Trends & Statistics, Growth Forecasts (2025 - 2030) |
||||||
※ 本網頁內容可能與最新版本有所差異。詳細情況請與我們聯繫。
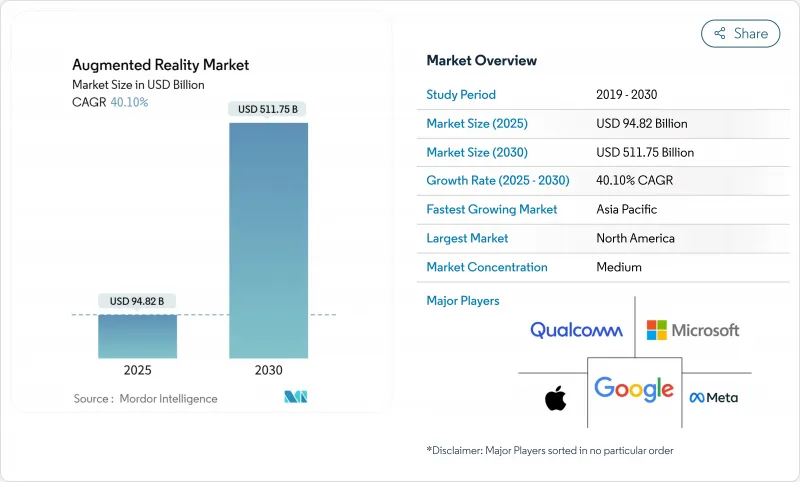
擴增實境市場規模預計將在 2025 年達到 948.2 億美元,到 2030 年將增至 5,117.5 億美元,複合年成長率為 40.1%。
隨著 5G 網路消除延遲障礙、自主 AI 政策推動裝置端推理,以及 Apple Vision Pro檢驗空間運算用例,需求將加速成長。製造業、醫療保健業和能源業的公司正在標準化數位雙胞胎疊加,以縮短決策週期,而生成式 AI 工具則將內容開發時間從數月縮短至數天。波導和 MicroLED 領域的硬體創新仍在持續,以雲端為中心的軟體平台發展更為迅速,使企業無需繁重的基礎設施即可將試點計畫擴展到全球工廠。隨著企業將敏感資料從消費級智慧型手機遷移到託管的工業終端,安全增強的 AR 堆疊和邊緣最佳化的渲染正成為預設需求。
全球擴增實境市場趨勢與洞察
相容5G的低延遲行動網路
獨立 5G 可實現低於 20 毫秒的往返時間,從而實現共用全像圖的即時位置更新。愛立信報告稱,當設備透過邊緣運算切片連接時,AR 會話持續時間更長,因為邊緣運算切片優先處理空間資料流量。採用私人 5G 的製造工廠(例如捷克共和國的核能發電廠)在引導式檢查期間的效率和安全性均有所提高。通訊業者將擴增實境市場視為一種高階附加提升銷售,以抵消語音收入的下滑,鼓勵開發人員投資於能夠提供不同服務品質等級的網路 API。 6G 已準備就緒,目標是實現Terabit吞吐量,這將使輕量級眼鏡能夠無需網路共享即可傳輸大容量影片,從而增強了兩位數成長的預測。
智慧型手機普及率和 AR 應用不斷提升
2024年,亞太地區將新增1.3億行動用戶,普及率將達51%,為AR商務創造豐富的裝置量。 IKEA和歐萊雅的零售試點計畫表明,顧客能夠以真人大小的視覺比例觀看產品,從而將停留時間延長至10分鐘以上。智慧型手機的光學系統在室內導航方面仍有問題,大阪大學也觀察到了由漂移引起的暈動症。即便如此,智慧型手機仍然是許多首次使用AR用戶的入門平台,在大眾市場眼鏡上市之前,它已經培育了一個開發者生態系統。
頭戴式顯示器的電池壽命和人體工學
目前的設備重量接近100克,續航時間很少超過兩小時。蘋果的Vision Pro凸顯了microOLED的高亮度會快速耗盡電池的弊端。東京大學的研究人員提案了一種外置「光束顯示器」的方案,以將電力消耗轉移給頭戴裝置。 HoloLens 2的能耗分析表明,顯示器亮度佔功耗的62%,而軟體調光和場景感知渲染可以將使用時間延長多達五分之一。雖然工業用戶在執行有限任務時可以接受更重的設備,但大眾消費者的普及將取決於真正的全天候穿戴式裝置。
細分分析
到2024年,硬體將佔擴增擴增實境市場收入的67.5%。組件供應商正在提升波導管效率和MicroLED亮度,延長電池壽命並實現戶外使用。三星的LEDoS藍圖目標是到2027年實現量產,並承諾推出適用於企業級和生活級眼鏡的纖薄光學元件。雖然硬體仍然至關重要,但雲端優先平台使企業能夠在現有行動裝置上試行擴增現實,從而降低小型工廠和診所的門檻。因此,預計軟體的複合年成長率將達到42.0%,到2030年縮小收益差距。允許第三方原始設備製造商預先安裝成熟作業系統的授權策略,可以效仿PC生態系統,加速應用程式跨裝置的可移植性。
雲端編配工具整合了生成式AI模組,可自動將CAD元件轉換為有序的全像指令,從而將部署時間縮短三分之二。訂閱定價將投資從資本支出轉移到營運預算,這與企業數位化的要求一致。設備成本的下降和平台複雜性的提升,共同支撐著擴增實境市場的持續擴張。
到2024年,波導管和衍射光學元件將佔市場收益的51.3%。肖特公司新建的克利姆工廠將提升玻璃毛坯產能,但MicroLED創新正在蠶食現有的市場佔有率。 Mojo Vision的單晶片RGB陣列效能優於傳統顯示器,像素密度達到6,350 PPI,同時功耗減半。富士康與Polotek合作,將於2025年開始晶圓加工,顯示供應鏈正在為量產做準備。隨著產量比率的提高,MicroLED模組將從開發套件轉向消費級眼鏡產品,從而改變成本結構並提高戶外可視度。
製造商正在將 MicroLED 面板與薄餅透鏡和多層塗層相結合,以增強對比度。對於廉價頭戴式設備而言,液晶矽)仍然是一個可行的選擇,尤其是在培訓亭中,因為緊湊性比日間可視性更重要。在預測期內,MicroLED 的快速效率提升預計將首先改變高階用例,然後蔓延至中端產品,從而重塑整個擴增實境市場的技術藍圖。
區域分析
北美將主導擴增實境市場,到2024年將佔總收入的38.6%。國防和公共機構的政府合約將為堅固耐用的頭顯提供穩定的需求,而可預測的FDA核准途徑將加速臨床部署。創投集中在矽谷和西雅圖,為平台型新興企業隨後將在墨西哥和加拿大拓展製造夥伴關係關係,從而增強區域生態系統。
亞太地區的複合年成長率最高,達40.8%,其中中國投入3.33兆元人民幣的研發資金,用於津貼零件代工廠和軟體研究實驗室。日本的富嶽超級電腦正在支援即時空間映射的演算法訓練,這將使國內光學供應商受益。韓國的「元宇宙藍圖」計畫獲得了55億韓元的激勵,旨在2026年培育220家身臨其境型科技公司。該地區的行動經濟將為GDP貢獻8,800億美元,確保龐大的面向消費者的市場,並促進擴增實境市場硬體的規模化發展。
歐洲保持平衡的發展軌跡。德國正在利用擴增實境技術最佳化其汽車和機械組裝,實現了兩位數的品質提升。歐盟要求遵守《一般資料保護規範》(GDPR),這迫使供應商採用保護隱私的設計實踐,這些實踐日後將成為全球規範。法國和荷蘭的智慧城市基金正在資助公共交通的擴增實境導航試點項目,使其為市民所熟悉。儘管亞太地區的成長滯後,但歐洲製造業的嚴謹性支撐了擴增實境市場的很大一部分,並正在塑造全球採用的安全標準。
其他福利:
- Excel 格式的市場預測 (ME) 表
- 3個月的分析師支持
目錄
第1章 引言
- 研究假設和市場定義
- 調查範圍
第2章調查方法
第3章執行摘要
第4章 市場狀況
- 市場概況
- 市場促進因素
- 相容5G的低延遲行動網路
- 智慧型手機普及率和 AR 應用不斷提升
- 提高企業培訓和現場服務的效率
- 用於快速創建 AR 內容的生成式 AI 工具
- 用於即時物聯網資料的工業數位雙胞胎疊加
- 推動Apple Vision-Pro主導的空間運算生態系統
- 市場限制
- 頭戴式顯示器的電池壽命和人體工學
- 隱私和資料安全問題
- 光波導玻璃供應瓶頸
- 開發人員標準分散和跨平台問題
- 價值鏈分析
- 監管格局
- 技術展望
- 雲端運算
- 人工智慧
- 網路安全
- 數位服務
- 波特五力分析
- 供應商的議價能力
- 買方的議價能力
- 新進入者的威脅
- 替代品的威脅
- 競爭對手之間的競爭
- 投資分析
- 評估宏觀經濟趨勢對市場的影響
第5章市場規模及成長預測
- 按報價
- 硬體
- 獨立式 HMD
- 系留式 HMD
- 無螢幕檢視器
- 軟體
- 硬體
- 核心技術
- OLED/微型OLED
- 微型 LED
- 波導管與衍射光學
- 液晶矽(LCOS)
- 按用途
- 遠端援助與維護
- 產品視覺化和配置
- 導航和地圖繪製
- 社交和溝通過濾器
- 其他用途
- 按最終用戶
- 遊戲和娛樂
- 教育
- 衛生保健
- 零售
- 汽車和運輸
- 其他最終用戶領域
- 按地區
- 北美洲
- 美國
- 加拿大
- 墨西哥
- 歐洲
- 德國
- 英國
- 法國
- 義大利
- 西班牙
- 其他歐洲地區
- 亞太地區
- 中國
- 日本
- 印度
- 韓國
- 澳洲
- 其他亞太地區
- 南美洲
- 巴西
- 阿根廷
- 南美洲其他地區
- 中東和非洲
- 中東
- 沙烏地阿拉伯
- 阿拉伯聯合大公國
- 土耳其
- 其他中東地區
- 非洲
- 南非
- 埃及
- 奈及利亞
- 其他非洲國家
- 北美洲
第6章 競爭態勢
- 市場集中度
- 策略趨勢
- 市佔率分析
- 公司簡介
- Microsoft Corporation
- Google LLC(Alphabet)
- Meta Platforms Inc.
- Apple Inc.
- Snap Inc.
- Niantic Inc.
- PTC Inc.
- Vuzix Corporation
- Magic Leap Inc.
- Seiko Epson Corporation
- RealWear Inc.
- Lenovo Group Ltd.
- Fujitsu Ltd.
- Kopin Corporation
- Qualcomm Technologies Inc.
- Unity Technologies
- Dynabook Europe GmbH
- Optinvent SA
- Immersion Corporation
第7章 市場機會與未來展望
The Augmented Reality market size reached USD 94.82 billion in 2025 and is projected to climb to USD 511.75 billion by 2030, reflecting a 40.1% CAGR.
Demand accelerates as 5G networks remove latency barriers, sovereign AI policies push on-device inference, and Apple's Vision Pro validates spatial-computing use cases. Enterprises in manufacturing, healthcare, and energy are standardizing digital-twin overlays to shorten decision cycles, while generative-AI tools shrink content-development time from months to days. Hardware innovation in waveguides and MicroLEDs continues, yet cloud-centric software platforms are growing even faster, enabling organizations to scale pilots across global plants without heavy infrastructure. Security-hardened AR stacks and edge-optimized rendering are becoming default requirements as companies move sensitive data off consumer smartphones and into managed industrial endpoints.
Global Augmented Reality Market Trends and Insights
5G-enabled Low-latency Mobile Networks
Sub-20 millisecond round-trip times now achievable on standalone 5G allow real-time positional updates for shared holograms. Ericsson reports higher AR session durations when devices connect through edge-computing slices that prioritize spatial data traffic. Manufacturing sites adopting private 5G-such as nuclear plants in the Czech Republic-have documented efficiency lifts and safety gains during guided inspections. Operators view the Augmented Reality market as a premium upsell that offsets shrinking voice revenues, prompting investment in network APIs that expose quality-of-service tiers to developers. Preparations for 6G, targeting terabit throughput, will enable lightweight glasses to stream volumetric video without tethering, reinforcing double-digit growth forecasts.
Rising Smartphone Penetration and AR-ready Apps
Asia-Pacific added 130 million mobile subscribers in 2024, bringing penetration to 51% and creating a fertile install base for AR commerce. Retail pilots from IKEA and L'Oreal show dwell-time gains exceeding 10 minutes when customers visualize products in real scale. Smartphone optics still struggle in indoor navigation, where Osaka University observed drift-induced motion sickness; research points to ultra-wideband anchors as a remedy. Nevertheless, the handset remains the on-ramp for many first-time AR users, nurturing developer ecosystems ahead of mass-market glasses.
Battery-life and Ergonomics of Head-mounted Displays
Current devices weigh near 100 grams and seldom exceed two hours of operation. Apple's Vision Pro highlights the trade-off: high micro-OLED brightness drains batteries quickly. University of Tokyo researchers propose off-board "beaming displays" to shift power draw away from the headset. Energy profiling of HoloLens 2 shows display brightness accounts for 62% of consumption, implying software dimming and scene-aware rendering can stretch sessions by one-fifth. Industrial users accept heavier gear for limited tasks, yet mass-consumer uptake hinges on true all-day wearables.
Other drivers and restraints analyzed in the detailed report include:
- Enterprise Training and Field-service Efficiency Gains
- Generative-AI Tools for Rapid AR Content Creation
- Privacy and Data-security Concerns
For complete list of drivers and restraints, kindly check the Table Of Contents.
Segment Analysis
Hardware captured 67.5% of Augmented Reality market revenue in 2024 on the strength of stand-alone and tethered head-mounted displays. Component vendors push waveguide efficiency and MicroLED brightness to extend battery life and enable outdoor use. Samsung's LEDoS roadmap targets mass production before 2027, promising slimmer optics that suit both enterprise and lifestyle glasses. While hardware remains indispensable, cloud-first platforms now let firms pilot AR with existing mobile devices, lowering barriers for smaller factories and clinics. As a result, software is set to post a 42.0% CAGR and will narrow the revenue gap by 2030. Licensing strategies that let third-party OEMs preload mature operating systems mirror the PC ecosystem and accelerate application portability across devices.
Cloud orchestration tools embed generative-AI modules that auto-convert CAD assemblies into sequenced holographic instructions, trimming deployment time by two-thirds. Subscription pricing shifts investment from capital expenditure to operating budgets, aligning with enterprise digitization mandates. This blend of falling device costs and rising platform sophistication underpins sustained expansion across the Augmented Reality market.
Waveguide and diffractive optics controlled 51.3% market revenue in 2024, reflecting incumbent manufacturing depth. SCHOTT's new Kulim facility lifts glass-blank capacity, yet MicroLED innovations are eroding incumbent share. Mojo Vision's monolithic RGB array delivered 6,350 PPI while halving power draw, marking a leap over traditional displays. Foxconn's partnership with Porotech to start wafer processing in 2025 signals that supply chains are preparing for volume. As yields improve, MicroLED modules will move from developer kits into consumer eyewear, shifting cost structures and brightening outdoor legibility.
Manufacturers pair MicroLED panels with pancake lenses and multilayer coatings to enhance contrast. Liquid-Crystal-on-Silicon remains relevant for budget headsets, especially in training kiosks where compactness trumps daylight visibility. Over the forecast window, MicroLED's rapid efficiency gains are expected to convert high-performance use cases first, then cascade into mid-tier products, reshaping technical roadmaps across the Augmented Reality market.
The Augmented Reality Market Report is Segmented by Offering (Hardware and Software), Core Technology (OLED / Micro-OLED, Microled, Waveguide and Diffractive Optics, and More), Application (Remote Assistance and Maintenance, Product Visualisation and Configuration, and More), End-User Vertical (Gaming and Entertainment, Education, Healthcare, and More), and Geography. The Market Forecasts are Provided in Terms of Value (USD).
Geography Analysis
North America dominated with 38.6% Augmented Reality market revenue in 2024 owing to deep enterprise adoption and robust 5G coverage. Government contracts from defense and public-safety agencies provide steady demand for ruggedized headsets, while the FDA's predictable approval pathway accelerates medical deployments. Venture investment concentrates in Silicon Valley and Seattle, funding platform startups that later expand manufacturing partnerships in Mexico and Canada, reinforcing the regional ecosystem.
Asia-Pacific posted the highest 40.8% CAGR outlook, fueled by China's 3.33 trillion-yuan R&D pool that subsidizes component foundries and software labs. Japan's Fugaku supercomputer supports algorithm training for real-time spatial mapping, benefitting domestic optical suppliers. South Korea's metaverse blueprint aims to nurture 220 immersive-tech firms by 2026, backed by 5.5 billion won in incentives. The region's mobile economy, adding USD 880 billion in GDP impact, ensures massive consumer addressable markets, smoothing hardware scale-up across the Augmented Reality market.
Europe maintains a balanced trajectory. Germany leverages AR to optimize automotive and machinery assembly lines, achieving double-digit quality gains. The EU's GDPR compliance pressure forces vendors to embed privacy-preserving designs that later become global norms. Smart-city funds in France and the Netherlands finance AR navigation pilots for public transportation, expanding citizen familiarity. Though growth lags Asia-Pacific, European manufacturing rigor sustains a sizable slice of the Augmented Reality market and shapes safety standards adopted worldwide.
- Microsoft Corporation
- Google LLC (Alphabet)
- Meta Platforms Inc.
- Apple Inc.
- Snap Inc.
- Niantic Inc.
- PTC Inc.
- Vuzix Corporation
- Magic Leap Inc.
- Seiko Epson Corporation
- RealWear Inc.
- Lenovo Group Ltd.
- Fujitsu Ltd.
- Kopin Corporation
- Qualcomm Technologies Inc.
- Unity Technologies
- Dynabook Europe GmbH
- Optinvent SA
- Immersion Corporation
Additional Benefits:
- The market estimate (ME) sheet in Excel format
- 3 months of analyst support
TABLE OF CONTENTS
1 INTRODUCTION
- 1.1 Study Assumptions and Market Definition
- 1.2 Scope of the Study
2 RESEARCH METHODOLOGY
3 EXECUTIVE SUMMARY
4 MARKET LANDSCAPE
- 4.1 Market Overview
- 4.2 Market Drivers
- 4.2.1 5G-enabled low-latency mobile networks
- 4.2.2 Rising smartphone penetration and AR-ready apps
- 4.2.3 Enterprise training and field-service efficiency gains
- 4.2.4 Generative-AI tools for rapid AR content creation
- 4.2.5 Industrial digital-twin overlays for real-time IoT data
- 4.2.6 Apple Vision-Pro-led spatial-computing ecosystem push
- 4.3 Market Restraints
- 4.3.1 Battery-life and ergonomics of head-mounted displays
- 4.3.2 Privacy and data-security concerns
- 4.3.3 Optical-waveguide glass supply bottlenecks
- 4.3.4 Fragmented developer standards and cross-platform issues
- 4.4 Value Chain Analysis
- 4.5 Regulatory Landscape
- 4.6 Technological Outlook
- 4.6.1 Cloud Computing
- 4.6.2 Artificial Intelligence
- 4.6.3 Cyber-Security
- 4.6.4 Digital Services
- 4.7 Porter's Five Forces Analysis
- 4.7.1 Bargaining Power of Suppliers
- 4.7.2 Bargaining Power of Buyers
- 4.7.3 Threat of New Entrants
- 4.7.4 Threat of Substitutes
- 4.7.5 Intensity of Competitive Rivalry
- 4.8 Investment Analysis
- 4.9 Assessment of the Impact of Macroeconomic Trends on the Market
5 MARKET SIZE AND GROWTH FORECASTS (VALUE)
- 5.1 By Offering
- 5.1.1 Hardware
- 5.1.1.1 Stand-alone HMDs
- 5.1.1.2 Tethered HMDs
- 5.1.1.3 Screenless Viewers
- 5.1.2 Software
- 5.1.1 Hardware
- 5.2 By Core Technology
- 5.2.1 OLED / Micro-OLED
- 5.2.2 MicroLED
- 5.2.3 Waveguide and Diffractive Optics
- 5.2.4 Liquid-Crystal-on-Silicon (LCOS)
- 5.3 By Application
- 5.3.1 Remote Assistance and Maintenance
- 5.3.2 Product Visualisation and Configuration
- 5.3.3 Navigation and Mapping
- 5.3.4 Social and Communication Filters
- 5.3.5 Other Applications
- 5.4 By End-user Vertical
- 5.4.1 Gaming and Entertainment
- 5.4.2 Education
- 5.4.3 Healthcare
- 5.4.4 Retail
- 5.4.5 Automotive and Transportation
- 5.4.6 Other End-User Verticals
- 5.5 By Geography
- 5.5.1 North America
- 5.5.1.1 United States
- 5.5.1.2 Canada
- 5.5.1.3 Mexico
- 5.5.2 Europe
- 5.5.2.1 Germany
- 5.5.2.2 United Kingdom
- 5.5.2.3 France
- 5.5.2.4 Italy
- 5.5.2.5 Spain
- 5.5.2.6 Rest of Europe
- 5.5.3 Asia-Pacific
- 5.5.3.1 China
- 5.5.3.2 Japan
- 5.5.3.3 India
- 5.5.3.4 South Korea
- 5.5.3.5 Australia
- 5.5.3.6 Rest of Asia-Pacific
- 5.5.4 South America
- 5.5.4.1 Brazil
- 5.5.4.2 Argentina
- 5.5.4.3 Rest of South America
- 5.5.5 Middle East and Africa
- 5.5.5.1 Middle East
- 5.5.5.1.1 Saudi Arabia
- 5.5.5.1.2 United Arab Emirates
- 5.5.5.1.3 Turkey
- 5.5.5.1.4 Rest of Middle East
- 5.5.5.2 Africa
- 5.5.5.2.1 South Africa
- 5.5.5.2.2 Egypt
- 5.5.5.2.3 Nigeria
- 5.5.5.2.4 Rest of Africa
- 5.5.1 North America
6 COMPETITIVE LANDSCAPE
- 6.1 Market Concentration
- 6.2 Strategic Moves
- 6.3 Market Share Analysis
- 6.4 Company Profiles (includes Global level Overview, Market level overview, Core Segments, Financials as available, Strategic Information, Market Rank/Share for key companies, Products and Services, and Recent Developments)
- 6.4.1 Microsoft Corporation
- 6.4.2 Google LLC (Alphabet)
- 6.4.3 Meta Platforms Inc.
- 6.4.4 Apple Inc.
- 6.4.5 Snap Inc.
- 6.4.6 Niantic Inc.
- 6.4.7 PTC Inc.
- 6.4.8 Vuzix Corporation
- 6.4.9 Magic Leap Inc.
- 6.4.10 Seiko Epson Corporation
- 6.4.11 RealWear Inc.
- 6.4.12 Lenovo Group Ltd.
- 6.4.13 Fujitsu Ltd.
- 6.4.14 Kopin Corporation
- 6.4.15 Qualcomm Technologies Inc.
- 6.4.16 Unity Technologies
- 6.4.17 Dynabook Europe GmbH
- 6.4.18 Optinvent SA
- 6.4.19 Immersion Corporation
7 MARKET OPPORTUNITIES AND FUTURE OUTLOOK
- 7.1 White-space and Unmet-need Assessment
 2026年全球空間運算軟體開發工具包(SDK)市場報告
 供應鏈市場中的擴增實境(AR)技術:按組件、應用和最終用戶分類-2026年至2032年全球市場預測擴增實境(AR)市場:按組件、技術、互動方式、最終用途和應用分類-2026-2032年全球市場預測數位學習中的擴增實境(AR)市場:組件、技術、應用、部署模式與最終用途-2026-2032年全球市場預測2026年全球廣告人工智慧市場報告航空領域擴增實境(AR)和虛擬實境(VR)市場:按技術、交付方式、部署方式、應用和最終用途分類-2026年至2032年全球市場預測2026年全球擴增實境(AR)射箭訓練器市場報告2026年擴增實境全球市場報告
 擴增實境(AR)市場分析及預測(至2035年):按類型、產品、服務、技術、組件、應用、設備、部署和最終用戶分類2026年全球空間計算市場報告