


 |
市場調查報告書
商品編碼
1849814
虛擬實境 (VR):市場佔有率分析、產業趨勢、統計數據和成長預測(2025-2030 年)Virtual Reality (VR) - Market Share Analysis, Industry Trends & Statistics, Growth Forecasts (2025 - 2030) |
||||||
※ 本網頁內容可能與最新版本有所差異。詳細情況請與我們聯繫。
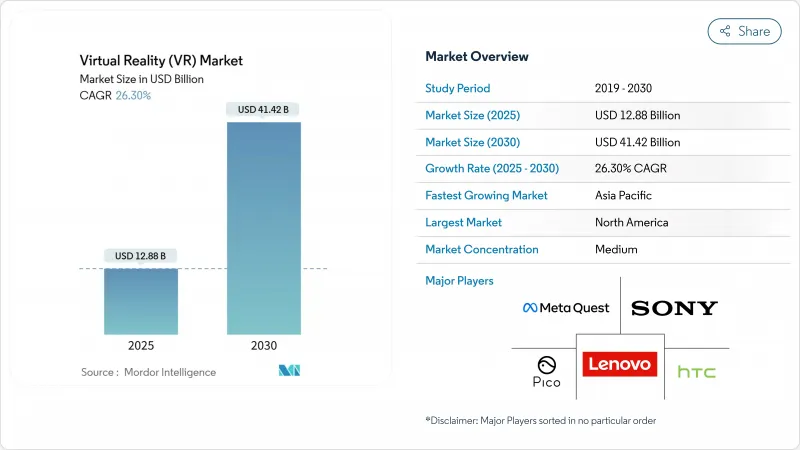
虛擬實境市場規模預計在 2025 年達到 128.8 億美元,預計到 2030 年將達到 414.2 億美元,複合年成長率為 26.30%。
企業快速採用身臨其境型訓練平台、混合實境處理器日益普及以及5G邊緣基礎設施日趨成熟,這些因素共同支撐著這項擴張。企業淨零排放承諾正在加速對線上優先活動的需求,而監管部門對治療應用的批准則正在拓展該技術的覆蓋範圍,使其超越娛樂領域。雖然硬體創新仍然至關重要,但隨著企業優先考慮客製化內容、強大的分析能力以及與學習管理系統的無縫整合,軟體和服務也正在蓬勃發展。
全球虛擬實境 (VR) 市場趨勢與洞察
企業擴大採用 VR 培訓
試辦成功後,各公司紛紛全面推廣VR培訓項目,並表示與傳統方法相比,VR訓練時間縮短了75%,學員信心提升了275%。波音公司將訓練時間縮短了75%,Delta航空將技術人員的熟練度評估提高了5000%。培訓人數達375人即可達到收支平衡,而一旦培訓人數超過3000人,成本效益將提升52%。超過75%的《財富》500強企業現已將VR納入其學習策略,包括沃爾瑪的零售模擬和美國的心理健康模組,而日本Sompo等保險公司也在實施VR危險模擬,以減少職場事故。結果是,員工的知識保留率更高,在職表現更安全,從而牢固確立了培訓作為企業進入虛擬實境市場的重要切入點的地位。
混合實境GPU 和 SoC 成為主流
高通驍龍 XR2+ Gen 2 等下一代晶片組將實現單眼 4.3K 解析度,並協調 12 個攝影機進行空間映射,為中階頭顯帶來旗艦級性能。蘋果 Vision Pro 採用雙晶片驅動 2,300 萬像素微型 OLED 面板,展現出處理需求曲線。僅顯示組件一項就使單價增加 530 美元,因此動態注視點渲染和眼動追蹤技術對於提升效率至關重要。三星-谷歌-高通的合作標誌著這些矽晶圓技術進步的商業化,將逐步降低價格分佈並拓寬虛擬實境市場的准入。
暈屏症和長期前庭問題
運動與光線不匹配會導致噁心、頭痛和方向感喪失,進而影響長時間的體驗。感官不匹配的研究表明,視覺-前庭不匹配是一個關鍵因素,而設備抖動導致的行動VR複雜性加劇了這個問題。 FDA醫用頭戴式耳機指南要求在顯著位置標註噁心警告,以強調其臨床意義。儘管硬體製造商追求更高的刷新率和更短的延遲,但生理限制仍然存在。一些公司為了降低風險,選擇使用更短的模組,這推高了內容設計成本,並減緩了虛擬實境市場近期的成長。
其他福利:
- Excel 格式的市場預測 (ME) 表
- 3個月的分析師支持
目錄
第1章 引言
- 研究假設和市場定義
- 調查範圍
第2章調查方法
第3章執行摘要
第4章 市場狀況
- 市場概況
- 市場促進因素
- 企業擴大採用 VR 培訓
- 「混合實境」 GPU 和 SoC 的普及
- 使用 5G/Edge 進行 VR 內容的無線傳輸
- 企業淨零承諾推動「虛擬優先」活動
- VR 心理健康治療獲得監管部門核准
- 超音波觸覺技術可實現無需控制器的互動
- 市場限制
- 暈動症和長期前庭功能障礙
- 眼罩內的熱量累積限制了連續使用
- 遊戲以外缺乏 AAA VR 內容
- 眼動追蹤分析中的資料隱私合規成本
- 供應鏈分析
- 監管格局
- 技術展望
- 波特五力分析
- 供應商的議價能力
- 買方的議價能力
- 新進入者的威脅
- 替代品的威脅
- 競爭的激烈程度
- 宏觀經濟因素評估
第5章市場規模及成長預測
- 按報價
- 硬體
- 軟體
- 服務
- 按設備外形尺寸
- 系留式 HMD
- 獨立式 HMD
- 無螢幕檢視器
- CAVE/身臨其境型房間
- 依沉浸程度
- 非身臨其境型
- 半身臨其境型
- 完全身臨其境型
- 按最終用戶產業
- 遊戲
- 媒體和娛樂
- 衛生保健
- 教育和培訓
- 軍事和國防
- 零售與電子商務
- 房地產和建築
- 按地區
- 北美洲
- 美國
- 加拿大
- 墨西哥
- 南美洲
- 巴西
- 阿根廷
- 南美洲其他地區
- 歐洲
- 德國
- 英國
- 法國
- 義大利
- 西班牙
- 其他歐洲地區
- 亞太地區
- 中國
- 日本
- 印度
- 韓國
- 澳洲
- 其他亞太地區
- 中東和非洲
- 中東
- 沙烏地阿拉伯
- 阿拉伯聯合大公國
- 土耳其
- 其他中東地區
- 非洲
- 南非
- 奈及利亞
- 埃及
- 其他非洲國家
- 北美洲
第6章 競爭態勢
- 市場集中度
- 策略趨勢
- 市佔率分析
- 公司簡介
- Meta Platforms(Meta Quest)
- Sony Corporation
- HTC Corporation
- Samsung Electronics Co. Ltd
- Apple Inc.
- Qualcomm Technologies Inc.
- Lenovo Group Ltd
- Pico Interactive Inc.
- Valve Corporation
- Varjo Technologies Oy
- Microsoft Corporation
- Magic Leap Inc.
- Vuzix Corporation
- FOVE Inc.
- DPVR(Lexiang Tech Co. Ltd)
- Unity Technologies Inc.
- Unreal Engine(Epic Games Inc.)
- Autodesk Inc.
- Dassault Systemes SE
- 3D Systems Corporation
第7章 市場機會與未來展望
The Virtual Reality market size is estimated at USD 12.88 billion in 2025 and is projected to reach USD 41.42 billion by 2030, advancing at a 26.30% CAGR.
Rapid enterprise adoption of immersive training platforms, rising availability of mixed-reality-ready processors, and maturing 5G edge infrastructure underpin this expansion. Corporate net-zero pledges accelerate demand for virtual-first events, while regulatory clearances for therapeutic applications extend the technology's reach beyond entertainment. Hardware innovation remains vital, yet software and services gain momentum as organizations prioritize tailored content, robust analytics, and seamless integration with learning-management systems.
Global Virtual Reality (VR) Market Trends and Insights
Rising Enterprise-Wide VR Training Adoption
Organizations roll out full-scale VR training programs after pilot success, citing a 75% reduction in training time and a 275% jump in learner confidence versus conventional methods. Boeing recorded a 75% cut in training hours, and Delta Air Lines raised technician proficiency checks by 5,000%. Break-even arrives at 375 learners and becomes 52% more cost-effective once cohorts exceed 3,000. Over 75% of Fortune 500 companies now embed VR in learning strategies, including Walmart's retail simulations and the U.S. Army's mental-health modules, while Japanese insurers such as SOMPO deploy VR hazard simulations to curb workplace incidents. The outcome is stronger knowledge retention and safer on-the-job performance, cementing training as the principal enterprise gateway into the Virtual Reality market.
Mainstreaming of Mixed-Reality-Ready GPUs and SoCs
Next-generation chipsets like Qualcomm's Snapdragon XR2+ Gen 2 deliver 4.3 K-per-eye resolution and orchestrate a dozen cameras for spatial mapping, bringing flagship performance to mid-range headsets. Apple's Vision Pro employs dual chips to drive 23 million-pixel micro-OLED panels, illustrating processing demand curves. Display components alone add USD 530 to unit costs, so dynamic foveated rendering and eye-tracking become essential for efficiency. Samsung's three-way alliance with Google and Qualcomm signals mainstream commercialisation of these silicon advances, progressively lowering price points and broadening access to the Virtual Reality market.
Cybersickness and Long-Term Vestibular Concerns
Motion-to-photon discrepancies trigger nausea, headache, and disorientation, discouraging extended sessions. Sensory-conflict research pinpoints combined visual-vestibular mismatch as the main cause, intensified in mobile VR where device sway adds complexity. FDA guidelines for medical-grade headsets mandate prominent nausea warnings, highlighting clinical gravity. Hardware makers pursue higher refresh rates and latency cuts, yet physiological limits persist. Enterprises mitigate risk through shorter modules, raising content design costs and dampening near-term Virtual Reality market growth.
Other drivers and restraints analyzed in the detailed report include:
- 5G/Edge-Powered Untethered Streaming of VR Content
- Corporate Net-Zero Pledges Driving Virtual-First Events
- Eye-Box Heat Build-Up Limiting Continuous Usage
For complete list of drivers and restraints, kindly check the Table Of Contents.
List of Companies Covered in this Report:
- Meta Platforms (Meta Quest)
- Sony Corporation
- HTC Corporation
- Samsung Electronics Co. Ltd
- Apple Inc.
- Qualcomm Technologies Inc.
- Lenovo Group Ltd
- Pico Interactive Inc.
- Valve Corporation
- Varjo Technologies Oy
- Microsoft Corporation
- Magic Leap Inc.
- Vuzix Corporation
- FOVE Inc.
- DPVR (Lexiang Tech Co. Ltd)
- Unity Technologies Inc.
- Unreal Engine (Epic Games Inc.)
- Autodesk Inc.
- Dassault Systemes SE
- 3D Systems Corporation
Additional Benefits:
- The market estimate (ME) sheet in Excel format
- 3 months of analyst support
TABLE OF CONTENTS
1 INTRODUCTION
- 1.1 Study Assumptions and Market Definition
- 1.2 Scope of the Study
2 RESEARCH METHODOLOGY
3 EXECUTIVE SUMMARY
4 MARKET LANDSCAPE
- 4.1 Market Overview
- 4.2 Market Drivers
- 4.2.1 Rising enterprise-wide VR training adoption
- 4.2.2 Mainstreaming of "mixed reality-ready" GPUs and SoCs
- 4.2.3 5G/Edge-powered untethered streaming of VR content
- 4.2.4 Corporate Net-Zero pledges driving 'virtual-first' events
- 4.2.5 Regulatory approvals for VR-based mental-health therapies
- 4.2.6 Ultrasound-haptics enabling controller-free interaction
- 4.3 Market Restraints
- 4.3.1 Cybersickness and long-term vestibular concerns
- 4.3.2 Eye-box heat build-up limiting continuous usage
- 4.3.3 Scarcity of AAA-grade VR content outside gaming
- 4.3.4 Data-privacy compliance costs for eye-tracking analytics
- 4.4 Supply-Chain Analysis
- 4.5 Regulatory Landscape
- 4.6 Technological Outlook
- 4.7 Porter's Five Force Analysis
- 4.7.1 Bargaining Power of Suppliers
- 4.7.2 Bargaining Power of Buyers
- 4.7.3 Threat of New Entrants
- 4.7.4 Threat of Substitutes
- 4.7.5 Intensity of Rivalry
- 4.8 Assessment of Macroeconomic Factors
5 MARKET SIZE AND GROWTH FORECASTS (VALUE)
- 5.1 By Offering
- 5.1.1 Hardware
- 5.1.2 Software
- 5.1.3 Services
- 5.2 By Device Form Factor
- 5.2.1 Tethered HMD
- 5.2.2 Stand-alone HMD
- 5.2.3 Screenless Viewer
- 5.2.4 CAVE / Immersive Rooms
- 5.3 By Immersion Level
- 5.3.1 Non-Immersive
- 5.3.2 Semi-Immersive
- 5.3.3 Fully-Immersive
- 5.4 By End-User Industry
- 5.4.1 Gaming
- 5.4.2 Media and Entertainment
- 5.4.3 Healthcare
- 5.4.4 Education and Training
- 5.4.5 Military and Defense
- 5.4.6 Retail and eCommerce
- 5.4.7 Real Estate and Architecture
- 5.5 By Geography
- 5.5.1 North America
- 5.5.1.1 United States
- 5.5.1.2 Canada
- 5.5.1.3 Mexico
- 5.5.2 South America
- 5.5.2.1 Brazil
- 5.5.2.2 Argentina
- 5.5.2.3 Rest of South America
- 5.5.3 Europe
- 5.5.3.1 Germany
- 5.5.3.2 United Kingdom
- 5.5.3.3 France
- 5.5.3.4 Italy
- 5.5.3.5 Spain
- 5.5.3.6 Rest of Europe
- 5.5.4 Asia-Pacific
- 5.5.4.1 China
- 5.5.4.2 Japan
- 5.5.4.3 India
- 5.5.4.4 South Korea
- 5.5.4.5 Australia
- 5.5.4.6 Rest of Asia-Pacific
- 5.5.5 Middle East and Africa
- 5.5.5.1 Middle East
- 5.5.5.1.1 Saudi Arabia
- 5.5.5.1.2 United Arab Emirates
- 5.5.5.1.3 Turkey
- 5.5.5.1.4 Rest of Middle East
- 5.5.5.2 Africa
- 5.5.5.2.1 South Africa
- 5.5.5.2.2 Nigeria
- 5.5.5.2.3 Egypt
- 5.5.5.2.4 Rest of Africa
- 5.5.1 North America
6 COMPETITIVE LANDSCAPE
- 6.1 Market Concentration
- 6.2 Strategic Moves
- 6.3 Market Share Analysis
- 6.4 Company Profiles (includes Global level Overview, Market level overview, Core Segments, Financials as available, Strategic Information, Market Rank/Share, Products and Services, Recent Developments)
- 6.4.1 Meta Platforms (Meta Quest)
- 6.4.2 Sony Corporation
- 6.4.3 HTC Corporation
- 6.4.4 Samsung Electronics Co. Ltd
- 6.4.5 Apple Inc.
- 6.4.6 Qualcomm Technologies Inc.
- 6.4.7 Lenovo Group Ltd
- 6.4.8 Pico Interactive Inc.
- 6.4.9 Valve Corporation
- 6.4.10 Varjo Technologies Oy
- 6.4.11 Microsoft Corporation
- 6.4.12 Magic Leap Inc.
- 6.4.13 Vuzix Corporation
- 6.4.14 FOVE Inc.
- 6.4.15 DPVR (Lexiang Tech Co. Ltd)
- 6.4.16 Unity Technologies Inc.
- 6.4.17 Unreal Engine (Epic Games Inc.)
- 6.4.18 Autodesk Inc.
- 6.4.19 Dassault Systemes SE
- 6.4.20 3D Systems Corporation
7 MARKET OPPORTUNITIES AND FUTURE OUTLOOK
- 7.1 White-space and Unmet-Need Assessment
 觸覺虛擬實境市場-2026-2032年全球市場預測虛擬實境市場:依技術、組件、設備和最終用戶分類-2026-2032年全球市場預測
 虛擬實境療法市場規模、佔有率及成長分析(慢性疼痛):依療法、疼痛適應症、給藥平台、最終用戶、患者年齡層及地區分類-2026-2033年產業預測
 2026年全球會議與遠距臨場系統市場報告
 元宇宙驅動的教育市場預測至2034年:按組件、部署模式、技術、組織規模、應用、最終用戶和地區分類的全球分析
 零售業虛擬實境(VR)市場規模、佔有率和成長分析:按組件、應用、零售業態和地區分類-2026-2033年產業預測2026年全球遠距臨場系統視訊會議市場報告虛擬實境療法市場預測至2034年-全球分析(按組成部分、療法類型、技術、應用、最終用戶和地區分類)
 虛擬實境(VR)硬體:市場數據概覽(2026年第二季)
 虛擬實境市場規模、佔有率、趨勢和預測:按設備類型、技術、組件、應用和地區分類,2026-2034年