


 |
市場調查報告書
商品編碼
1846265
工業顯示器:市場佔有率分析、行業趨勢、統計數據和成長預測(2025-2030 年)Industrial Display - Market Share Analysis, Industry Trends & Statistics, Growth Forecasts (2025 - 2030) |
||||||
※ 本網頁內容可能與最新版本有所差異。詳細情況請與我們聯繫。
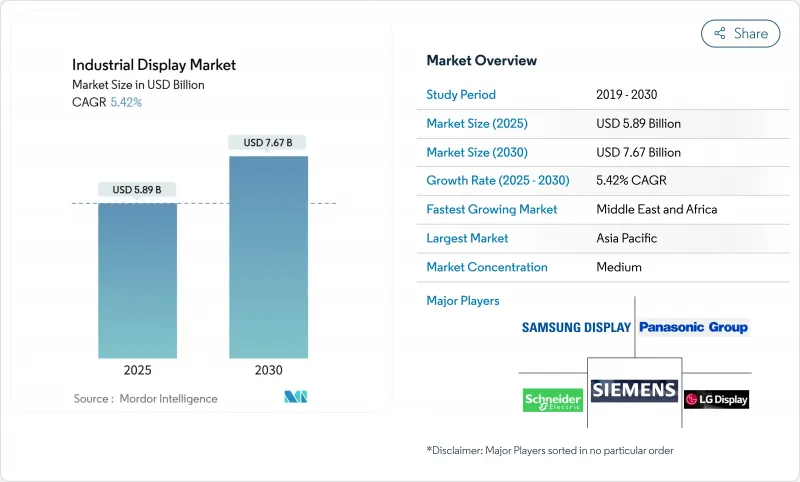
預計到 2025 年,工業顯示器市場規模將達到 58.9 億美元,到 2030 年將達到 76.7 億美元,預測期內複合年成長率為 5.42%。
營運商正從基礎讀數轉向連接工廠車間資產、邊緣閘道器和雲端分析平台的多層視覺化中心。雖然人機介面 (HMI)主機仍佔據採購主導地位,但隨著能源公司集中監控分散式基礎設施,遠端資產和管道視覺化正經歷最快的成長。儘管 LCD 面板保持著成本領先優勢,但 OLED 和 AMOLED 模組正經歷著快速成長,因為控制室需要低功耗和高對比度以實現 24 小時運作。半導體短缺導致 LCD 控制器前置作業時間延長,促使整合商拓展其技術藍圖並進行策略性組件儲備。從區域來看,亞太地區正在利用組件製造的規模經濟,而中東和非洲則正在加速對大型油氣計劃防爆視覺化技術的資本投資。
全球工業顯示器市場趨勢與洞察
工業IoT在離散型和流程型工廠的應用日益廣泛
邊緣運算人機介面 (HMI) 現在可以處理來自以乙太網路為基礎的毫秒延遲數據,從而實現預測性維護儀表板,最大限度地減少計劃外停機。羅克韋爾自動化公司將工業物聯網 (IIoT) 架構視為 2025 年的主要數位化路徑,並指出控制器和視覺化終端之間的緊密耦合至關重要。 HMS Networks 指出,到 2024 年,工業乙太網將佔新節點安裝量的 71%,這將推動對支援 PROFINET、EtherNet/IP 和 EtherCAT 協定堆疊的顯示器的需求。
危險化學品設施對多功能人機介面的需求激增
ISA-TR101.02-2019 技術報告現已將影響所有採購簡報的可用性和效能基準正式納入規範。 VarTech Systems 等供應商提供通過 C1D1 和 C1D2 認證的面板,這些面板支援多點觸控、語音控制,亮度超過 1000 尼特,兼顧安全性和功能性。這些規範有助於確保化學和製藥應用中批次間的一致性,因為在這些應用中,操作員的介入必須在微秒級以內。
安裝和維護成本高昂
防爆外殼、三防膠和專用安裝套件都會增加系統的初始成本。 Comark 公司估計,符合 IECEx 標準可能會使海上平台的資本預算翻倍,同時使工程進度延長數季。
細分市場分析
2024年,防護等級為IP65-67的堅固型外殼將佔據工業顯示器市場31.5%的佔有率,這反映了其在鑽井、採礦和軍事平台等關鍵應用領域的廣泛應用。受石化聯合企業集中控制室投資的推動,電視牆預計將以5.9%的年成長率成長。高亮度開放式框架模組正被整合到自助服務終端機殼中,而面板安裝單元仍然是機器級人機介面(HMI)的首選產品。工業顯示器市場持續湧現兼具防破壞結構和模組化I/O的產品,以實現快速更換和最大限度減少停機時間。船用級產品符合MIL-STD-167振動閾值和鹽霧通訊協定,將工業顯示器市場拓展至海軍船艦和海上鑽機。用於電廠多參數儀錶板的條狀和拉伸螢幕屬於小眾產品,因此銷量較低但平均售價較高。
二級供應商正將堅固耐用性與窄邊框設計結合,打造適用於現場控制面板和指揮中心的跨界產品。巴可公司為企業影院提供的4000塊雷射螢幕合約凸顯了其製造規模化能力,最終將推動工業電視牆的發展。混合型外殼整合了冗餘電源和邊緣閘道器,符合IEC 60079-2025安全標準,同時拓展了可維護工業顯示器的市場。
2024年,人機介面(HMI)工作站將佔總收入的46.8%,但隨著管道和墊片遙測資料遷移到集中式網路營運中心(NOC),遠端資產視覺化(複合年成長率6.4%)將超越HMI。隨著衛星和低功耗廣域網路(LPWAN)連接在沙漠和海上地區的普及,用於遠端監控的工業顯示器市場規模預計將穩定成長。精實工廠中的安燈板和維護人員使用的互動式服務站增強了以人性化的可視化工作流程,縮短了故障維修週期。控制室電視牆代表了高階產品,採用無邊框液晶顯示器和新興的微型LED陣列,營造出身臨其境型的情境察覺環境。與人工智慧主導的分析平台整合,鼓勵操作員根據螢幕上直接顯示的指導性提示採取行動,從而減少操作員疲勞和出錯的可能性。
OnePetro公司在現場試驗中展示的分散式太陽能顯示器證明了其在無電網覆蓋地區的可行性,從而擴大了偏遠礦區工業顯示器市場的安裝基礎。隨著網路安全日益受到重視,顯示器擴大與硬體信任根模組配合使用,以保護螢幕上的資料流。
區域分析
亞太地區預計到2024年將佔全球銷售額的37%,主要得益於中國大力推動工廠自動化以及日本在精密零件領域的領先地位。三星顯示器和LG顯示器均擁有世界一流的OLED工廠,鞏固了其在亞太地區工業顯示器市場的供應優勢。零件方面:各國政府正透過提供資本投資稅額扣抵抵免來支持面板工廠的擴張,從而確保即使在半導體短缺時期也能保證面板供應穩定。
到2030年,中東和非洲將以6.3%的複合年成長率成為成長最快的地區。沿岸地區數十億美元的油氣計劃依賴於符合IEC 60079-2025認證的本質安全型顯示螢幕,這擴大了防爆硬體的工業顯示器市場規模。各國國家石油公司將中央國家石油公司(NOC)與區域微控制室結合,需要能夠在沙漠高溫下保持高亮度的同步電視牆。
在北美,一股維修正席捲著那些尋求提升能源效率和網路安全的古老工廠。工廠紛紛採用基於IP技術的玻璃面板,取代傳統的CRT和電阻式觸控面板,這推動了工業顯示器市場的發展。在歐洲,以符合EN ISO 9241-210可用性指南的人體工學人機介面(HMI)佈局為重點的工業4.0藍圖正在推進,旨在提升操作人員的社會福利。南美洲的採礦和水力發電產業正在進口能夠承受高海拔和高濕度環境的堅固耐用面板,進一步拓展了其收益的地理範圍。
其他福利:
- Excel格式的市場預測(ME)表
- 3個月的分析師支持
目錄
第1章 引言
- 研究假設和市場定義
- 調查範圍
第2章調查方法
第3章執行摘要
第4章 市場情勢
- 市場概覽
- 市場促進因素
- 工業IoT在離散型和流程型工廠的應用日益廣泛
- 危險化學品設施對多功能人機介面的需求激增
- 在整個汽車生產線部署精益生產數位電子看板(安燈)
- 北美老舊工廠迎來電氣化和自動化改裝浪潮
- 適用於油田作業的戶外等級陽光下可視微型OLED/微型LED面板
- IECEx-2022 強制要求海上顯示硬體本質安全
- 市場限制
- 高成本
- 預計2023-2024年由於晶片短缺,LCD控制器前置作業時間將延長。
- 傳統PLC介面的碎片化限制了顯示器的互通性。
- 全天候控制室運作會加速控制面板老化,進而增加整體擁有成本。
- 生態系分析
- 監理與技術展望
- 波特五力分析
- 新進入者的威脅
- 買方的議價能力
- 供應商的議價能力
- 替代品的威脅
- 競爭對手之間的競爭強度
第5章 市場規模與成長預測(金額)
- 按類型
- 加固型顯示器
- 開放式框架顯示器
- 面板安裝顯示器
- 船艦和海軍展覽
- 工業電視牆
- 條形/拉伸顯示器
- 透過使用
- 人機介面(HMI)
- 遠端資產和管道監測
- 互動式服務站和操作員終端
- 工廠數位電子看板和內部電路板
- 控制室電視牆
- 依技術
- LCD
- LED背光液晶顯示器
- OLED/AMOLED
- 電子紙和反射式顯示器
- 微型LED
- 按面板尺寸
- 小於14英寸
- 14英寸至21英寸
- 21英寸至40英寸
- 40吋或以上
- 按行業
- 製造業
- 能源和電力
- 石油和天然氣
- 採礦和金屬
- 化學和製藥
- 運輸/物流
- 其他(用水和污水、國防)
- 按地區
- 北美洲
- 美國
- 加拿大
- 墨西哥
- 歐洲
- 德國
- 英國
- 法國
- 北歐的
- 其他歐洲國家
- 南美洲
- 巴西
- 其他南美
- 亞太地區
- 中國
- 日本
- 印度
- 東南亞
- 其他亞太地區
- 中東和非洲
- 中東
- 波灣合作理事會成員國
- 土耳其
- 其他中東地區
- 非洲
- 南非
- 其他非洲國家
- 北美洲
第6章 競爭情勢
- 市場集中度
- 策略性舉措(併購、合資、合約)
- 市佔率分析
- 公司簡介
- Samsung Display Co., Ltd.
- LG Display Co., Ltd.
- Panasonic Holdings Corp.
- Sharp Corp.
- Emerson Electric Co.
- Schneider Electric SE
- Siemens AG
- Rockwell Automation Inc.
- NEC Display Solutions, Ltd.
- Advantech Co., Ltd.
- Barco NV
- WinMate Inc.
- Planar Systems, Inc.
- AU Optronics Corp.
- Bosch Rexroth AG
- Mitsubishi Electric Corp.
- Honeywell International Inc.
- Kontron AG
- iBASE Technology Inc.
- Beijer Electronics Group AB
- Delta Electronics, Inc.
第7章 市場機會與未來展望
The industrial display market size stands at USD 5.89 billion in 2025 and is projected to reach USD 7.67 billion by 2030, reflecting a 5.42% CAGR over the forecast period.
Operators are moving from basic read-outs to multi-layered visualization hubs that connect plant-floor assets, edge gateways and cloud analytics platforms. Human-machine interface (HMI) consoles continue to dominate procurement, yet remote asset and pipeline visualization is scaling the fastest as energy firms centralize oversight of dispersed infrastructure. LCD panels preserve cost leadership, while OLED and AMOLED modules post the quickest growth as control rooms demand lower power draw and superior contrast for round-the-clock duty. Semiconductor shortages lengthen LCD controller lead times, pushing integrators to diversify technology roadmaps and pursue strategic component reserves. Regionally, Asia-Pacific leverages economies of scale in component fabrication, whereas the Middle East and Africa accelerates capital expenditure on explosion-proof visualization for oil and gas megaprojects.
Global Industrial Display Market Trends and Insights
Increasing Adoption of Industrial IoT in Discrete and Process Plants
Edge-ready HMIs now process millisecond latency data from Ethernet-based networks, enabling predictive maintenance dashboards that minimize unplanned shutdowns. Rockwell Automation identifies IIoT architecture as the principal digitization pathway for 2025, citing tighter coupling between controllers and visualization endpoints. HMS Networks confirms momentum, noting that Industrial Ethernet supplied 71% of new node installations in 2024, catalyzing demand for displays that support PROFINET, EtherNet/IP and EtherCAT stacks.
Demand Surge for Multi-featured HMI in Hazardous Chemical Facilities
The ISA-TR101.02-2019 technical report codifies usability and performance benchmarks that now influence every procurement brief. Suppliers such as VarTech Systems deliver C1D1 and C1D2 certified panels offering multi-touch, voice control and >1,000 nit brightness, aligning safety with functionality. These specifications support batch-to-batch integrity in chemicals and pharmaceuticals where micro-seconds matter for operator intervention.
High Cost of Implementation and Maintenance
Explosion-proof enclosures, conformal coatings, and specialized mounting kits elevate upfront system outlays. Comark Corporation projects that IECEx compliance can double equipment budgets for offshore platforms while extending engineering schedules by several quarters.
Other drivers and restraints analyzed in the detailed report include:
- Lean-Manufacturing Digital Signage (Andon) Roll-outs Across Automotive Lines
- Retrofit Wave of Aging North-American Factories for Electrification and Automation
- Prolonged LCD Controller Lead-Times Amid Chip Shortage
For complete list of drivers and restraints, kindly check the Table Of Contents.
Segment Analysis
Rugged housings rated to IP65-67 secured a 31.5% slice of the industrial display market in 2024, reflecting critical-duty requirements in drilling, mining and military platforms. Video walls are projected to compound at 5.9% annually, fueled by centralized control-room investment across petrochemical complexes. High-brightness open-frame modules integrate into kiosk enclosures, while panel-mount units remain the workhorse for machine-level HMIs. The industrial display market repeatedly favors vendors that combine shock resistance with modular I/O, ensuring rapid swap-out and minimal downtime. Marine-grade variants meet MIL-STD-167 vibration thresholds and salt-spray protocols, extending the industrial display market footprint to naval vessels and offshore rigs. Bar-type and stretch screens address multi-parameter dashboards in power plants, a niche translating to higher ASPs despite lower volumes.
Second-tier suppliers are blending ruggedization with narrow-bezel architectures, creating cross-over products that serve both field panels and command centers. Barco's enterprise cinema contract for 4,000 laser screens underscores manufacturing scalability that later translates into industrial video walls. Hybrid enclosures now embed redundant power supplies and edge gateways, aligning with IEC 60079-2025 safety clauses while enlarging the serviceable industrial display market.
HMI stations delivered 46.8% of 2024 revenue, but remote asset visualization will outpace at a 6.4% CAGR as pipeline and well-pad telemetry shifts to centralized NOCs. The industrial display market size for remote monitoring is forecast to expand steadily as satellite and LPWAN connectivity proliferate in deserts and offshore locations. Andon boards in lean plants and interactive kiosks for maintenance crews reinforce human-centric visual workflows that shorten fault-to-fix cycles. Control-room video walls constitute the premium class where bezel-less LCD or emerging Micro-LED arrays craft immersive situational awareness environments. Integration with AI-driven analytics platforms means operators now act on prescriptive prompts rendered directly on the screen, reducing operator fatigue and error incidence.
Distributed solar-powered screens demonstrated by OnePetro field trials prove viability in regions lacking grid access, widening the install base of the industrial display market in remote extraction zones. As cybersecurity rises in priority, displays are increasingly paired with hardware-root-of-trust modules to secure on-screen data flows, a requirement accentuated in cross-border pipeline operations.
The Industrial Display Market Report is Segmented by Type (Rugged Displays, Open Frame Monitors, and More), Application (Human-Machine Interface, Remote Asset and Pipeline Monitoring, and More), Technology (LCD, LED Backlit LCD, and More), Panel Size (Up To 14 Inch, 14 Inch - 21 Inch, and More), End-Use Industry (Manufacturing, Energy and Power, and More), and Geography. The Market Forecasts are Provided in Terms of Value (USD).
Geography Analysis
Asia-Pacific commanded 37% revenue in 2024, underpinned by China's factory automation drive and Japan's leadership in precision components. Samsung Display and LG Display operate global-scale OLED fabs, cementing the region's supply advantage across the industrial display market. Component governments back capex tax credits that accelerate panel plant expansions, ensuring steady panel availability even during semiconductor shortages.
The Middle East and Africa is poised for the fastest 6.3% CAGR to 2030. Multi-billion-dollar hydrocarbon projects across the Gulf rely on intrinsically safe screens certified under IEC 60079-2025, enlarging the industrial display market size for explosion-proof hardware. National oil companies pair centralized NOCs with regional micro-control rooms, demanding synchronized video walls that sustain high brightness amid desert temperatures.
North America witnesses a retrofit wave across mid-century factories seeking energy efficiencies and cybersecurity hardening. Proactive replacement of CRTs and resistive-touch panels with IP-based glass surfaces boosts the industrial display market as factories embrace digital performance boards. Europe advances Industry 4.0 blueprints with a focus on ergonomic HMI layouts compliant with EN ISO 9241-210 usability guidance, promoting operator well-being. South America's mining and hydroelectric sectors import hardy panels rated for high altitude and humidity, further diversifying geographic revenue.
- Samsung Display Co., Ltd.
- LG Display Co., Ltd.
- Panasonic Holdings Corp.
- Sharp Corp.
- Emerson Electric Co.
- Schneider Electric SE
- Siemens AG
- Rockwell Automation Inc.
- NEC Display Solutions, Ltd.
- Advantech Co., Ltd.
- Barco NV
- WinMate Inc.
- Planar Systems, Inc.
- AU Optronics Corp.
- Bosch Rexroth AG
- Mitsubishi Electric Corp.
- Honeywell International Inc.
- Kontron AG
- iBASE Technology Inc.
- Beijer Electronics Group AB
- Delta Electronics, Inc.
Additional Benefits:
- The market estimate (ME) sheet in Excel format
- 3 months of analyst support
TABLE OF CONTENTS
1 INTRODUCTION
- 1.1 Study Assumptions and Market Definition
- 1.2 Scope of the Study
2 RESEARCH METHODOLOGY
3 EXECUTIVE SUMMARY
4 MARKET LANDSCAPE
- 4.1 Market Overview
- 4.2 Market Drivers
- 4.2.1 Increasing Adoption of Industrial IoT in Discrete and Process Plants
- 4.2.2 Demand Surge for Multi-featured HMI in Hazardous Chemical Facilities
- 4.2.3 Lean-Manufacturing Digital Signage (Andon) Roll-outs Across Automotive Lines
- 4.2.4 Retrofit Wave of Aging North-American Factories for Electrification and Automation
- 4.2.5 Outdoor-Grade Sunlight-Readable Micro-OLED/Micro-LED Panels for Oilfield Operations
- 4.2.6 IECEx-2022 Mandate for Intrinsically Safe Offshore Display Hardware
- 4.3 Market Restraints
- 4.3.1 High Cost of Implementation and Maintenance
- 4.3.2 Prolonged LCD Controller Lead-Times Amid 2023-24 Chip Shortage
- 4.3.3 Legacy PLC Interface Fragmentation Limiting Display Interoperability
- 4.3.4 Accelerated Panel Burn-in in 24/7 Control-Room Duty Raising TCO
- 4.4 Indusrty Ecosystem Analysis
- 4.5 Regulatory and Technological Outlook
- 4.6 Porter's Five Forces Analysis
- 4.6.1 Threat of New Entrants
- 4.6.2 Bargaining Power of Buyers
- 4.6.3 Bargaining Power of Suppliers
- 4.6.4 Threat of Substitutes
- 4.6.5 Intensity of Competitive Rivalry
5 MARKET SIZE AND GROWTH FORECASTS (VALUES)
- 5.1 By Type
- 5.1.1 Rugged Displays
- 5.1.2 Open Frame Monitors
- 5.1.3 Panel-Mount Monitors
- 5.1.4 Marine and Naval-Grade Displays
- 5.1.5 Industrial Video Walls
- 5.1.6 Bar-Type/Stretch Displays
- 5.2 By Application
- 5.2.1 Human-Machine Interface (HMI)
- 5.2.2 Remote Asset and Pipeline Monitoring
- 5.2.3 Interactive Kiosks and Operator Terminals
- 5.2.4 In-plant Digital Signage and Andon Boards
- 5.2.5 Control-Room Video Walls
- 5.3 By Technology
- 5.3.1 LCD
- 5.3.2 LED Backlit LCD
- 5.3.3 OLED/AMOLED
- 5.3.4 E-Paper and Reflective Displays
- 5.3.5 Micro-LED
- 5.4 By Panel Size
- 5.4.1 Up to 14 inch
- 5.4.2 14 inch - 21 inch
- 5.4.3 21 inch - 40 inch
- 5.4.4 40 inch and Above
- 5.5 By End-Use Industry
- 5.5.1 Manufacturing
- 5.5.2 Energy and Power
- 5.5.3 Oil and Gas
- 5.5.4 Mining and Metals
- 5.5.5 Chemical and Pharmaceutical
- 5.5.6 Transportation and Logistics
- 5.5.7 Others (Water and Wastewater, Defense)
- 5.6 By Geography
- 5.6.1 North America
- 5.6.1.1 United States
- 5.6.1.2 Canada
- 5.6.1.3 Mexico
- 5.6.2 Europe
- 5.6.2.1 Germany
- 5.6.2.2 United Kingdom
- 5.6.2.3 France
- 5.6.2.4 Nordics
- 5.6.2.5 Rest of Europe
- 5.6.3 South America
- 5.6.3.1 Brazil
- 5.6.3.2 Rest of South America
- 5.6.4 Asia-Pacific
- 5.6.4.1 China
- 5.6.4.2 Japan
- 5.6.4.3 India
- 5.6.4.4 South-East Asia
- 5.6.4.5 Rest of Asia-Pacific
- 5.6.5 Middle East and Africa
- 5.6.5.1 Middle East
- 5.6.5.1.1 Gulf Cooperation Council Countries
- 5.6.5.1.2 Turkey
- 5.6.5.1.3 Rest of Middle East
- 5.6.5.2 Africa
- 5.6.5.2.1 South Africa
- 5.6.5.2.2 Rest of Africa
- 5.6.1 North America
6 COMPETITIVE LANDSCAPE
- 6.1 Market Concentration
- 6.2 Strategic Moves (M&A, JV, Agreements)
- 6.3 Market Share Analysis
- 6.4 Company Profiles (includes Global level Overview, Market level overview, Core Segments, Financials as available, Strategic Information, Market Rank/Share for key companies, Products and Services, and Recent Developments)
- 6.4.1 Samsung Display Co., Ltd.
- 6.4.2 LG Display Co., Ltd.
- 6.4.3 Panasonic Holdings Corp.
- 6.4.4 Sharp Corp.
- 6.4.5 Emerson Electric Co.
- 6.4.6 Schneider Electric SE
- 6.4.7 Siemens AG
- 6.4.8 Rockwell Automation Inc.
- 6.4.9 NEC Display Solutions, Ltd.
- 6.4.10 Advantech Co., Ltd.
- 6.4.11 Barco NV
- 6.4.12 WinMate Inc.
- 6.4.13 Planar Systems, Inc.
- 6.4.14 AU Optronics Corp.
- 6.4.15 Bosch Rexroth AG
- 6.4.16 Mitsubishi Electric Corp.
- 6.4.17 Honeywell International Inc.
- 6.4.18 Kontron AG
- 6.4.19 iBASE Technology Inc.
- 6.4.20 Beijer Electronics Group AB
- 6.4.21 Delta Electronics, Inc.
7 MARKET OPPORTUNITIES AND FUTURE OUTLOOK
- 7.1 White-space and Unmet-Need Assessment
 商用顯示器市場:2026-2032年全球市場預測(依顯示技術、面板尺寸、解析度、亮度等級、安裝方式及最終使用者分類)工業IoT顯示器市場:2026年至2032年全球市場預測,依產業、應用、顯示器類型、連接方式、部署模式、觸控功能、解析度和螢幕大小工業顯示器市場:按面板類型、顯示器尺寸、觸控技術、解析度和終端用戶產業分類-2026-2032年全球市場預測商業顯示器市場:2026-2032年全球市場預測,依產品、技術、類型、顯示器尺寸、安裝方式、應用、最終用戶及通路分類
 工業IoT顯示器市場規模、佔有率和成長分析:按應用、連接方式、顯示器類型、面板尺寸和地區分類-2026-2033年產業預測
 工業IoT顯示器市場分析及預測(至2035年):依類型、產品類型、服務、技術、組件、應用、形狀、材質、設備及部署方式分類
 商業顯示器市場規模、佔有率、成長及全球產業分析:按類型、應用和地區分類-2026-2034 年洞察與預測
 2026年全球加固型工業顯示器市場報告2026年全球商用顯示器市場報告2026年全球工業顯示器市場報告