

 |
市場調查報告書
商品編碼
1833384
商業顯示市場機會、成長動力、產業趨勢分析及2025-2034年預測Commercial Display Market Opportunity, Growth Drivers, Industry Trend Analysis, and Forecast 2025 - 2034 |
||||||
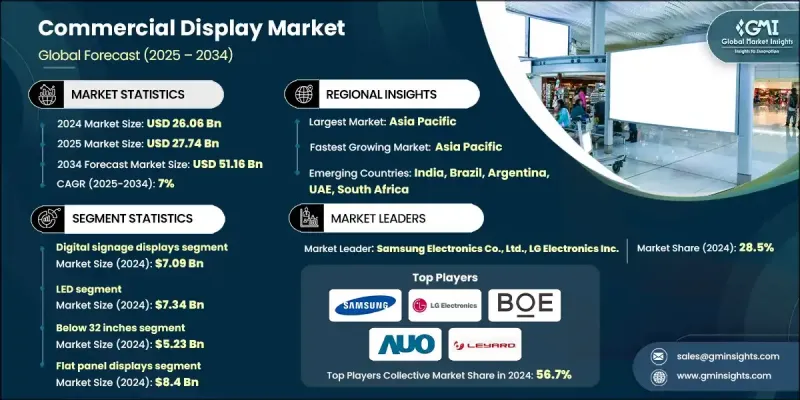
2024 年全球商業顯示市場價值為 260.6 億美元,預計將以 7% 的複合年成長率成長,到 2034 年達到 511.6 億美元。
這一成長軌跡得益於商用顯示器在數位基礎設施中日益重要的作用,尤其是在教育和醫療保健等領域,互動式智慧顯示解決方案正在改變人們的參與和溝通方式。隨著各機構對其營運和公共服務框架進行現代化改造,對動態即時內容交付系統的需求變得至關重要。如今,智慧顯示器不僅在零售和廣告領域被視為關鍵工具,在面向大眾的服務領域也日益受到重視。這正推動著智慧顯示器在更廣泛的垂直領域的應用。此外,在企業大廳、園區和交通樞紐等面向客戶的環境中,人們越來越傾向於沉浸式和個人化體驗,這正在重新定義顯示技術的範圍,並推動市場持續成長。
| 市場範圍 | |
|---|---|
| 起始年份 | 2024 |
| 預測年份 | 2025-2034 |
| 起始值 | 260.6億美元 |
| 預測值 | 511.6億美元 |
| 複合年成長率 | 7% |
2024年,數位看板顯示器市場規模達到70.9億美元,成為商用顯示器產業最突出的產品類別。由於交通運輸、零售和企業通訊等產業對適應性內容交付平台的需求旺盛,該領域持續蓬勃發展。隨著城市基礎設施不斷發展以支持更智慧的環境,對大型標牌和資訊系統的投資迅速成長。這些顯示器使企業和機構能夠輕鬆地提供基於位置的內容、事件通知和互動式訊息。
2024年,LED顯示器市場規模達73.4億美元。其廣受歡迎源自於其高能源效率、耐用性以及在室內外環境中的多功能性。 LED顯示器憑藉其在視訊牆、標牌系統和高解析度廣告方面的可擴展性,繼續佔據市場主導地位。從交通樞紐到市中心和零售店面,LED顯示器正成為企業在高人流量和環境光環境下吸引眼球的首選解決方案。其適應性強、使用壽命長,使其在連續使用環境中特別引人注目。
2024年,美國商用顯示器市場規模達55.7億美元,預計到2034年複合年成長率將達7.5%。由於快餐店、零售連鎖店、公共交通和娛樂場所等行業的廣泛應用,美國在商用顯示器的應用方面繼續保持領先地位。圍繞無障礙設施和公共資訊標準的監管指導日益增多,進一步加速了其在教育機構、機場和政府大樓的部署。這些發展推動了對支援即時通訊、安全更新和互動式導航的先進顯示系統的需求,這些系統既要具備功能性,又要符合現代數位基礎設施的要求。
影響全球商用顯示器市場的主要公司包括松下公司、索尼公司、海信視覺科技股份有限公司、明基電通股份有限公司、達科電子株式會社、三星電子株式會社、佳世達株式會社、夏普株式會社、日本電氣株式會社、E Ink Holdings Inc.、巴可公司、美國科視數位系統公司、LG電子公司、台達電子株式會社、優派株式會社、利亞德光電股份有限公司、友達光電株式會社、三菱電機株式會社、平達系統株式會社、京東方科技Group Limited、Elo Touch Solutions, Inc.、深圳市有限公司。
商業顯示器產業的領導者正在大力投資下一代技術,例如微型LED、OLED和互動式觸控螢幕,以滿足不斷變化的客戶需求。許多企業專注於擴展其產品組合,以涵蓋針對智慧零售、公共基礎設施和企業環境的節能、模組化和超高清顯示系統。與科技公司和政府機構的策略合作也十分常見,使企業能夠參與國家數位轉型計畫。
目錄
第1章:方法論與範圍
第 2 章:執行摘要
第3章:行業洞察
- 產業生態系統分析
- 供應商概況
- 利潤率
- 成本結構
- 每個階段的增值
- 影響價值鏈的因素
- 中斷
- 產業衝擊力
- 成長動力
- 零售、旅館和交通運輸業對數位看板的需求不斷成長
- 採用高解析度顯示器(4K/8K)和先進技術(OLED、microLED)
- 人工智慧與基於雲端的內容管理的整合
- 智慧城市基礎設施和公共服務自動化的成長
- 互動式顯示器在教育和醫療保健領域的應用日益增多
- 產業陷阱與挑戰
- 供應鏈中斷和生產成本高昂
- 缺乏熟練的安裝和維護專業人員
- 市場機會
- 智慧城市與交通樞紐的擴張
- 與建築管理和 POS 系統整合
- 基於 SaaS 的內容平台的成長
- 醫療保健和汽車產業的應用
- 成長動力
- 成長潛力分析
- 監管格局
- 北美洲
- 歐洲
- 亞太地區
- 拉丁美洲
- 中東和非洲
- 波特的分析
- PESTEL分析
- 技術和創新格局
- 當前的技術趨勢
- 新興技術
- 價格趨勢
- 按地區
- 按產品
- 定價策略
- 新興商業模式
- 合規性要求
- 永續性措施
- 消費者情緒分析
- 專利和智慧財產權分析
- 地緣政治與貿易動態
第4章:競爭格局
- 公司簡介 市佔率分析
- 公司市佔率分析
- 按地區
- 北美洲
- 歐洲
- 亞太地區
- 市場集中度分析
- 關鍵參與者的競爭基準化分析
- 財務績效比較
- 收入
- 利潤率
- 研發
- 產品組合比較
- 產品範圍廣度
- 科技
- 創新
- 地理分佈比較
- 全球足跡分析
- 服務網路覆蓋
- 各地區市場滲透率
- 競爭定位矩陣
- 領導者
- 挑戰者
- 追蹤者
- 利基市場參與者
- 戰略展望矩陣
- 財務績效比較
- 2021-2024 年關鍵發展
- 併購
- 夥伴關係與合作
- 技術進步
- 擴張和投資策略
- 永續發展計劃
- 數位轉型計劃
- 新興/新創企業競爭對手格局
第5章:市場估計與預測:依產品類型,2021 - 2034 年
- 主要趨勢
- 數位看板顯示器
- 互動式白板
- 視訊牆
- 自助服務終端
- 其他
第6章:市場估計與預測:按技術,2021 - 2034 年
- 主要趨勢
- 引領
- 液晶顯示器
- OLED
- 其他
第7章:市場估計與預測:按顯示器尺寸,2021 - 2034
- 主要趨勢
- 低於 32 英寸
- 32-52英寸
- 52吋以上
第8章:市場估計與預測:按面板類型,2021-2034
- 主要趨勢
- 平面顯示器(FPD)
- 曲面面板顯示器
- 軟性/透明顯示器
第9章:市場估計與預測:依最終用途,2021-2034
- 主要趨勢
- 飯店業
- 零售
- 運輸
- 衛生保健
- 銀行和金融服務
- 其他
第 10 章:市場估計與預測:按地區,2021 年至 2034 年
- 主要趨勢
- 北美洲
- 美國
- 加拿大
- 歐洲
- 德國
- 英國
- 法國
- 義大利
- 西班牙
- 荷蘭
- 亞太地區
- 中國
- 印度
- 日本
- 韓國
- 澳洲
- 拉丁美洲
- 巴西
- 墨西哥
- 阿根廷
- 中東和非洲
- 阿拉伯聯合大公國
- 沙烏地阿拉伯
- 南非
第 11 章:公司簡介
- 全球參與者:
- AU Optronics Corp.
- BenQ Corporation
- BOE Technology Group Co., Ltd.
- Leyard Optoelectronic Co., Ltd.
- LG Electronics Inc.
- Mitsubishi Electric Corporation
- NEC Corporation
- Panasonic Corporation
- Samsung Electronics Co., Ltd.
- Sharp Corporation
- Sony Corporation
- 區域參與者:
- Barco NV
- Christie Digital Systems USA, Inc.
- Daktronics, Inc.
- Delta Electronics, Inc.
- Innolux Corporation
- Planar Systems, Inc.
- ViewSonic Corporation
- 新興參與者:
- E Ink Holdings Inc.
- Elo Touch Solutions, Inc.
- Hisense Visual Technology Co., Ltd.
- Qisda Corporation
- Shenzhen Absen Optoelectronic Co., Ltd.
The Global Commercial Display Market was valued at USD 26.06 billion in 2024 and is estimated to grow at a CAGR of 7% to reach USD 51.16 billion by 2034.
This growth trajectory is fueled by the expanding role of commercial displays in digital infrastructure, especially within sectors like education and healthcare, where interactive and intelligent display solutions are transforming engagement and communication. As institutions modernize their operations and public service frameworks, the need for dynamic, real-time content delivery systems becomes essential. Smart displays are now seen as critical tools not just in retail and advertising, but increasingly in public-facing services. This is encouraging adoption across broader verticals. Moreover, the growing shift toward immersive and personalized experiences in customer-facing environments such as corporate lobbies, campuses, and transportation hubs is redefining the scope of display technologies and contributing to this sustained market momentum.
| Market Scope | |
|---|---|
| Start Year | 2024 |
| Forecast Year | 2025-2034 |
| Start Value | $26.06 billion |
| Forecast Value | $51.16 Billion |
| CAGR | 7% |
The digital signage displays segment generated USD 7.09 billion in 2024, making it the most prominent product category within the commercial display industry. This segment continues to thrive due to high demand for adaptable content delivery platforms across industries like transportation, retail, and enterprise communications. As urban infrastructure evolves to support more intelligent environments, investments in large-format signage and information systems have grown rapidly. These displays allow businesses and institutions to deliver location-based content, event notifications, and interactive messages with ease.
The LED displays segment generated USD 7.34 billion in 2024. Their widespread popularity stems from their high energy efficiency, durability, and performance versatility across indoor and outdoor environments. The LED segment continues to dominate because of its scalability for video walls, signage systems, and high-resolution advertising. From transportation terminals to city centers and retail storefronts, LED displays are becoming the preferred solution for businesses looking to capture attention in both high-traffic and ambient light environments. Their adaptability and long service life make them particularly appealing for continuous-use settings.
U.S. Commercial Display Market generated USD 5.57 billion in 2024, supported by a CAGR of 7.5% through 2034. The country continues to lead in adoption due to widespread integration in industries such as quick-service restaurants, retail chains, public transit, and entertainment venues. Increasing regulatory guidance around accessibility and public information standards further accelerates deployment in educational institutions, airports, and government buildings. These developments drive demand for advanced display systems that support real-time communication, safety updates, and interactive navigation, offering both functionality and compliance with modern digital infrastructure requirements.
Major companies shaping the Global Commercial Display Market include Panasonic Corporation, Sony Corporation, Hisense Visual Technology Co., Ltd., BenQ Corporation, Daktronics, Inc., Samsung Electronics Co., Ltd., Qisda Corporation, Sharp Corporation, NEC Corporation, E Ink Holdings Inc., Barco NV, Christie Digital Systems USA, Inc., LG Electronics Inc., Delta Electronics, Inc., ViewSonic Corporation, Leyard Optoelectronic Co., Ltd., AU Optronics Corp., Mitsubishi Electric Corporation, Planar Systems, Inc., BOE Technology Group Co., Ltd., Elo Touch Solutions, Inc., Shenzhen Absen Optoelectronic Co., Ltd., and Innolux Corporation.
Leading companies in the commercial display industry are investing heavily in next-generation technologies such as micro-LED, OLED, and interactive touchscreens to cater to evolving customer demands. Many focus on expanding their product portfolios to include energy-efficient, modular, and ultra-HD display systems tailored for smart retail, public infrastructure, and enterprise environments. Strategic collaborations with tech firms and government bodies are also common, enabling players to participate in national digital transformation programs.
Table of Contents
Chapter 1 Methodology and Scope
- 1.1 Market scope and definition
- 1.2 Research design
- 1.2.1 Research approach
- 1.2.2 Data collection methods
- 1.3 Data mining sources
- 1.3.1 Global
- 1.3.2 Regional/Country
- 1.4 Base estimates and calculations
- 1.4.1 Base year calculation
- 1.4.2 Key trends for market estimation
- 1.5 Primary research and validation
- 1.5.1 Primary sources
- 1.6 Forecast model
- 1.7 Research assumptions and limitations
Chapter 2 Executive Summary
- 2.1 Industry 360° synopsis
- 2.2 Key market trends
- 2.2.1 Business trends
- 2.2.2 Product type trends
- 2.2.3 Technology trends
- 2.2.4 Display Size trends
- 2.2.5 Panel Type trends
- 2.2.6 End Use trends
- 2.2.7 Regional trends
- 2.3 TAM Analysis, 2025-2034 (USD Billion)
- 2.4 CXO perspectives: Strategic imperatives
- 2.5 Executive decision points
- 2.6 Critical Success Factors
- 2.7 Future Outlook and Strategic Recommendations
Chapter 3 Industry Insights
- 3.1 Industry ecosystem analysis
- 3.1.1 Supplier Landscape
- 3.1.2 Profit Margin
- 3.1.3 Cost structure
- 3.1.4 Value addition at each stage
- 3.1.5 Factor affecting the value chain
- 3.1.6 Disruptions
- 3.2 Industry impact forces
- 3.2.1 Growth drivers
- 3.2.1.1 Escalating demand for digital signage across retail, hospitality, and transportation
- 3.2.1.2 Adoption of high-resolution displays (4K/8K) and advanced technologies (OLED, microLED)
- 3.2.1.3 Integration of AI and cloud-based content management
- 3.2.1.4 Growth in smart city infrastructure and public service automation
- 3.2.1.5 Rising use of interactive displays in education and healthcare
- 3.2.2 Industry pitfalls and challenges
- 3.2.2.1 Supply chain disruptions and high production costs
- 3.2.2.2 Shortage of skilled professionals for installation and maintenance
- 3.2.3 Market Opportunities
- 3.2.3.1 Expansion in smart cities and transportation hubs
- 3.2.3.2 Integration with building management and POS systems
- 3.2.3.3 Growth in SaaS-based content platforms
- 3.2.3.4 Adoption in healthcare and automotive sectors
- 3.2.1 Growth drivers
- 3.3 Growth potential analysis
- 3.4 Regulatory landscape
- 3.4.1 North America
- 3.4.2 Europe
- 3.4.3 Asia Pacific
- 3.4.4 Latin America
- 3.4.5 Middle East & Africa
- 3.5 Porter’s analysis
- 3.6 PESTEL analysis
- 3.7 Technological and Innovation landscape
- 3.7.1 Current technological trends
- 3.7.2 Emerging technologies
- 3.8 Price Trends
- 3.8.1 By region
- 3.8.2 By product
- 3.9 Pricing strategies
- 3.10 Emerging business models
- 3.11 Compliance requirements
- 3.12 Sustainability measures
- 3.13 Consumer sentiment analysis
- 3.14 Patent and IP analysis
- 3.15 Geopolitical and trade dynamics
Chapter 4 Competitive Landscape, 2024
- 4.1 Introduction Company market share analysis
- 4.2 Company market share analysis
- 4.2.1 By region
- 4.2.1. North America
- 4.2.2. Europe
- 4.2.3. Asia Pacific
- 4.2.2 Market concentration analysis
- 4.3 Competitive Benchmarking of key Players
- 4.3.1 Financial Performance Comparison
- 4.3.1.1. Revenue
- 4.3.1.2. Profit Margin
- 4.3.1.3. R&D
- 4.3.2 Product Portfolio Comparison
- 4.3.2.1. Product Range Breadth
- 4.3.2.2. Technology
- 4.3.2.3. Innovation
- 4.3.3 Geographic Presence Comparison
- 4.3.3.1. Global Footprint Analysis
- 4.3.3.2. Service Network Coverage
- 4.3.3.3. Market Penetration by Region
- 4.3.4 Competitive Positioning Matrix
- 4.3.4.1. Leaders
- 4.3.4.2. Challengers
- 4.3.4.3. Followers
- 4.3.4.4. Niche Players
- 4.3.5 Strategic outlook matrix
- 4.3.1 Financial Performance Comparison
- 4.4 Key developments, 2021-2024
- 4.4.1 Mergers and Acquisitions
- 4.4.2 Partnerships and Collaborations
- 4.4.3 Technological Advancements
- 4.4.4 Expansion and Investment Strategies
- 4.4.5 Sustainability Initiatives
- 4.4.6 Digital Transformation Initiatives
- 4.5 Emerging/ Startup Competitors Landscape
Chapter 5 Market Estimates & Forecast, By Product Type, 2021 - 2034 (USD Billion & Units)
- 5.1 Key trends
- 5.2 Digital signage displays
- 5.3 Interactive whiteboards
- 5.4 Video walls
- 5.5 Kiosks
- 5.6 Others
Chapter 6 Market estimates & forecast, By Technology, 2021 - 2034 (USD Billion & Units)
- 6.1 Key trends
- 6.2 LED
- 6.3 LCD
- 6.4 OLED
- 6.5 Others
Chapter 7 Market estimates & forecast, By Display Size, 2021 - 2034 (USD Billion & Units)
- 7.1 Key trends
- 7.2 Below 32 inches
- 7.3 32-52 inches
- 7.4 Above 52 inches
Chapter 8 Market Estimates and Forecast, By Panel Type, 2021-2034 ( USD Billion & Units)
- 8.1 Key trends
- 8.2 Flat panel displays (FPD)
- 8.3 Curved panel displays
- 8.4 Flexible/transparent displays
Chapter 9 Market Estimates and Forecast, By End Use, 2021-2034 ( USD Billion & Units)
- 9.1 Key trends
- 9.2 Hospitality
- 9.3 Retail
- 9.4 Transportation
- 9.5 Healthcare
- 9.6 Banking & financial services
- 9.7 Others
Chapter 10 Market Estimates and Forecast, By Region, 2021 - 2034 (USD Billion & Units)
- 10.1 Key trends
- 10.2 North America
- 10.2.1 U.S.
- 10.2.2 Canada
- 10.3 Europe
- 10.3.1 Germany
- 10.3.2 U.K.
- 10.3.3 France
- 10.3.4 Italy
- 10.3.5 Spain
- 10.3.6 Netherlands
- 10.4 Asia Pacific
- 10.4.1 China
- 10.4.2 India
- 10.4.3 Japan
- 10.4.4 South Korea
- 10.4.5 Australia
- 10.5 Latin America
- 10.5.1 Brazil
- 10.5.2 Mexico
- 10.5.3 Argentina
- 10.6 Middle East & Africa
- 10.6.1 UAE
- 10.6.2 Saudi Arabia
- 10.6.3 South Africa
Chapter 11 Company Profile
- 11.1 Global Players:
- 11.1.1 AU Optronics Corp.
- 11.1.2 BenQ Corporation
- 11.1.3 BOE Technology Group Co., Ltd.
- 11.1.4 Leyard Optoelectronic Co., Ltd.
- 11.1.5 LG Electronics Inc.
- 11.1.6 Mitsubishi Electric Corporation
- 11.1.7 NEC Corporation
- 11.1.8 Panasonic Corporation
- 11.1.9 Samsung Electronics Co., Ltd.
- 11.1.10 Sharp Corporation
- 11.1.11 Sony Corporation
- 11.2 Regional Players:
- 11.2.1 Barco NV
- 11.2.2 Christie Digital Systems USA, Inc.
- 11.2.3 Daktronics, Inc.
- 11.2.4 Delta Electronics, Inc.
- 11.2.5 Innolux Corporation
- 11.2.6 Planar Systems, Inc.
- 11.2.7 ViewSonic Corporation
- 11.3 Emerging Players:
- 11.3.1 E Ink Holdings Inc.
- 11.3.2 Elo Touch Solutions, Inc.
- 11.3.3 Hisense Visual Technology Co., Ltd.
- 11.3.4 Qisda Corporation
- 11.3.5 Shenzhen Absen Optoelectronic Co., Ltd.
 商用顯示器市場:2026-2032年全球市場預測(依顯示技術、面板尺寸、解析度、亮度等級、安裝方式及最終使用者分類)工業IoT顯示器市場:2026年至2032年全球市場預測,依產業、應用、顯示器類型、連接方式、部署模式、觸控功能、解析度和螢幕大小工業顯示器市場:按面板類型、顯示器尺寸、觸控技術、解析度和終端用戶產業分類-2026-2032年全球市場預測商業顯示器市場:2026-2032年全球市場預測,依產品、技術、類型、顯示器尺寸、安裝方式、應用、最終用戶及通路分類
 工業IoT顯示器市場規模、佔有率和成長分析:按應用、連接方式、顯示器類型、面板尺寸和地區分類-2026-2033年產業預測
 工業IoT顯示器市場分析及預測(至2035年):依類型、產品類型、服務、技術、組件、應用、形狀、材質、設備及部署方式分類
 商業顯示器市場規模、佔有率、成長及全球產業分析:按類型、應用和地區分類-2026-2034 年洞察與預測
 2026年全球加固型工業顯示器市場報告2026年全球商用顯示器市場報告2026年全球工業顯示器市場報告