

 |
市場調查報告書
商品編碼
1833400
工業顯示器市場機會、成長動力、產業趨勢分析及2025-2034年預測Industrial Display Market Opportunity, Growth Drivers, Industry Trend Analysis, and Forecast 2025 - 2034 |
||||||
2024 年全球工業顯示器市場價值為 59.5 億美元,預計將以 6% 的複合年成長率成長,到 2034 年達到 104.1 億美元。
製造業、石油天然氣、汽車和能源產業對自動化和數位控制的依賴日益成長,這推動了對工業顯示器作為HMI系統重要組件的需求。這些介面可協助操作員即時監控、控制和排除設備故障,進而提高效率和安全性。
| 市場範圍 | |
|---|---|
| 起始年份 | 2024 |
| 預測年份 | 2025-2034 |
| 起始值 | 59.5億美元 |
| 預測值 | 104.1億美元 |
| 複合年成長率 | 6% |
LCD需求不斷成長
2024年,LCD市場佔據了相當大的佔有率,這得益於其成本效益、視覺清晰度以及在各種工業環境中的適應性。 LCD技術因其尺寸多樣、節能高效以及與傳統和現代系統的兼容性,仍然是一個受歡迎的選擇。製造商正在增強其LCD產品,增加觸控功能、陽光下可讀性和堅固外殼等特性,以支援在惡劣工作條件下的關鍵任務應用。
向 14 吋顯示器轉變
14英寸及以下的顯示器市場在2024年保持了永續的佔有率,這得益於其緊湊的外形和適合空間受限的安裝。這些較小的螢幕擴大應用於嵌入式系統,而清晰度、可靠性和低功耗對於嵌入式系統至關重要。該領域的公司專注於高解析度面板、無邊框玻璃設計和無風扇整合,以吸引那些尋求時尚耐用顯示解決方案的原始設備製造商 (OEM)。
機架安裝獲得青睞
2024年,機架式顯示器市場實現了可觀的成長,主要得益於伺服器機房、自動化控制中心和軍事應用。這一成長主要源於對能夠安全安裝在標準化機櫃內的高效顯示器的需求。這些顯示器因其堅固的設計、簡單的維護以及易於與機架式系統整合而備受青睞。
北美將成為推動力地區
2024年,北美工業顯示器市場佔據了相當大的佔有率。該地區在工業自動化、航太、能源和製造業領域擁有雄厚的基礎,推動了對可靠高效能顯示器解決方案的持續需求。工業4.0技術的普及和智慧基礎設施投資的增加進一步推動了市場的成長。除美國外,加拿大在擴大交通運輸和採礦業應用方面也發揮關鍵作用。
工業顯示器市場的主要參與者有施耐德電氣、Winmate Inc.、京東方科技集團股份有限公司、控創股份公司、羅克韋爾自動化公司、LG Display 有限公司、Pepperl+Fuchs SE、藝卓公司、松下控股公司、北爾電子集團、西門子股份公司、Sparton Corporation、三星電機公司、三菱株式會社、華華有限公司。
為了鞏固在工業顯示器市場的立足點,各公司正優先考慮產品客製化、模組化設計和軟體整合。其中,重點是開發能夠承受振動、極端溫度和污染的堅固耐用的顯示器,使其成為惡劣工業環境的理想選擇。各公司也正在觸控螢幕創新、多語言介面和遠端顯示監控方面進行投資,以提升用戶體驗並減少維護需求。
目錄
第1章:方法論與範圍
第2章:執行摘要
第3章:行業洞察
- 產業生態系統分析
- 供應商概況
- 利潤率
- 成本結構
- 每個階段的增值
- 影響價值鏈的因素
- 中斷
- 產業衝擊力
- 成長動力
- 製造業和工業流程自動化程度不斷提高
- 工業運作中的成本效益和耐用性
- 快速城市化和基礎設施發展
- 智慧工廠和IIOT部署的擴展
- 產業陷阱與挑戰
- 先進顯示技術的初始成本高
- 與遺留系統的兼容性和整合問題
- 成長動力
- 成長潛力分析
- 監管格局
- 北美洲
- 歐洲
- 亞太地區
- 拉丁美洲
- 中東和非洲
- 波特的分析
- PESTEL分析
- 技術和創新格局
- 當前的技術趨勢
- 新興技術
- 價格趨勢
- 歷史價格分析(2021-2024)
- 價格趨勢促進因素
- 區域價格差異
- 價格預測(2025-2034)
- 定價策略
- 新興商業模式
- 合規性要求
- 永續性措施
- 永續材料評估
- 碳足跡分析
- 循環經濟實施
- 永續性認證和標準
- 永續性投資報酬率分析
- 全球消費者情緒分析
- 專利分析
第4章:競爭格局
- 介紹
- 公司市佔率分析
- 按地區
- 北美洲
- 歐洲
- 亞太地區
- 拉丁美洲
- 中東和非洲
- 市場集中度分析
- 按地區
- 關鍵參與者的競爭基準
- 財務績效比較
- 收入
- 利潤率
- 研發
- 產品組合比較
- 產品範圍廣度
- 科技
- 創新
- 地理位置比較
- 全球足跡分析
- 服務網路覆蓋
- 各地區市場滲透率
- 競爭定位矩陣
- 領導者
- 挑戰者
- 追蹤者
- 利基市場參與者
- 戰略展望矩陣
- 財務績效比較
- 2021-2024 年關鍵發展
- 併購
- 夥伴關係與合作
- 技術進步
- 擴張和投資策略
- 永續發展舉措
- 數位轉型舉措
- 新興/新創企業競爭對手格局
第5章:市場估計與預測:按顯示類型,2021 - 2034
- 主要趨勢
- LCD(液晶顯示器)
- LED(發光二極體)
- OLED(有機LED)
- 電子紙顯示器
- CRT(陰極射線管)
第6章:市場估計與預測:按面板尺寸,2021 - 2034
- 主要趨勢
- 最大 14 英寸
- 14英寸 - 21英寸
- 21英寸 - 40英寸
- 40吋以上
第7章:市場估計與預測:按安裝類型 2021 - 2034
- 主要趨勢
- 機架安裝
- 面板安裝
- 開放式框架
- 壁掛式
- VESA 支架
第 8 章:市場估計與預測:按應用,2021 - 2034 年
- 主要趨勢
- 人機介面(HMI)
- 數位看板
- 監視和監控
- 互動式資訊亭
- 控制室
- 工業自動化
- 醫療設備展示
- 其他
第9章:市場估計與預測:按垂直產業,2021 - 2034 年
- 主要趨勢
- 製造業
- 汽車
- 電子和半導體
- 機械設備
- 紡織品
- 其他
- 石油和天然氣
- 能源與電力
- 採礦和金屬
- 運輸與物流(工業運作)
- 食品和飲料加工
- 其他
第 10 章:市場估計與預測:按地區,2021 年至 2034 年
- 主要趨勢
- 北美洲
- 美國
- 加拿大
- 歐洲
- 德國
- 英國
- 法國
- 西班牙
- 義大利
- 荷蘭
- 亞太地區
- 中國
- 印度
- 日本
- 澳洲
- 韓國
- 拉丁美洲
- 巴西
- 墨西哥
- 阿根廷
- 中東和非洲
- 沙烏地阿拉伯
- 南非
- 阿拉伯聯合大公國
第 11 章:公司簡介
- 全球參與者
- Advantech Co., Ltd.
- AU Optronics Corporation
- BOE Technology Group Co., Ltd.
- Dell Technologies Inc.
- EIZO Corporation
- Hewlett-Packard Enterprise (HPE)
- Kontron AG
- Kyocera Corporation
- LG Display Co., Ltd.
- Mitsubishi Electric Corporation
- Panasonic Holdings Corporation
- Pepperl+Fuchs SE
- Rockwell Automation, Inc.
- Samsung Electronics Co., Ltd.
- Schneider Electric SE
- Siemens AG
- 區域參與者
- Axiomtek Co., Ltd.
- Beijer Electronics Group AB
- Crystal Group, Inc.
- Hope Industrial Systems, Inc.
- IBASE Technology Inc.
- Sparton Corporation
- Winmate Inc.
- 新興玩家
- Litemax Electronics Inc.
- Touch International, Inc.
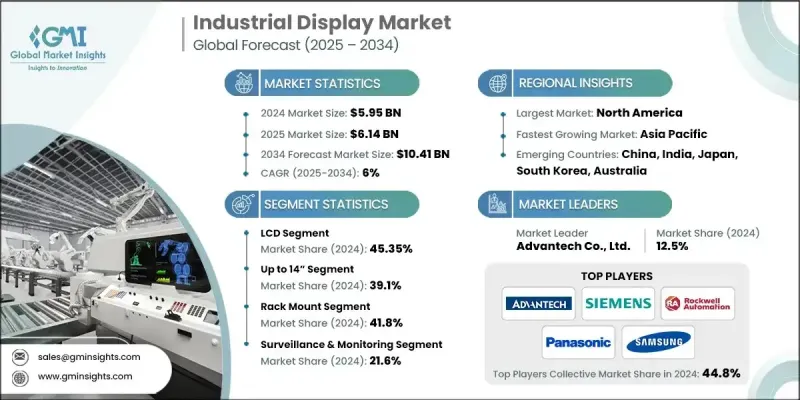
The Global Industrial Display Market was valued at USD 5.95 billion in 2024 and is estimated to grow at a CAGR of 6% to reach USD 10.41 billion by 2034.
The growing reliance on automation and digital control across manufacturing, oil & gas, automotive, and energy industries is boosting demand for industrial displays as essential components of HMI systems. These interfaces help operators monitor, control, and troubleshoot equipment in real time, improving efficiency and safety.
| Market Scope | |
|---|---|
| Start Year | 2024 |
| Forecast Year | 2025-2034 |
| Start Value | $5.95 billion |
| Forecast Value | $10.41 billion |
| CAGR | 6% |
Rising Demand for LCD
The LCD segment held a significant share in 2024, owing to its cost-efficiency, visual clarity, and adaptability across a wide range of industrial environments. LCD technology remains a popular choice due to its availability in various sizes, energy efficiency, and compatibility with both legacy and modern systems. Manufacturers are enhancing their LCD offerings with features such as touch capability, sunlight readability, and rugged enclosures to support mission-critical applications across harsh operating conditions.
Increasing Shift towards 14" inches Display
The displays up to 14 inches segment held a sustainable share in 2024, fueled by their compact form factor and suitability for space-constrained installations. These smaller screens are increasingly used in embedded systems, where clarity, reliability, and low power consumption are essential. Companies in this segment are focusing on high-resolution panels, edge-to-edge glass designs, and fanless integration to appeal to OEMs looking for sleek and durable display solutions.
Rack Mount to Gain Traction
The rack mount segment generated sizeable growth in 2024, backed by server rooms, automation control centers, and military applications. The growth is fueled by the need for space-efficient displays that can be securely mounted within standardized enclosures. These displays are favored for their robust design, simplified maintenance, and ease of integration with rack-based systems.
North America to Emerge as a Propelling Region
North America industrial display market held a substantial share in 2024. The region's strong base of industrial automation, aerospace, energy, and manufacturing sectors drives consistent demand for reliable and high-performance display solutions. Growth is further supported by increased adoption of Industry 4.0 technologies and rising investments in smart infrastructure. In addition to the U.S., Canada also plays a key role in expanding applications in transportation and mining.
Major players in the industrial display market are Schneider Electric SE, Winmate Inc., BOE Technology Group Co., Ltd., Kontron AG, Rockwell Automation, Inc., LG Display Co., Ltd., Pepperl+Fuchs SE, EIZO Corporation, Panasonic Holdings Corporation, Beijer Electronics Group AB, Siemens AG, Sparton Corporation, Samsung Electronics Co., Ltd., Mitsubishi Electric Corporation, Advantech Co., Ltd., AU Optronics Corporation.
To solidify their foothold in the industrial display market, companies are prioritizing product customization, modular design, and software integration. A major focus is on developing ruggedized displays that can withstand vibration, temperature extremes, and contamination, making them ideal for harsh industrial settings. Firms are also investing in touchscreen innovations, multi-language interfaces, and remote display monitoring to enhance user experience and reduce maintenance needs.
Table of Contents
Chapter 1 Methodology and Scope
- 1.1 Market scope and definition
- 1.2 Research design
- 1.2.1 Research approach
- 1.2.2 Data collection methods
- 1.3 Data mining sources
- 1.3.1 Global
- 1.3.2 Regional/Country
- 1.4 Base estimates and calculations
- 1.4.1 Base year calculation
- 1.4.2 Key trends for market estimation
- 1.5 Primary research and validation
- 1.5.1 Primary sources
- 1.6 Forecast model
- 1.7 Research assumptions and limitations
Chapter 2 Executive Summary
- 2.1 Industry snapshot
- 2.2 Key market trends
- 2.2.1 Business trends
- 2.2.2 Display type trends
- 2.2.3 Panel size trends
- 2.2.4 Mounting type trends
- 2.2.5 Application trends
- 2.2.6 Verticals trends
- 2.2.7 Regional trends
- 2.3 TAM Analysis, 2025-2034 (USD Billion)
- 2.4 CXO perspective: Strategic imperatives
- 2.4.1 Executive decision points
- 2.4.2 critical success factors
- 2.5 Future outlook and strategic recommendations
Chapter 3 Industry Insights
- 3.1 Industry ecosystem analysis
- 3.1.1 Supplier Landscape
- 3.1.2 Profit Margin
- 3.1.3 Cost structure
- 3.1.4 Value addition at each stage
- 3.1.5 Factor affecting the value chain
- 3.1.6 Disruptions
- 3.2 Industry impact forces
- 3.2.1 Growth drivers
- 3.2.1.1 Rising automation in manufacturing and industrial processes
- 3.2.1.2 Cost-effectiveness and durability in industrial operations
- 3.2.1.3 Rapid urbanization and infrastructure development
- 3.2.1.4 Expansion of smart factories and IIOT deployments
- 3.2.2 Industry pitfalls and challenges
- 3.2.2.1 High initial cost of advanced display technologies
- 3.2.2.2 Compatibility and integration issues with legacy systems
- 3.2.1 Growth drivers
- 3.3 Growth potential analysis
- 3.4 Regulatory landscape
- 3.4.1 North America
- 3.4.2 Europe
- 3.4.3 Asia Pacific
- 3.4.4 Latin America
- 3.4.5 Middle East & Africa
- 3.5 Porter’s analysis
- 3.6 PESTEL analysis
- 3.7 Technology and innovation landscape
- 3.7.1 Current technological trends
- 3.7.2 Emerging technologies
- 3.8 Price trends
- 3.8.1 Historical price analysis (2021-2024)
- 3.8.2 Price trend drivers
- 3.8.3 Regional price variations
- 3.8.4 Price forecast (2025-2034)
- 3.9 Pricing strategies
- 3.10 Emerging business models
- 3.11 Compliance requirements
- 3.12 Sustainability measures
- 3.12.1 Sustainable materials assessment
- 3.12.2 Carbon footprint analysis
- 3.12.3 Circular economy implementation
- 3.12.4 Sustainability certifications and standards
- 3.12.5 Sustainability ROI analysis
- 3.13 Global consumer sentiment analysis
- 3.14 Patent analysis
Chapter 4 Competitive Landscape, 2024
- 4.1 Introduction
- 4.2 Company market share analysis
- 4.2.1 By region
- 4.2.1.1 North America
- 4.2.1.2 Europe
- 4.2.1.3 Asia Pacific
- 4.2.1.4 Latin America
- 4.2.1.5 Middle East & Africa
- 4.2.2 Market Concentration Analysis
- 4.2.1 By region
- 4.3 Competitive benchmarking of key players
- 4.3.1 Financial performance comparison
- 4.3.1.1 Revenue
- 4.3.1.2 Profit margin
- 4.3.1.3 R&D
- 4.3.2 Product portfolio comparison
- 4.3.2.1 Product range breadth
- 4.3.2.2 Technology
- 4.3.2.3 Innovation
- 4.3.3 Geographic presence comparison
- 4.3.3.1 Global footprint analysis
- 4.3.3.2 Service network coverage
- 4.3.3.3 Market penetration by region
- 4.3.4 Competitive positioning matrix
- 4.3.4.1 Leaders
- 4.3.4.2 Challengers
- 4.3.4.3 Followers
- 4.3.4.4 Niche players
- 4.3.5 Strategic outlook matrix
- 4.3.1 Financial performance comparison
- 4.4 Key developments, 2021-2024
- 4.4.1 Mergers and acquisitions
- 4.4.2 Partnerships and collaborations
- 4.4.3 Technological advancements
- 4.4.4 Expansion and investment strategies
- 4.4.5 Sustainability initiatives
- 4.4.6 Digital transformation initiatives
- 4.5 Emerging/ startup competitors landscape
Chapter 5 Market Estimates and Forecast, By Display Type, 2021 - 2034 (USD Million & Units)
- 5.1 Key trends
- 5.2 LCD (Liquid Crystal Display)
- 5.3 LED (Light Emitting Diode)
- 5.4 OLED (Organic LED)
- 5.5 E-paper displays
- 5.6 CRT (Cathode Ray Tube)
Chapter 6 Market Estimates and Forecast, By Panel Size, 2021 - 2034 (USD Million & Units)
- 6.1 Key trends
- 6.2 Up to 14”
- 6.3 14” - 21”
- 6.4 21” - 40”
- 6.5 Above 40”
Chapter 7 Market Estimates and Forecast, By Mounting Type 2021 - 2034 (USD Million & Units)
- 7.1 Key trends
- 7.2 Rack mount
- 7.3 Panel mount
- 7.4 Open frame
- 7.5 Wall mount
- 7.6 VESA mount
Chapter 8 Market Estimates and Forecast, By Application, 2021 - 2034 (USD Million & Units)
- 8.1 Key trends
- 8.2 HMI (Human-Machine Interface)
- 8.3 Digital signage
- 8.4 Surveillance & monitoring
- 8.5 Interactive kiosks
- 8.6 Control rooms
- 8.7 Industrial automation
- 8.8 Medical equipment displays
- 8.9 Others
Chapter 9 Market Estimates and Forecast, By Verticals, 2021 - 2034 (USD Million & Units)
- 9.1 Key trends
- 9.2 Manufacturing
- 9.2.1 Automotive
- 9.2.2 Electronics & semiconductors
- 9.2.3 Machinery & equipment
- 9.2.4 Textiles
- 9.2.5 Others
- 9.3 Oil & gas
- 9.4 Energy & power
- 9.5 Mining & metals
- 9.6 Transportation & logistics (industrial operations)
- 9.7 Food & beverage processing
- 9.8 Others
Chapter 10 Market Estimates and Forecast, By Region, 2021 - 2034 (USD Million)
- 10.1 Key trends
- 10.2 North America
- 10.2.1 U.S.
- 10.2.2 Canada
- 10.3 Europe
- 10.3.1 Germany
- 10.3.2 UK
- 10.3.3 France
- 10.3.4 Spain
- 10.3.5 Italy
- 10.3.6 Netherlands
- 10.4 Asia Pacific
- 10.4.1 China
- 10.4.2 India
- 10.4.3 Japan
- 10.4.4 Australia
- 10.4.5 South Korea
- 10.5 Latin America
- 10.5.1 Brazil
- 10.5.2 Mexico
- 10.5.3 Argentina
- 10.6 Middle East and Africa
- 10.6.1 Saudi Arabia
- 10.6.2 South Africa
- 10.6.3 UAE
Chapter 11 Company Profiles
- 11.1 Global Players
- 11.1.1 Advantech Co., Ltd.
- 11.1.2 AU Optronics Corporation
- 11.1.3 BOE Technology Group Co., Ltd.
- 11.1.4 Dell Technologies Inc.
- 11.1.5 EIZO Corporation
- 11.1.6 Hewlett-Packard Enterprise (HPE)
- 11.1.7 Kontron AG
- 11.1.8 Kyocera Corporation
- 11.1.9 LG Display Co., Ltd.
- 11.1.10 Mitsubishi Electric Corporation
- 11.1.11 Panasonic Holdings Corporation
- 11.1.12 Pepperl+Fuchs SE
- 11.1.13 Rockwell Automation, Inc.
- 11.1.14 Samsung Electronics Co., Ltd.
- 11.1.15 Schneider Electric SE
- 11.1.16 Siemens AG
- 11.2 Regional Players
- 11.2.1 Axiomtek Co., Ltd.
- 11.2.2 Beijer Electronics Group AB
- 11.2.3 Crystal Group, Inc.
- 11.2.4 Hope Industrial Systems, Inc.
- 11.2.5 IBASE Technology Inc.
- 11.2.6 Sparton Corporation
- 11.2.7 Winmate Inc.
- 11.3 Emerging Players
- 11.3.1 Litemax Electronics Inc.
- 11.3.2 Touch International, Inc.
 商用顯示器市場:2026-2032年全球市場預測(依顯示技術、面板尺寸、解析度、亮度等級、安裝方式及最終使用者分類)工業IoT顯示器市場:2026年至2032年全球市場預測,依產業、應用、顯示器類型、連接方式、部署模式、觸控功能、解析度和螢幕大小工業顯示器市場:按面板類型、顯示器尺寸、觸控技術、解析度和終端用戶產業分類-2026-2032年全球市場預測商業顯示器市場:2026-2032年全球市場預測,依產品、技術、類型、顯示器尺寸、安裝方式、應用、最終用戶及通路分類
 工業IoT顯示器市場規模、佔有率和成長分析:按應用、連接方式、顯示器類型、面板尺寸和地區分類-2026-2033年產業預測
 工業IoT顯示器市場分析及預測(至2035年):依類型、產品類型、服務、技術、組件、應用、形狀、材質、設備及部署方式分類
 商業顯示器市場規模、佔有率、成長及全球產業分析:按類型、應用和地區分類-2026-2034 年洞察與預測
 2026年全球加固型工業顯示器市場報告2026年全球商用顯示器市場報告2026年全球工業顯示器市場報告