


 |
市場調查報告書
商品編碼
1836677
飛機感測器:市場佔有率分析、行業趨勢、統計數據和成長預測(2025-2030 年)Aircraft Sensors - Market Share Analysis, Industry Trends & Statistics, Growth Forecasts (2025 - 2030) |
||||||
※ 本網頁內容可能與最新版本有所差異。詳細情況請與我們聯繫。
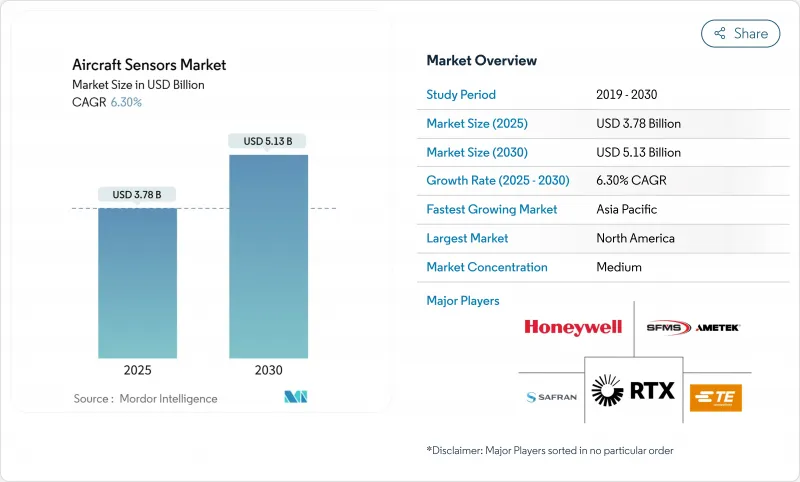
預計飛機感測器市場規模到 2025 年將達到 37.8 億美元,到 2030 年將達到 51.3 億美元,複合年成長率為 6.30%。
這一發展軌跡反映了飛機隊的持續擴張、向線傳操縱系統的轉變以及預測性維護服務的日益普及。美國聯邦航空管理局 (FAA) 於 2024 年收緊了航空防撞規則,迫使營運商升級其感測套件,引擎製造商也推出了支援燃燒永續航空燃料 (SAF) 的高溫感測器。隨著航空公司尋求降低氣候引發湍流的風險,基於雷達的天氣和危險規避產品發展勢頭強勁。國防買家加速了現代化進程,斥資 2.7 億美元用於 F-22 猛禽的紅外線升級,並擴大了依賴密集、強大感測器網路的自主平台的訂單。將感測器硬體與雲端分析相結合的供應商贏得了優質契約,但全球航太級半導體短缺延長了前置作業時間並提高了資格確認門檻。
全球飛機感測器市場趨勢與洞察
線傳和健康監測架構的採用正在加速
飛機專案已從機械聯動轉向電子飛行控制系統,該系統依賴三重冗餘感測器來控制每個關鍵參數。柯林斯太空在F-35上展示了增強型電源和冷卻系統,使其熱容量翻倍,以支援密集型能耗的感測器負載。航空公司已整合了結構安全監控套件,結合即時感測器流的預測分析,可將停機時間減少30%。感測器融合軟體將壓力、慣性和雷達訊號整合成統一的飛行影像,從而提高自動駕駛儀的反應速度並實現單一駕駛員操作。
轉向支援 SAF 的引擎可促進高精度發情偵測
由於SAF混合物會改變燃燒室的溫度曲線,引擎製造商被要求指定能夠承受1400°F(約740攝氏度)高溫的熱電偶,這幾乎是傳統感測器極限的三倍。美國能源局發起的「SAF大挑戰」計畫的目標是到2030年每年減少30億加侖燃油,這正在刺激整個供應鏈對燃油品質和排放氣體感測器的需求。航空公司正在部署配備SAF的數位燃油流量計和廢氣感測器,以檢驗稅額扣抵所需的二氧化碳減排量。
航太級 ASIC 持續面臨供應鏈緊縮
抗輻射處理器和混合訊號ASIC的前置作業時間已延長至40週,超過了疫情前12週的標準。航空業佔全球晶片需求的不到2%,對代工廠來說並非優先發展領域。顧問公司報告稱,66%的航太一級供應商正面臨2025年資源配置短缺的困境。飛機製造商儲備了安全關鍵型設備,但庫存緩衝增加了營運成本需求,並推遲了改裝計畫。
報告中分析的其他促進因素和限制因素
- 美國聯邦航空管理局要求升級航空防撞系統
- 將駕駛員即服務平台納入互聯車隊的主流
- 認證積壓延遲了新感測器的設計和部署
細分分析
固定翼飛機專案將佔據市場主導地位,在商用噴射機交付的推動下,到2024年將佔據72.54%的飛機感測器市場。預計2030年,固定翼飛機感測器市場規模將超過30億美元,複合年成長率為5.8%。其中,隨著國防部為傳統戰鬥機維修廣域紅外線、雷達和電子戰套件,軍用飛機感測器的年成長率達到8.30%。洛克希德馬丁公司對F-22的升級改造,充分體現了360度被動監視的溢價。
旋翼機和傾斜式旋翼機隊採用頻譜攝影機和LiDAR進行低空避障。柯林斯太空的感知感測系統實現了低能見度條件下的自動著陸。旋翼機和戰鬥機之間軟體定義感測器處理器的互通性降低了非經常性工程成本,並加快了出口機型的上市時間。隨著自主貨運無人機的規模擴大,對輕型慣性和氣壓模組的需求將推動所有機型的飛機感測器市場擴張。
壓力裝置是皮托靜壓系統、環境控制和引擎油系統的支柱,其出貨量保持穩定。然而,由於航空公司對先進的湍流預測和除冰建議功能的需求,雷達裝置的複合年成長率達到9.75%,成長最快。預計到2030年,雷達飛機感測器市場規模將達到12億美元,這反映了改裝和Line-Fit項目的需求。 ACAS Xa的需求進一步推動了支線飛機空中監視雷達的需求。
Edge-AI 套件將雷達、LiDAR和光學輸入整合到一塊基板,減少了 20% 的佈線,並支援基於狀態的天線校準。 MEMS加速計和接近檢測器受益於汽車成本曲線,同時繼續進行補充篩檢以滿足 RTCA DO-160 振動曲線。溫度和流量感測器的設計人員增加了網路安全封裝,以滿足即將訂定的 FAA 網路安全要求,這增加了組件成本,但鞏固了長期業務收益前景。
區域分析
到2024年,北美將佔全球需求的42.52%,這得益於各大航空公司增加的國防部支出以及飛機現代化宣傳活動。國內感測器供應商利用其與美國聯邦航空管理局(FAA)的早期合作,制定了相關標準,並在海外規則採用後提升了出口前景。然而,由於對海外晶片製造的依賴,華盛頓根據《晶片法案》(CHIPS Act)撥款520億美元,用於增強國內微電子能力。
由於航空公司擴大窄體機隊規模,以及各國政府資助本土感測器計畫以降低出口管制風險,亞太地區錄得最高成長率,達7.85%。預計到2043年,中國航空服務價值將達到610億美元,超過所有其他國家市場。日本和韓國製造商合作開發用於城市空氣動力移動車輛的MEMS慣性模組,印度則推進了其本土航空數據感測器藍圖,以支援支線噴射機計劃。
歐洲繼續保持技術領先地位,實施嚴格的永續性和網路安全規則,促進了感測器領域的創新。泰雷茲完成了對科巴姆航空航太通訊公司的收購,透過感測器和安全資料鏈路的組合增強了其航空電子設備產品組合。歐洲航空安全局與美國聯邦航空管理局的協調促進了相互認可的核准,但供應商仍遵循各自的文件流程。該地區強調了SAF檢驗設備和非二氧化碳排放監測,這是Fit-for-55氣候方案的一部分。
其他福利:
- Excel 格式的市場預測 (ME) 表
- 3個月的分析師支持
目錄
第1章 引言
- 研究假設和市場定義
- 調查範圍
第2章調查方法
第3章執行摘要
第4章 市場狀況
- 市場概況
- 市場促進因素
- 加速採用電傳操縱與健康監測架構
- 轉向支援 SAF 的引擎可促進高精度熱感感
- 美國聯邦航空管理局要求升級飛機防撞能力
- 將駕駛員即服務平台納入互聯車隊的主流
- 透過積層製造降低感測器外殼的單位成本
- 利用支援邊緣 AI 的自校準感測器降低 MRO 成本
- 市場限制
- 航太級 ASIC 的供應鏈持續面臨壓力
- 認證積壓推遲了新的感測器設計
- 網路強化要求推高了組件成本
- MEMS IMU 出口限制趨嚴
- 價值鏈分析
- 監管狀況
- 技術展望
- 波特五力分析
- 新進入者的威脅
- 購買者和消費者的議價能力
- 供應商的議價能力
- 替代品的威脅
- 競爭對手之間的競爭強度
第5章市場規模及成長預測(金額)
- 按飛機類型
- 固定翼飛機
- 商用飛機
- 窄體飛機
- 寬體飛機
- 支線噴射機
- 商務及通用航空
- 公務機
- 輕型飛機
- 軍用機
- 戰鬥機
- 運輸機
- 特殊任務飛機
- 旋翼機
- 商用直升機
- 軍用直升機
- 固定翼飛機
- 依感測器類型
- 壓力
- 溫度
- 位置
- 流動
- 扭力
- 雷達
- 加速計
- 接近感測器
- 其他感測器
- 按用途
- 燃料、液壓和氣壓系統
- 引擎和輔助動力裝置(APU)
- 客艙和貨物環境控制
- 飛行控制系統
- 飛行甲板
- 起落架系統
- 武器系統
- 其他
- 按最終用戶
- OEM
- 售後市場/MRO
- 按地區
- 北美洲
- 美國
- 加拿大
- 墨西哥
- 南美洲
- 巴西
- 墨西哥
- 其他南美
- 歐洲
- 英國
- 法國
- 德國
- 義大利
- 西班牙
- 俄羅斯
- 其他歐洲國家
- 亞太地區
- 中國
- 日本
- 印度
- 韓國
- 澳洲
- 其他亞太地區
- 中東和非洲
- 中東
- 沙烏地阿拉伯
- 以色列
- 阿拉伯聯合大公國
- 其他中東地區
- 非洲
- 南非
- 其他非洲國家
- 北美洲
第6章 競爭態勢
- 市場集中度
- 策略趨勢
- 市佔率分析
- 公司簡介
- TE Connectivity Corporation
- Honeywell International Inc.
- Meggitt PLC
- AMETEK Aerospace, Inc.
- Thales Group
- Collins Aerospace(RTX Corporation)
- Curtiss-Wright Corporation
- Safran SA
- Hydra-Electric Company
- PCB Piezotronics, Inc.(Amphenol Corporation)
- Precision Sensors(United Electric Controls)
- Moog Inc.
- Garmin Ltd.
- TT Electronics plc
- Woodward, Inc.
- EMCORE Corporation
- Bosch General Aviation Technology GmbH(Robert Bosch GmbH)
- Eaton Corporation plc
- Crane Company
第7章 市場機會與未來展望
The aircraft sensors market size stood at USD 3.78 billion in 2025 and is forecasted to climb to USD 5.13 billion by 2030, advancing at a 6.30% CAGR.
This trajectory reflects sustained fleet expansion, the migration to fly-by-wire control systems, and rising adoption of predictive maintenance services. Operators are compelled to upgrade sensing suites after the Federal Aviation Administration (FAA) tightened airborne collision-avoidance rules in 2024, while engine makers introduced higher-temperature sensors that support sustainable aviation fuel (SAF) combustion. Radar-based weather and hazard-avoidance products gained momentum as carriers sought to mitigate climate-driven turbulence risk. Military buyers accelerated modernization, funding a USD 270 million infrared upgrade for the F-22 Raptor and expanding orders for autonomous platforms that depend on dense, rugged sensor networks. Suppliers that combined sensor hardware with cloud analytics captured premium contracts, yet global shortages of aerospace-grade semiconductors stretched lead times and intensified qualification hurdles.
Global Aircraft Sensors Market Trends and Insights
Accelerated Adoption of Fly-by-Wire and Health-Monitoring Architectures
Aircraft programs shifted from mechanical linkages to electronic flight-control systems that rely on triple-redundant sensors for every critical parameter. Collins Aerospace demonstrated its Enhanced Power and Cooling System on the F-35, doubling thermal capacity to support energy-intensive sensor loads. Airlines integrated structural-health-monitoring suites that cut downtime by 30% when combined with predictive analytics from real-time sensor streams. Sensor fusion software stitched pressure, inertial, and radar feeds into a unified flight picture, improving autopilot responsiveness and enabling single-pilot operations.
Shift to SAF-Ready Engines Driving High-Accuracy Thermal Sensing
SAF blends alter combustor temperature profiles, prompting engine makers to specify thermocouples capable of surviving 1,400°F environments-nearly triple the limit of erstwhile transducers. The US Department of Energy's SAF Grand Challenge targeted 3 billion gallons of annual output by 2030, stimulating demand for fuel-quality and emissions sensors across supply chains. Airlines are deploying SAF-equipped digital fuel-flow meters and exhaust-gas sensors to verify carbon-reduction claims required for tax credits.
Persistent Supply-Chain Crunch of Aerospace-Grade ASICs
Lead times for radiation-tolerant processors and mixed-signal ASICs lengthened to 40 weeks, overshadowing pre-pandemic norms of 12 weeks. Aviation represented less than 2% of global chip demand, leaving it low on foundry priority lists. Consultancies reported that 66% of aerospace Tier-1s struggled with allocation shortfalls in 2025. Airframers stocked safety-critical devices, yet inventory buffers raised working-capital needs and delayed retrofit schedules.
Other drivers and restraints analyzed in the detailed report include:
- FAA Mandate on Airborne Collision-Avoidance Upgrades
- Mainstream Drivers-as-a-Service Platforms for Connected Fleets
- Certification Backlog Slowing New Sensor Design-ins
For complete list of drivers and restraints, kindly check the Table Of Contents.
Segment Analysis
Fixed-wing programs dominated demand, capturing 72.54% of the aircraft sensors market share in 2024 on the strength of commercial jet deliveries. The aircraft sensors market size for fixed-wing applications is projected to exceed USD 3 billion by 2030 at a 5.8% CAGR. Within that total, military aviation sensors are advancing 8.30% annually as defense ministries retrofit legacy fighters with wide-area infrared, radar, and electronic-warfare suites. Lockheed Martin's F-22 upgrade illustrated the premium paid for 360-degree passive surveillance.
Rotorcraft and tilt-rotor fleets embraced multispectral cameras and lidar for obstacle avoidance during low-altitude operations. Collins Aerospace's perception-sensing system enabled automated landing in degraded visual conditions. Cross-pollination of software-defined sensor processors between rotorcraft and fighter jets cut non-recurring engineering costs, compressing time-to-market for export variants. As autonomous cargo drones scale, demand for lightweight inertial and barometric modules will reinforce the expansion of the aircraft sensors market across all airframe classes.
Pressure devices remained foundational underlying pitot-static, environmental-control, and engine-oil systems with stable, high-volume shipments. Still, radar units registered the steepest growth at 9.75% CAGR as airlines sought advanced turbulence prediction and de-icing advisory features. The aircraft sensors market size for radar is forecast to reach USD 1.2 billion by 2030, reflecting both retrofit and line-fit programs. ACAS Xa requirements further boosted airborne surveillance radars for regional jets.
Edge-AI packages integrated radar, lidar, and optical inputs on a single board, reducing wiring by 20% and enabling condition-based antenna calibration. MEMS accelerometers and proximity detectors benefited from automotive cost curves yet continued to undergo supplemental screening to meet RTCA DO-160 vibration profiles. Temperature and flow sensor designers added cybersecurity wrappers to satisfy imminent FAA network-security mandates, raising bill-of-materials cost but cementing long-term service revenue prospects.
The Aircraft Sensors Market Report is Segmented by Aircraft Type (Fixed-Wing and Rotary-Wing), Sensor Type (Temperature, Pressure, Position, Flow, Torque, Radar, and More), Application (Fuel, Hydraulic and Pneumatic Systems, Engine and Auxiliary Power Unit (APU), and More), End User (OEM and Aftermarket/MRO), and Geography (North America, Europe, Asia-Pacific, and More). The Market Forecasts are Provided in Terms of Value (USD).
Geography Analysis
North America retained 42.52% of global demand in 2024, benefiting from major airlines' elevated Pentagon outlays and fleet-modernization campaigns. Domestic sensor suppliers leveraged early engagement with the FAA to shape standards, enhancing export prospects once rules were adopted abroad. Yet the reliance on offshore chip fabrication prompted Washington to allocate USD 52 billion under the CHIPS Act to bolster local microelectronics capacity.
Asia-Pacific recorded the highest growth rate at 7.85% CAGR as carriers expanded narrowbody fleets and governments funded Indigenous sensor programs to mitigate export-control risks. China's aviation services value was forecast to hit USD 61 billion by 2043, eclipsing every single country market. Japanese and Korean manufacturers collaborated on MEMS inertial modules for urban-air-mobility vehicles, while India advanced roadmaps for domestically produced air-data sensors to support regional jet projects.
Europe remained a technology bellwether, enforcing stringent sustainability and cybersecurity rules that fostered sensor innovation. Thales completed the Cobham Aerospace Communications acquisition, reinforcing avionics portfolios that blend sensors and secure datalinks. EASA's harmonization with the FAA facilitated reciprocal acceptance of approvals, but suppliers still navigated separate documentation streams. The region emphasized SAF validation instrumentation and non-CO2 emissions monitoring as part of its Fit-for-55 climate package.
- TE Connectivity Corporation
- Honeywell International Inc.
- Meggitt PLC
- AMETEK Aerospace, Inc.
- Thales Group
- Collins Aerospace (RTX Corporation)
- Curtiss-Wright Corporation
- Safran SA
- Hydra-Electric Company
- PCB Piezotronics, Inc. (Amphenol Corporation)
- Precision Sensors (United Electric Controls)
- Moog Inc.
- Garmin Ltd.
- TT Electronics plc
- Woodward, Inc.
- EMCORE Corporation
- Bosch General Aviation Technology GmbH (Robert Bosch GmbH)
- Eaton Corporation plc
- Crane Company
Additional Benefits:
- The market estimate (ME) sheet in Excel format
- 3 months of analyst support
TABLE OF CONTENTS
1 INTRODUCTION
- 1.1 Study Assumptions and Market Definition
- 1.2 Scope of the Study
2 RESEARCH METHODOLOGY
3 EXECUTIVE SUMMARY
4 MARKET LANDSCAPE
- 4.1 Market Overview
- 4.2 Market Drivers
- 4.2.1 Accelerated adoption of fly-by-wire and health-monitoring architectures
- 4.2.2 Shift to SAF-ready engines driving high-accuracy thermal sensing
- 4.2.3 FAA mandate on airborne collision-avoidance upgrades
- 4.2.4 Mainstream drivers-as-a-service platforms for connected fleets
- 4.2.5 Additive-manufactured sensor housings reducing unit cost
- 4.2.6 Edge-AI-enabled self-calibrating sensors lowering MRO spend
- 4.3 Market Restraints
- 4.3.1 Persistent supply-chain crunch of aerospace-grade ASICs
- 4.3.2 Certification backlog slowing new sensor design-ins
- 4.3.3 Cyber-hardening requirements inflating BOM cost
- 4.3.4 Export-control tightening on MEMS IMUs
- 4.4 Value Chain Analysis
- 4.5 Regulatory Landscape
- 4.6 Technological Outlook
- 4.7 Porter's Five Forces Analysis
- 4.7.1 Threat of New Entrants
- 4.7.2 Bargaining Power of Buyers/Consumers
- 4.7.3 Bargaining Power of Suppliers
- 4.7.4 Threat of Substitute Products
- 4.7.5 Intensity of Competitive Rivalry
5 MARKET SIZE AND GROWTH FORECASTS (VALUE)
- 5.1 By Aircraft Type
- 5.1.1 Fixed-Wing
- 5.1.1.1 Commercial Aviation
- 5.1.1.1.1 Narrowbody Aircraft
- 5.1.1.1.2 Widebody Aircraft
- 5.1.1.1.3 Regional TJets
- 5.1.1.2 Business and General Aviation
- 5.1.1.2.1 Business Jets
- 5.1.1.2.2 Light Aircraft
- 5.1.1.3 Military Aviation
- 5.1.1.3.1 Fighter Aircraft
- 5.1.1.3.2 Transport Aircraft
- 5.1.1.3.3 Special Mission Aircraft
- 5.1.2 Rotary-Wing
- 5.1.2.1 Commercial Helicopters
- 5.1.2.2 Military Helicopters
- 5.1.1 Fixed-Wing
- 5.2 By Sensor Type
- 5.2.1 Pressure
- 5.2.2 Temperature
- 5.2.3 Position
- 5.2.4 Flow
- 5.2.5 Torque
- 5.2.6 Radar
- 5.2.7 Accelerometers
- 5.2.8 Proximity
- 5.2.9 Other Sensors
- 5.3 By Application
- 5.3.1 Fuel,Hydraulic and Pneumatic Systems
- 5.3.2 Engine and Auxiliary Power Unit (APU)
- 5.3.3 Cabin and Cargo Environmental Controls
- 5.3.4 Flight Control Systems
- 5.3.5 Flight Decks
- 5.3.6 Landing Gear Systems
- 5.3.7 Weapon Systems
- 5.3.8 Others
- 5.4 By End User
- 5.4.1 OEM
- 5.4.2 Aftermarket/MRO
- 5.5 Geography
- 5.5.1 North America
- 5.5.1.1 United States
- 5.5.1.2 Canada
- 5.5.1.3 Mexico
- 5.5.2 South America
- 5.5.2.1 Brazil
- 5.5.2.2 Mexico
- 5.5.2.3 Rest of South America
- 5.5.3 Europe
- 5.5.3.1 United Kingdom
- 5.5.3.2 France
- 5.5.3.3 Germany
- 5.5.3.4 Italy
- 5.5.3.5 Spain
- 5.5.3.6 Russia
- 5.5.3.7 Rest of Europe
- 5.5.4 Asia-Pacific
- 5.5.4.1 China
- 5.5.4.2 Japan
- 5.5.4.3 India
- 5.5.4.4 South Korea
- 5.5.4.5 Australia
- 5.5.4.6 Rest of Asia-Pacific
- 5.5.5 Middle East and Africa
- 5.5.5.1 Middle East
- 5.5.5.1.1 Saudi Arbaia
- 5.5.5.1.2 Israel
- 5.5.5.1.3 United Arab Emirates
- 5.5.5.1.4 Rest of Middle East
- 5.5.5.2 Africa
- 5.5.5.2.1 South Africa
- 5.5.5.2.2 Rest of Africa
- 5.5.1 North America
6 COMPETITIVE LANDSCAPE
- 6.1 Market Concentration
- 6.2 Strategic Moves
- 6.3 Market Share Analysis
- 6.4 Company Profiles (includes Global level Overview, Market level overview, Core Segments, Financials as available, Strategic Information, Market Rank/Share for key companies, Products and Services, and Recent Developments)
- 6.4.1 TE Connectivity Corporation
- 6.4.2 Honeywell International Inc.
- 6.4.3 Meggitt PLC
- 6.4.4 AMETEK Aerospace, Inc.
- 6.4.5 Thales Group
- 6.4.6 Collins Aerospace (RTX Corporation)
- 6.4.7 Curtiss-Wright Corporation
- 6.4.8 Safran SA
- 6.4.9 Hydra-Electric Company
- 6.4.10 PCB Piezotronics, Inc. (Amphenol Corporation)
- 6.4.11 Precision Sensors (United Electric Controls)
- 6.4.12 Moog Inc.
- 6.4.13 Garmin Ltd.
- 6.4.14 TT Electronics plc
- 6.4.15 Woodward, Inc.
- 6.4.16 EMCORE Corporation
- 6.4.17 Bosch General Aviation Technology GmbH (Robert Bosch GmbH)
- 6.4.18 Eaton Corporation plc
- 6.4.19 Crane Company
7 MARKET OPPORTUNITIES AND FUTURE OUTLOOK
- 7.1 White-space and Unmet-Need Assessment
 飛機感測器市場-2026-2032年全球市場預測
 全球飛機感測器市場
 2026年全球飛機感測器市場報告
 日本飛機感測器市場報告(按飛機類型、感測器類型、連接方式、應用、最終用途和地區分類,2026-2034年)
 飛機感測器市場規模、佔有率和成長分析(按感測器類型、飛機類型、應用、連接方式、性別、最終用戶和地區分類)—產業預測,2026-2033年
 飛機感測器市場:2025-2030 年預測
 2025-2029年全球飛機感測器市場
 2034 年飛機感測器市場分析與預測:類型、產品、技術、組件、應用、材料類型、最終用戶、功能、安裝類型
 飛機感測器市場機會、成長動力、產業趨勢分析及 2025 - 2034 年預測
 飛機感測器的全球市場:各感測器類型,各用途,各飛機類型,各地區,機會,預測,2018年~2032年