


 |
市場調查報告書
商品編碼
1693760
歐洲農業生技藥品:市場佔有率分析、產業趨勢與統計、成長預測(2025-2030 年)Europe Agricultural Biologicals - Market Share Analysis, Industry Trends & Statistics, Growth Forecasts (2025 - 2030) |
||||||
※ 本網頁內容可能與最新版本有所差異。詳細情況請與我們聯繫。
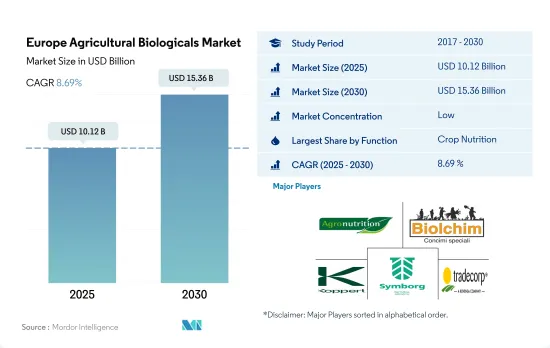
預計 2025 年歐洲農業生技藥品市場規模將達到 101.2 億美元,到 2030 年將達到 153.6 億美元,預測期內(2025-2030 年)的複合年成長率為 8.69%。
- 過度使用化學肥料和殺蟲劑會對生態系統產生多種負面影響。營養噴灑會造成空氣污染,氧化亞氮排放會導致氣候變化,並滲入水體。合成肥料的生產佔歐盟農業排放的40%以上。
- 有機農業旨在開發大幅減少非農業投入的使用和依賴的農業系統。因此,實現「從農場到餐桌」和生物多樣性策略的目標很大程度上依賴有機農業。到2030年,這些目標是減少化學肥料消費量至少20%,減少養分損失至少50%,同時確保土壤肥力不下降。
- 在作物營養領域,法國將佔最大佔有率,為 14.4%,2022 年價值 8.479 億美元。過去六年,法國連續作物面積增幅最大,增加了 150%,達到 308,420 公頃,因此法國在 2021 年升至第一名。這些成長要素預計將導致對生物肥料和生物刺激素等作物營養產品的需求增加。
- 在作物保護領域,義大利佔第三大佔有率,為17.3%,2022年價值為3.645億美元。生物農藥佔86.0%的高佔有率,預計2022年市場規模約3.135億美元,其次是生物防治劑,約5,100萬美元。
- 消費者對合成肥料有害影響的認知不斷提高,推動了國內外對有機農產品的需求。因此,預計該地區市場將在 2023 年至 2029 年間成長。
- 歐洲是世界上最大的有機作物生產區之一,歐洲國家的有機產品消費量很高。德國和法國是該地區主要的有機作物生產國,並且擁有最大的有機產品消費市場。
- 有機農業是歐洲農業的一個主要部門。 2019年,歐洲約有33萬名有機農民,涵蓋成員國耕地面積的20%。此外,「從農場到餐桌」策略的目標之一是增加歐洲有機農業的總面積,到2030年歐盟至少25%的農地將實現有機化。這些努力可能會在2023-2029年期間推動農業生技藥品市場的發展。
- 該地區的有機作物總種植面積從 2017 年的 490 萬公頃增加到 2022 年的 690 萬公頃。由於作物面積的上升趨勢,該地區的生技藥品市場在 2017 年至 2022 年間也將成長約 22.9%。預計在 2023 年至 2029 年間將成長約 63.4%,到 2029 年底將達到 141.2 億美元。
- 德國作為一個國家,是全球有機產品市場的主要貢獻者,2021 年有機產品需求達到 63 億美元,約佔全球總需求的 10.0%。德國在歐洲農業生技藥品市場佔據主導地位,2022 年佔市場價值的 8.0%。
- 隨著歐盟委員會制定計劃和計劃減少農業中化學投入的整體使用,作物種植面積的增加和對有機產品的需求的成長預計將在 2023-2029 年期間推動市場發展。
歐洲農業生技藥品市場趨勢
歐洲綠色交易全部區域有機農業的推廣做出了巨大貢獻
- 歐洲國家正大力推廣有機農業,過去十年來,被歸類為有機農業的土地面積大幅增加。 2021年3月,歐盟委員會推出了“有機行動計畫”,旨在實現《歐洲綠色交易》中到2030年25%的農業用地實現有機化的目標。奧地利、義大利、西班牙和德國是歐洲領先的有機農業國家。義大利有機耕種佔其農業用地面積的 15.0%,高於歐盟 7.5% 的平均水準。
- 2021年,歐盟有機土地面積達1,470萬公頃。農業生產區分為三大利用類型:作物(主要為穀物、根莖類作物和新鮮蔬菜)、永久性草地和永久性作物。 2021年,有機耕地面積將達650萬公頃,佔歐盟有機農業總面積的46%。
- 2017年至2021年間,歐盟有機種植穀物、油籽、蛋白質作物和豆類的面積增加了32.6%,達到1,60萬公頃以上。 2020年,種植多年生作物將達到130萬公頃,佔有機土地面積的15%。橄欖、葡萄、杏仁和柑橘類水果就是屬於這一類作物的幾個例子。西班牙、義大利和希臘是重要的有機橄欖種植國,近年來其種植面積分別為19.7萬公頃、17.9萬公頃和4.7萬公頃。橄欖和葡萄對歐洲農業都至關重要,因為它們可以加工成國內外都需要的特色產品。該地區有機種植面積的增加可望增強歐洲有機農業產業。
該地區對有機產品的需求不斷增加,人均支出不斷增加
- 歐洲消費者擴大購買採用天然材料和工藝製成的產品。有機食品不再是小眾產業,因為它在歐盟農業總產量中所佔的佔有率仍然很小。歐盟是國際第二大有機產品單一市場,人均年支出為74.8美元。過去十年,歐洲人均有機食品支出加倍。 2020 年,瑞士和丹麥消費者在有機食品上的支出最高(人均分別為 494.09 美元和 453.90 美元)。
- 根據全球有機貿易數據,德國是歐洲最大的有機食品市場,也是僅次於美國的全球第二大有機食品市場,2021年市場規模達63億美元,人均消費量達75.6美元。中國將佔全球有機食品需求的 10.0%,預計 2021 年至 2026 年的複合年成長率為 2.7%。
- 法國有機食品市場成長強勁,2021年零售額成長12.6%。根據全球有機貿易數據,2021年法國人均有機食品支出為88.8美元。 2018年,根據法國生物技術署/精神洞察晴雨表的記錄,88%的法國人表示他們曾經食用過有機產品。保護健康、環境和動物福利是法國消費有機食品的主要原因。西班牙、荷蘭和瑞典等其他幾個國家的有機市場也開始成長,紛紛開設有機商店。在新冠疫情期間和之後,有機食品的銷量增加。這是因為消費者越來越關注健康問題,並且了解傳統種植食品的負面影響。
歐洲農業生技藥品產業概況
歐洲農業生技藥品市場細分化,前五大公司佔2.19%的市場。市場的主要企業包括 Agronutrition、Biolchim SpA、Koppert Biological Systems Inc.、Symborg Inc.、Trade Corporation International 等。
其他福利
- Excel 格式的市場預測 (ME) 表
- 3個月的分析師支持
目錄
第1章執行摘要和主要發現
第2章 報告要約
第3章 引言
- 研究假設和市場定義
- 研究範圍
- 調查方法
第4章 產業主要趨勢
- 有機種植區
- 有機產品人均支出
- 法律規範
- 法國
- 德國
- 義大利
- 荷蘭
- 俄羅斯
- 西班牙
- 土耳其
- 英國
- 價值鍊和通路分析
第5章市場區隔
- 功能
- 作物營養
- 生物肥料
- 固氮螺菌
- 固氮菌
- 菌根真菌
- 解磷細菌
- 根瘤菌
- 其他生物肥料
- 生物肥料
- 胺基酸
- 富裡酸
- 腐植酸
- 蛋白質水解物
- 海藻萃取物
- 其他生物刺激素
- 有機肥
- 肥料
- 餐食基肥料
- 油餅
- 其他有機肥料
- 作物保護
- 生物防治劑
- 大型微生物
- 微生物
- 生物防治劑
- 生物真菌劑
- 生物除草劑
- 生物殺蟲劑
- 其他生物防治劑
- 作物營養
- 作物類型
- 經濟作物
- 園藝作物
- 耕地作物
- 原產地
- 法國
- 德國
- 義大利
- 荷蘭
- 俄羅斯
- 西班牙
- 土耳其
- 英國
- 其他歐洲國家
第6章競爭格局
- 關鍵策略趨勢
- 市場佔有率分析
- 商業狀況
- 公司簡介
- Agronutrition
- Andermatt Group AG
- Atlantica Agricola
- Biolchim SpA
- Bionema
- Koppert Biological Systems Inc.
- Lallemand Inc.
- Sustane Natural Fertilizer, Inc
- Symborg Inc.
- Trade Corporation International
第7章 CEO 的關鍵策略問題
第 8 章 附錄
- 世界概況
- 概述
- 五力分析框架
- 全球價值鏈分析
- 市場動態(DRO)
- 資訊來源及延伸閱讀
- 圖片列表
- 關鍵見解
- 數據包
- 詞彙表
The Europe Agricultural Biologicals Market size is estimated at 10.12 billion USD in 2025, and is expected to reach 15.36 billion USD by 2030, growing at a CAGR of 8.69% during the forecast period (2025-2030).
- There are several adverse effects of excessive fertilizer and pesticide use on the ecosystem. Applying nutrients causes air pollution, while nitrous oxide emissions contribute to climate change and leach into water systems. The manufacturing of synthetic fertilizers is responsible for over 40% of the agricultural emissions in the European Union.
- Organic farming aims to develop agricultural systems that use and depend on non-farm inputs far less. Thus, accomplishing the goals of the Farm to Fork and Biodiversity strategies depends heavily on organic agriculture. By 2030, these goals seek to reduce fertilizer consumption by at least 20% and reduce nutrient losses by at least 50% while ensuring that soil fertility does not decline.
- In the crop nutrition segment, France occupies the largest share of 14.4%, valued at USD 847.9 million in 2022. France rose to first place in 2021 as the country experienced the strongest growth in areas dedicated to row crops in six years, amounting to 308,420 hectares, an increase of 150%. Such growth factors are expected to result in increased demand for crop nutrition products such as biofertilizers and biostimulants.
- In the crop protection segment, Italy occupied the third-largest share of 17.3%, valued at USD 364.5 million in 2022. Biopesticides occupied a higher share of 86.0%, valued at about USD 313.5 million in 2022 in the market, followed by biocontrol agents, valued at about USD 51.0 million in the same year.
- The increasing awareness among consumers regarding the harmful impact of synthetic fertilizers has increased the demand for organic produce at the international and domestic levels. Thus, the market is expected to experience growth in the region between 2023 and 2029.
- The European region is one of the world's largest organic crop producers, and organic product consumption is high in European countries. Germany and France are some of the major organic crop producers in the region, and they have the highest organic product consumption markets.
- Organic farming is a key sector of European agriculture. In 2019, there were almost 330,000 organic farmers in Europe, reaching up to 20% share of the farming area in the Member States. In addition, one of the targets of the Farm to Fork Strategy concerns the increase in the total farmland under organic farming in Europe, with at least 25% of the EU's agricultural land to be under organic farming by 2030. These initiatives may drive the agricultural biologicals market between 2023 and 2029.
- The overall organic area in the region increased from 4.9 million hectares in 2017 to 6.9 million hectares in 2022. With this increasing trend in overall organic crop area, the biologicals market in the region also increased by about 22.9% between 2017 and 2022. It is anticipated to increase by about 63.4% between 2023 and 2029 and reach USD 14.12 billion by the end of 2029.
- As an individual country, Germany significantly contributed to the global market for organic products, with demand for organic goods reaching USD 6.3 billion in 2021, or around 10.0% of the total global demand. Germany dominates the European agricultural biologicals market, and it accounted for 8.0% of the market value in 2022.
- The European Commission schemes or projects to decrease the overall chemical inputs in agriculture and the increase in the organic crop area and demand for organic products are anticipated to drive the market between 2023 and 2029.
Europe Agricultural Biologicals Market Trends
European green deal is majorly contributing for increasing organic cultivation across the region
- European countries are increasingly promoting organic farming, and the amount of land categorized as organic has significantly increased over the last 10 years. In March 2021, the European Commission launched an organic action plan to achieve the European Green Deal target of ensuring that 25% of agricultural land is under organic farming by 2030. Austria, Italy, Spain, and Germany are among the leading countries for organic cultivation in the European region. Italy has 15.0% of its agricultural area under organic farming, which is higher than the EU average of 7.5%.
- In 2021, organic land in the European Union was recorded at 14.7 million hectares. The agricultural production area is divided into three main types of use: arable land crops (mainly cereals, root crops, and fresh vegetables), permanent grassland, and permanent crops. The area of organic arable land was 6.5 million hectares in 2021, the equivalent of 46% of the European Union's total organic agricultural area.
- The organic cultivation area of cereals, oilseeds, protein crops, and pulses in the European Union increased by 32.6% between 2017 and 2021, amounting to more than 1.6 million hectares. With 1.3 million hectares in production, perennial crops accounted for 15% of the organic land in 2020. Olives, grapes, almonds, and citrus fruits are a few examples of crops in this group. Spain, Italy, and Greece are significant growers of organic olive trees, with 197,000, 179,000, and 47,000 hectares, respectively, in recent years. Both olives and grapes are crucial for the European agricultural industry because they can be turned into specialty products that are in demand locally and globally. The increasing organic acreage in the region is expected to strengthen the organic agricultural industry in Europe.
Growing demand and rising the per capita spending on organic products in the region
- European consumers are increasingly purchasing goods made using natural materials and methods. Even though organic food still only makes up a fraction of the European Union's overall agricultural production, it is no longer a niche industry. The European Union represents the second-largest single market for organic goods internationally, with an average per capita spending of USD 74.8 annually. The per capita spending on organic food in Europe has doubled in the last decade. In 2020, Swiss and Danish consumers spent the most on organic food (USD 494.09 and USD 453.90 per capita, respectively).
- Germany is the largest organic food market in Europe and the second largest market in the world after the United States, with a market size of USD 6.3 billion in 2021 and a per capita consumption of USD 75.6, as per Global Organic Trade data. The country accounted for 10.0% of the global organic food demand and is estimated to record a CAGR of 2.7% between 2021 and 2026.
- The organic food market in France witnessed strong growth, with a 12.6% rise in retail sales in 2021. The country's per capita spending on organic food was recorded at USD 88.8 in 2021, as per Global Organic Trade data. In 2018, as recorded by the Agence BIO/Spirit Insight Barometer, 88% of French people declared having consumed organic products. The preservation of health, environment, and animal welfare are the primary justifications for consuming organic foods in France. The organic market has begun to grow in several other nations, including Spain, the Netherlands, and Sweden, with the opening of organic stores. Organic food sales grew during and post the COVID-19 pandemic as consumers began paying more attention to health issues and learned the adverse effects of conventionally grown food.
Europe Agricultural Biologicals Industry Overview
The Europe Agricultural Biologicals Market is fragmented, with the top five companies occupying 2.19%. The major players in this market are Agronutrition, Biolchim SpA, Koppert Biological Systems Inc., Symborg Inc. and Trade Corporation International (sorted alphabetically).
Additional Benefits:
- The market estimate (ME) sheet in Excel format
- 3 months of analyst support
TABLE OF CONTENTS
1 EXECUTIVE SUMMARY & KEY FINDINGS
2 REPORT OFFERS
3 INTRODUCTION
- 3.1 Study Assumptions & Market Definition
- 3.2 Scope of the Study
- 3.3 Research Methodology
4 KEY INDUSTRY TRENDS
- 4.1 Area Under Organic Cultivation
- 4.2 Per Capita Spending On Organic Products
- 4.3 Regulatory Framework
- 4.3.1 France
- 4.3.2 Germany
- 4.3.3 Italy
- 4.3.4 Netherlands
- 4.3.5 Russia
- 4.3.6 Spain
- 4.3.7 Turkey
- 4.3.8 United Kingdom
- 4.4 Value Chain & Distribution Channel Analysis
5 MARKET SEGMENTATION (includes market size in Value in USD and Volume, Forecasts up to 2030 and analysis of growth prospects)
- 5.1 Function
- 5.1.1 Crop Nutrition
- 5.1.1.1 Biofertilizer
- 5.1.1.1.1 Azospirillum
- 5.1.1.1.2 Azotobacter
- 5.1.1.1.3 Mycorrhiza
- 5.1.1.1.4 Phosphate Solubilizing Bacteria
- 5.1.1.1.5 Rhizobium
- 5.1.1.1.6 Other Biofertilizers
- 5.1.1.2 Biostimulants
- 5.1.1.2.1 Amino Acids
- 5.1.1.2.2 Fulvic Acid
- 5.1.1.2.3 Humic Acid
- 5.1.1.2.4 Protein Hydrolysates
- 5.1.1.2.5 Seaweed Extracts
- 5.1.1.2.6 Other Biostimulants
- 5.1.1.3 Organic Fertilizer
- 5.1.1.3.1 Manure
- 5.1.1.3.2 Meal Based Fertilizers
- 5.1.1.3.3 Oilcakes
- 5.1.1.3.4 Other Organic Fertilizers
- 5.1.2 Crop Protection
- 5.1.2.1 Biocontrol Agents
- 5.1.2.1.1 Macrobials
- 5.1.2.1.2 Microbials
- 5.1.2.2 Biopesticides
- 5.1.2.2.1 Biofungicides
- 5.1.2.2.2 Bioherbicides
- 5.1.2.2.3 Bioinsecticides
- 5.1.2.2.4 Other Biopesticides
- 5.1.1 Crop Nutrition
- 5.2 Crop Type
- 5.2.1 Cash Crops
- 5.2.2 Horticultural Crops
- 5.2.3 Row Crops
- 5.3 Country
- 5.3.1 France
- 5.3.2 Germany
- 5.3.3 Italy
- 5.3.4 Netherlands
- 5.3.5 Russia
- 5.3.6 Spain
- 5.3.7 Turkey
- 5.3.8 United Kingdom
- 5.3.9 Rest of Europe
6 COMPETITIVE LANDSCAPE
- 6.1 Key Strategic Moves
- 6.2 Market Share Analysis
- 6.3 Company Landscape
- 6.4 Company Profiles (includes Global Level Overview, Market Level Overview, Core Business Segments, Financials, Headcount, Key Information, Market Rank, Market Share, Products and Services, and Analysis of Recent Developments).
- 6.4.1 Agronutrition
- 6.4.2 Andermatt Group AG
- 6.4.3 Atlantica Agricola
- 6.4.4 Biolchim SpA
- 6.4.5 Bionema
- 6.4.6 Koppert Biological Systems Inc.
- 6.4.7 Lallemand Inc.
- 6.4.8 Sustane Natural Fertilizer, Inc
- 6.4.9 Symborg Inc.
- 6.4.10 Trade Corporation International
7 KEY STRATEGIC QUESTIONS FOR AGRICULTURAL BIOLOGICALS CEOS
8 APPENDIX
- 8.1 Global Overview
- 8.1.1 Overview
- 8.1.2 Porter's Five Forces Framework
- 8.1.3 Global Value Chain Analysis
- 8.1.4 Market Dynamics (DROs)
- 8.2 Sources & References
- 8.3 List of Tables & Figures
- 8.4 Primary Insights
- 8.5 Data Pack
- 8.6 Glossary of Terms
 農業生技藥品市場-2025-2030年預測
 全球農業生技藥品市場按類型、來源、配方、應用方式、作物類型和地區分類-預測至2030年
 農業生技藥品市場預測至2032年:按產品類型、來源、作物類型、應用方法和地區分類的全球分析
 農業生物製藥市場:按產品類型、應用、供應源類型、配方類型、作物類型、功能、最終用戶和分銷管道 - 2025-2030 年全球預測
 2025年全球農業生技藥品市場報告
 農業生技藥品市場分析及預測(至2034年):類型、產品、服務、技術、組件、應用、形式、最終用戶、安裝類型、設備
 日本農業生物製品市場報告(按類型、來源、應用模式、應用和地區)2025-2033全球農業生物製品市場研究報告-產業分析、規模、佔有率、成長、趨勢及2025年至2033年預測
 中國農業生技藥品:市場佔有率分析、產業趨勢與統計、成長預測(2025-2030年)亞太農業生技藥品-市場佔有率分析、產業趨勢與成長預測(2025-2030年)