


 |
市場調查報告書
商品編碼
1693769
亞太農業生技藥品-市場佔有率分析、產業趨勢與成長預測(2025-2030年)Asia-Pacific Agricultural Biologicals - Market Share Analysis, Industry Trends & Statistics, Growth Forecasts (2025 - 2030) |
||||||
※ 本網頁內容可能與最新版本有所差異。詳細情況請與我們聯繫。
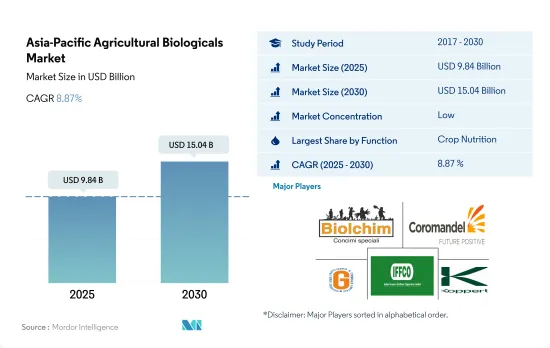
亞太地區農業生技藥品市場規模預計在 2025 年為 98.4 億美元,預計到 2030 年將達到 150.4 億美元,預測期內(2025-2030 年)的複合年成長率為 8.87%。
- 在亞太地區,農業生技藥品在永續農業中發揮關鍵作用。這些產品透過提供必要的營養和控制作物害蟲和昆蟲來減少化學肥料和殺蟲劑的使用。該地區的農業生技藥品市場正與前一年同期比較成長。 2017年至2022年,市場規模的複合年成長率為2.2%。
- 亞太地區對生物解決方案的需求主要受到歐盟等出口市場的推動,歐盟正在加強對某些傳統農藥使用的監管,以及當地消費者和客戶對更永續種植食品的需求。因此,越來越多的生產商開始尋求替代解決方案。最有前景的部分是新鮮食用的高價值水果和蔬菜(如漿果和葡萄)和溫室種植的作物。
- 亞太行動網路(PANAP)是農藥行動網路五個區域中心之一,致力於開展有關農藥對人類和環境有害影響的意識提升宣傳活動,並推廣基於生物多樣性的生態農業。
- 中國、印度、澳洲和印尼等國家都已採用有機農業戰略。中國和印度是該地區農業生技藥品市場的領先國家,分別佔50.5%和32.6%的佔有率。這些國家已經採取各種舉措,大力鼓勵有機農業和農業生技藥品的使用。例如,中國計劃將作物和連續作物的農藥使用量分別減少10%和5%。在印度,PKVY 和 MOVCDNER 等多項措施為農民提供財政援助,以購買用於有機農業的農業生技藥品。
- 亞太地區是世界領先的有機農業生產地區之一。米、甘蔗、新鮮水果和蔬菜是該地區種植的主要有機作物。中國和印度是該地區主要的有機作物生產國,也是最大的有機產品消費市場。
- 2017年至2022年間,該地區的有機農業面積將大幅增加,從2017年的310萬公頃增加到2022年的380萬公頃。該地區的生技藥品市場在過去一段時間內成長了10.1%,預計在預測期內將成長約65.1%,到2029年將達到138.1億美元。
- 依國家分類,2022年中國分別佔亞太農業生技藥品市場的50.5%及78.6%。印度以32.6%的佔有率位居第二,而同年亞太其他地區佔亞太地區生技藥品市場總量的5.9%。
- 2022年,亞太地區連續作物消耗的生物肥料較多,佔總市場價值的80.1%。這是因為田間作物是該地區許多國家的穩定食物來源,因此種植面積巨大。其次是經濟作物(10.9%)和園藝作物(8.3%)。
- 作物種植面積不斷增加以及對有機產品和肥料的需求不斷成長,導致化學肥料使用量整體減少。預計作物生產的總體成本和政府鼓勵有機農業的努力將在 2023 年至 2029 年期間推動亞太生技藥品市場的發展。
亞太農業生技藥品市場趨勢
中國、印度、印尼和澳洲等國政府的支持日益增強,有助於推動該地區的有機農業
- 根據FiBL統計,2021年亞太地區有機農地面積將超過370萬公頃,佔全球有機農地面積的26.4%。此外,2017 年至 2022 年間,有機種植面積預計將增加 19.3%。截至 2020 年,該地區的有機生產者數量約為 183 萬,其中印度以 130 萬位居榜首。中國、印度、印尼和澳洲是該地區有機種植面積最大的國家。中國和印度等國家的政府部門正在不斷推廣有機農業,以減少作物種植對化學投入的依賴。例如,印度實施了「Paramparagat Krishi Vikas Yojana」和「全印度有機農業網路計畫」(AI-NPOF)等計畫。
- 2021年,中國佔最大佔有率,為250萬公頃,佔66.1%,其次是印度,佔19.3%,印度尼西亞,佔1.5%,澳大利亞,佔1.4%。所有有機農場種植的作物分為三類:連續作物、園藝作物、經濟作物。該地區有機農地大部分為連作作物,2021 年達 250 萬公頃,佔 67.5%。該地區主要連作作物包括水稻、小麥、豆類、大豆和小米。
- 經濟作物將佔據第二大佔有率,到2021年將達到70萬公頃,佔有機農地的18.5%。全球對糖和有機茶等有機經濟作物的需求正在增加。在全球範圍內,中國和印度分別是最大的有機綠茶和有機紅茶生產國。由於國際需求不斷成長,該地區有機種植面積預計會增加。
澳洲是迄今為止人均有機產品支出最高的國家,而中國的有機食品市場正在大幅成長。
- 印度的有機產品遠遠落後於全球需求的 1.0%,2021 年的人均支出僅 0.08 美元。然而,隨著人們越來越意識到食用有機食品的好處,以及對茶和有機果汁等有機產品的需求不斷成長,印度將成為未來幾年的潛在市場。預計到 2025 年將達到 1.533 億美元。目前,該地區的有機市場高度分散,有機產品僅在少數超級市場和專賣店有售。
- 中國持續維持高於地區和全球平均的有機成長,2021 年成長 13.3%。預計這種正成長模式將持續下去,2023 年至 2029 年的平均複合年成長率為 7.1%。
- 預計有機產品將在中國經歷強勁成長,2023 年至 2029 年期間的複合年成長率為 7.1%,到 2025 年總合將達到 64 億美元。推動這一成長的因素包括年輕一代越來越重視有機產品,越來越多的職業母親對有機嬰兒食品的需求不斷成長,以及人們越來越接受健康和保健趨勢。預計消費者知識和購買意願的提高將使人們更加了解該地區有機食品的永續屬性。人均收入的增加,加上消費者對消費有機食品重要性的認知不斷提高,有可能增加亞太地區人均有機食品支出。
亞太農業生技藥品產業概覽
亞太農業生技藥品市場細分化,前五大公司佔6.21%。市場的主要企業包括 Biolchim SpA、Coromandel International Ltd、Gujarat State Fertilizers & Chemicals Ltd、Indian Farmers Fertiliser Cooperative Limited、Koppert Biological Systems Inc. 等。
其他福利
- Excel 格式的市場預測 (ME) 表
- 3個月的分析師支持
目錄
第1章執行摘要和主要發現
第2章 報告要約
第3章 引言
- 研究假設和市場定義
- 研究範圍
- 調查方法
第4章 產業主要趨勢
- 有機種植區
- 有機產品人均支出
- 法律規範
- 澳洲
- 中國
- 印度
- 印尼
- 日本
- 菲律賓
- 泰國
- 越南
- 價值鍊和通路分析
第5章市場區隔
- 功能
- 作物營養
- 生物肥料
- 固氮螺菌
- 固氮菌
- 菌根真菌
- 解磷細菌
- 根瘤菌
- 其他生物肥料
- 生物肥料
- 胺基酸
- 富裡酸
- 腐植酸
- 蛋白質水解物
- 海藻萃取物
- 其他生物刺激素
- 有機肥
- 肥料
- 餐食基肥料
- 油餅
- 其他有機肥料
- 作物保護
- 生物防治劑
- 大型微生物
- 微生物
- 生物防治劑
- 生物真菌劑
- 生物除草劑
- 生物殺蟲劑
- 其他生物防治劑
- 作物營養
- 作物類型
- 經濟作物
- 園藝作物
- 耕地作物
- 原產地
- 澳洲
- 中國
- 印度
- 印尼
- 日本
- 菲律賓
- 泰國
- 越南
- 其他亞太地區
第6章競爭格局
- 關鍵策略趨勢
- 市場佔有率分析
- 商業狀況
- 公司簡介
- Biolchim SpA
- Coromandel International Ltd
- Genliduo Bio-tech Corporation Ltd
- Gujarat State Fertilizers & Chemicals Ltd
- Indian Farmers Fertiliser Cooperative Limited
- Koppert Biological Systems Inc.
- Novozymes
- Sustane Natural Fertilizer Inc.
- Valagro
- Valent Biosciences LLC
第7章:CEO面臨的關鍵策略問題
第 8 章 附錄
- 世界概況
- 概述
- 五力分析框架
- 全球價值鏈分析
- 市場動態(DRO)
- 資訊來源及延伸閱讀
- 圖片列表
- 關鍵見解
- 數據包
- 詞彙表
The Asia-Pacific Agricultural Biologicals Market size is estimated at 9.84 billion USD in 2025, and is expected to reach 15.04 billion USD by 2030, growing at a CAGR of 8.87% during the forecast period (2025-2030).
- In the Asia-Pacific region, agricultural biologicals play a key role in sustainable agriculture. These products reduce the use of chemical fertilizers and pesticides by providing required nutrients and controlling pests and insects in crops. The agricultural biologicals market in the region is growing Y-o-Y. From 2017 to 2022, the market value grew by a CAGR of 2.2%.
- The demand for biological solutions in Asia-Pacific is being driven primarily by export markets such as the European Union, which is tightening regulations on the use of some conventional pesticides and local consumer and customer demand for more sustainably grown food. Thus, more growers are showing a growing interest in alternative solutions. The most promising segments are high-value fruits and vegetables (e.g., berries and grapes) eaten fresh and crops grown in greenhouses.
- PAN Asia Pacific (PANAP), one of five regional centers of the Pesticide Action Network, is creating an awareness campaign regarding the harmful effects of pesticides on humans and the environment and promoting biodiversity-based ecological agriculture.
- Countries such as China, India, Australia, and Indonesia are adopting organic farming strategies. China and India are the major countries holding shares of 50.5% and 32.6%, respectively, of the agricultural biologicals market in the region. These countries are implementing different initiatives to encourage organic farming and agricultural biologicals usage widely. For instance, China is planning to reduce 10% and 5% pesticide usage in horticultural crops and row crops, respectively. India, through many initiatives like PKVY and MOVCDNER, provides financial support to farmers to buy agricultural biologicals for organic farming.
- The Asia-Pacific region is one of the world's major organic producers. Rice, sugarcane, and fresh fruits and vegetables are among the major organic crops cultivated in the region. China and India are the region's main organic crop producers and have the highest organic product consumption markets.
- The area of the region that was organically farmed increased significantly between 2017 and 2022, rising from 3.1 million hectares in 2017 to 3.8 million hectares in 2022. The region's biologicals market increased by 10.1% during the historical period and is expected to increase by about 65.1% over the forecast period, reaching USD 13.81 billion by 2029.
- As an individual country, China dominated the Asia-Pacific agricultural biologicals market in 2022 by 50.5% of the market value and 78.6% of the market volume. India occupied second place with 32.6%, and the Rest of Asia-Pacific held 5.9% of the total Asia-Pacific biologicals market values the same year.
- In 2022, row crops in the Asia-Pacific region consumed more biological fertilizers, accounting for 80.1% of the total market value. This is due to the region's huge area under cultivation of field crops, as they are the stable food in many countries in the region. This is followed by cash crops and horticultural crops, which had 10.9% and 8.3% shares, respectively, in the same year.
- The rising trend in organic crop areas and the rising demand for organic products and organic fertilizers reduce overall chemical fertilizer use. The overall cost of crop production and government attempts to encourage organic farming are expected to drive the Asia-Pacific biologicals market between 2023 and 2029.
Asia-Pacific Agricultural Biologicals Market Trends
Growing government support in countries like China, India, Indonesia, and Australia, boosts organic farming in the region
- The area under organic agricultural land in the Asia-Pacific region was over 3.7 million hectares in 2021, representing 26.4% of the global organic area, as per FiBL statistics. Moreover, the organic area under cultivation witnessed a growth of 19.3% between 2017-2022. As of 2020, the region recorded around 1.83 million organic producers, with India topping the list with 1.3 million organic producers. China, India, Indonesia, and Australia are the major countries with large organic cultivation areas in the region. Government authorities in countries such as China and India constantly promote organic agriculture to reduce reliance on chemical inputs for crop cultivation. For instance, India has implemented schemes such as Paramparagat Krishi Vikas Yojana and the All India Network Programme on Organic Farming (AI-NPOF).
- In 2021, China accounted for the maximum share of 66.1% with 2.5 million hectares, followed by India, Indonesia, and Australia with 19.3%, 1.5%, and 1.4% shares, respectively. The crops grown in the total organic land can be divided into three types, namely row crops, horticultural crops, and cash crops. Row crops occupy a major share of organic agricultural land in the region, which accounted for a 67.5% share with 2.5 million hectares in 2021. The major row crops grown in the region include paddy, wheat, pulses, soybeans, and millets.
- Cash crops held the second largest share, with 0.7 million hectares in 2021, accounting for an 18.5% share of organic cropland. The demand for organic cash crops, such as sugar and organic tea, is increasing globally. Globally, China and India are the largest organic green and black tea producers, respectively. The growing international demand is expected to increase the organic acreages in the region.
Per capita spending on organic product predominant in Australia and China's organic food market growing significantly
- Organic products in India represent far less than 1.0% of the global value demand, with a per capita expenditure of just USD 0.08 in 2021. However, with people becoming more aware of the benefits of consuming organic food and the growth in demand for organic products in categories such as tea and organic juice, India represents a potential market over the coming years. It is expected to reach a value of USD 153.3 million by 2025. Currently, the market for organic goods in the region is very fragmented, with just a few supermarkets and specialty stores selling them, as only people from higher-income families are possible customers.
- China continues to show organic growth above the regional and global averages, posting a 13.3% expansion in 2021. A positive growth pattern is expected to continue, with China averaging a CAGR of 7.1% between 2023 and 2029.
- Organic products are anticipated to experience strong growth in China, registering a value CAGR of 7.1% between 2023 and 2029 and reaching a total of USD 6.4 billion by 2025. This growth can be attributed to an increasing emphasis on the importance of organic products among the younger generation, a rise in demand for organic baby food due to the growing number of mothers in the workforce, and the increasing adoption of the health and wellness trend. Growing consumer knowledge and buying motivations are expected to lead to a better understanding of the sustainable qualities of organic food in the region. Increased per capita income, along with increased consumer awareness of the importance of organic food intake, has the potential to raise per capita expenditure on organic food items in the Asia-Pacific region.
Asia-Pacific Agricultural Biologicals Industry Overview
The Asia-Pacific Agricultural Biologicals Market is fragmented, with the top five companies occupying 6.21%. The major players in this market are Biolchim SpA, Coromandel International Ltd, Gujarat State Fertilizers & Chemicals Ltd, Indian Farmers Fertiliser Cooperative Limited and Koppert Biological Systems Inc. (sorted alphabetically).
Additional Benefits:
- The market estimate (ME) sheet in Excel format
- 3 months of analyst support
TABLE OF CONTENTS
1 EXECUTIVE SUMMARY & KEY FINDINGS
2 REPORT OFFERS
3 INTRODUCTION
- 3.1 Study Assumptions & Market Definition
- 3.2 Scope of the Study
- 3.3 Research Methodology
4 KEY INDUSTRY TRENDS
- 4.1 Area Under Organic Cultivation
- 4.2 Per Capita Spending On Organic Products
- 4.3 Regulatory Framework
- 4.3.1 Australia
- 4.3.2 China
- 4.3.3 India
- 4.3.4 Indonesia
- 4.3.5 Japan
- 4.3.6 Philippines
- 4.3.7 Thailand
- 4.3.8 Vietnam
- 4.4 Value Chain & Distribution Channel Analysis
5 MARKET SEGMENTATION (includes market size in Value in USD and Volume, Forecasts up to 2030 and analysis of growth prospects)
- 5.1 Function
- 5.1.1 Crop Nutrition
- 5.1.1.1 Biofertilizer
- 5.1.1.1.1 Azospirillum
- 5.1.1.1.2 Azotobacter
- 5.1.1.1.3 Mycorrhiza
- 5.1.1.1.4 Phosphate Solubilizing Bacteria
- 5.1.1.1.5 Rhizobium
- 5.1.1.1.6 Other Biofertilizers
- 5.1.1.2 Biostimulants
- 5.1.1.2.1 Amino Acids
- 5.1.1.2.2 Fulvic Acid
- 5.1.1.2.3 Humic Acid
- 5.1.1.2.4 Protein Hydrolysates
- 5.1.1.2.5 Seaweed Extracts
- 5.1.1.2.6 Other Biostimulants
- 5.1.1.3 Organic Fertilizer
- 5.1.1.3.1 Manure
- 5.1.1.3.2 Meal Based Fertilizers
- 5.1.1.3.3 Oilcakes
- 5.1.1.3.4 Other Organic Fertilizers
- 5.1.2 Crop Protection
- 5.1.2.1 Biocontrol Agents
- 5.1.2.1.1 Macrobials
- 5.1.2.1.2 Microbials
- 5.1.2.2 Biopesticides
- 5.1.2.2.1 Biofungicides
- 5.1.2.2.2 Bioherbicides
- 5.1.2.2.3 Bioinsecticides
- 5.1.2.2.4 Other Biopesticides
- 5.1.1 Crop Nutrition
- 5.2 Crop Type
- 5.2.1 Cash Crops
- 5.2.2 Horticultural Crops
- 5.2.3 Row Crops
- 5.3 Country
- 5.3.1 Australia
- 5.3.2 China
- 5.3.3 India
- 5.3.4 Indonesia
- 5.3.5 Japan
- 5.3.6 Philippines
- 5.3.7 Thailand
- 5.3.8 Vietnam
- 5.3.9 Rest of Asia-Pacific
6 COMPETITIVE LANDSCAPE
- 6.1 Key Strategic Moves
- 6.2 Market Share Analysis
- 6.3 Company Landscape
- 6.4 Company Profiles (includes Global Level Overview, Market Level Overview, Core Business Segments, Financials, Headcount, Key Information, Market Rank, Market Share, Products and Services, and Analysis of Recent Developments).
- 6.4.1 Biolchim SpA
- 6.4.2 Coromandel International Ltd
- 6.4.3 Genliduo Bio-tech Corporation Ltd
- 6.4.4 Gujarat State Fertilizers & Chemicals Ltd
- 6.4.5 Indian Farmers Fertiliser Cooperative Limited
- 6.4.6 Koppert Biological Systems Inc.
- 6.4.7 Novozymes
- 6.4.8 Sustane Natural Fertilizer Inc.
- 6.4.9 Valagro
- 6.4.10 Valent Biosciences LLC
7 KEY STRATEGIC QUESTIONS FOR AGRICULTURAL BIOLOGICALS CEOS
8 APPENDIX
- 8.1 Global Overview
- 8.1.1 Overview
- 8.1.2 Porter's Five Forces Framework
- 8.1.3 Global Value Chain Analysis
- 8.1.4 Market Dynamics (DROs)
- 8.2 Sources & References
- 8.3 List of Tables & Figures
- 8.4 Primary Insights
- 8.5 Data Pack
- 8.6 Glossary of Terms
 農業生技藥品市場規模、佔有率和成長分析(按類型、來源、應用、作物類型和地區分類)-2026-2033年產業預測
 農業生技藥品市場規模、佔有率和成長分析(按類型、來源、應用、作物類型和地區分類)-2026-2033年產業預測
 農業生技藥品市場-2025-2030年預測
 全球農業生技藥品市場按類型、來源、配方、應用方式、作物類型和地區分類-預測至2030年
 農業生技藥品市場預測至2032年:按產品類型、來源、作物類型、應用方法和地區分類的全球分析
 農業生物製藥市場:按產品類型、應用、供應源類型、配方類型、作物類型、功能、最終用戶和分銷管道 - 2025-2030 年全球預測
 2025年全球農業生技藥品市場報告
 農業生技藥品市場分析及預測(至2034年):類型、產品、服務、技術、組件、應用、形式、最終用戶、安裝類型、設備
 日本農業生物製品市場報告(按類型、來源、應用模式、應用和地區)2025-2033全球農業生物製品市場研究報告-產業分析、規模、佔有率、成長、趨勢及2025年至2033年預測