


 |
市場調查報告書
商品編碼
1693672
北美乾混砂漿:市場佔有率分析、行業趨勢和成長預測(2025-2030 年)North America Dry Mix Mortar - Market Share Analysis, Industry Trends & Statistics, Growth Forecasts (2025 - 2030) |
||||||
價格
※ 本網頁內容可能與最新版本有所差異。詳細情況請與我們聯繫。
簡介目錄
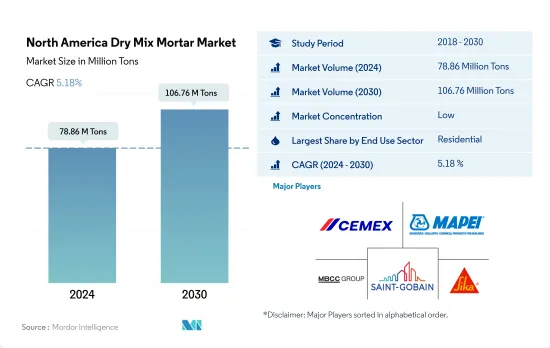
北美乾混砂漿市場規模預計在 2024 年為 7,886 萬噸,預計到 2030 年將達到 1.0676 億噸,預測期內(2024-2030 年)的複合年成長率為 5.18%。
預計美國工業建築領域即將建成的製造設施將推動乾混砂漿的需求。
- 乾混砂漿在住宅和商業建築計劃中都發揮著至關重要的作用。它廣泛用於石灰外牆、水泥漿、磁磚黏合劑和接縫填料等應用。 2022年,北美佔據全球乾混砂漿市場的大部分佔有率,約佔23%。根據地方政府旨在加強建築業的舉措,預計 2023 年市場將增加 350 萬噸。
- 2022年,住宅領域將成為乾混砂漿市場的主導力量,產量達4,350萬噸。預計這一趨勢將持續到 2023 年,優惠的房屋抵押貸款利率和政府支持的經濟適用住宅計劃將推動對住宅的需求。具體而言,2023 年的預測顯示,住宅占地面積預計將增加 1.32 億平方英尺,住宅建築中使用的乾混砂漿量將增加 3.94%。
- 在各個建築領域中,工業部門預計將以最高速度成長,預測期內預計複合年成長率為 7.51%。特別是在美國,隨著製造設施的建設,預計需求將激增。需求成長是由於政府的舉措,如《基礎設施投資和就業法案》(IIJA)、《通貨膨脹控制法案》(IRA)和《住房基礎設施投資保護法》(CHIPS),這些舉措為私人和公共建設活動提供稅收優惠和直接資金。
預計快速成長的墨西哥住宅和商業建築業將推動北美對乾混砂漿的需求。
- 乾混砂漿由波特蘭水泥、混合均勻的砂漿砂和精選外加劑的特殊混合物組成。它廣泛用於水泥漿、灰泥、抹灰等。 2022 年,北美乾混砂漿市場規模與 2021 年相比成長了 5.95%,而墨西哥和美國等國家分別錄得 20.7% 和 4.06% 的成長率。 2023 年,北美乾混砂漿市場以金額為準預計將比 2022 年成長 4.95%,這主要得益於住宅、商業、基礎設施和工業領域的大型建設計劃。
- 2022年,美國佔據乾混砂漿的大部分佔有率,為5,340萬噸。推動這一成長的是,美國建築業吸引了17,929億美元的投資,比2021年成長10.2%,其中住宅、土木工程和非住宅計劃占主導地位。預計2022年美國乾混砂漿市場將成長4.06%,2023年將成長5.19%。
- 預計墨西哥乾混砂漿市場將以 6.84% 的複合年成長率成長,在數量方面超過北美市場。受世界銀行集團計畫支持的經濟適用住宅推動,該國住宅建設正在激增。此外,由於美國-墨西哥-加拿大協議(USMCA)以及與中國日益緊張的關係等因素改變了供應鏈動態,墨西哥的倉庫和倉儲設施建設正在增加,進一步推動了對乾混砂漿的需求。
北美乾混砂漿市場趨勢
美國和其他主要國家的商業設施建設計劃可能會推動商業房地產的成長。
- 在北美,2022 年新增商業占地面積較 2021 年增加了 4%,這主要是由於加拿大和墨西哥同期的成長率分別約為 7% 和 24%。由於在家工作趨勢的下降以及隨著企業在全部區域的擴張而對市中心的需求增加,預計 2023 年該行業的新占地面積將比 2022 年成長約 6%。
- 由於新冠疫情及其影響(包括供應鏈中斷和經濟不確定性),該行業在 2020-2021 年遭受了顯著損失。因此,2020年和2021年新占地面積分別與前一年同期比較下降12.96%和8.39%。加拿大是該產業受影響最嚴重的國家,2020 年該國新建占地面積較去年與前一年同期比較下降 25.05%。
- 就規模而言,商業領域新增占地面積預計在預測期內(2023-2030 年)的複合年成長率為 4%,這主要歸因於美國等主要國家即將開展的商業建設活動。例如,103 街和安提阿路的混合用途重建項目、EllIoT 和 Sossaman 路資料中心、門羅街區混合用途開發項目以及伍德賽德廣場的重建項目都是預計將於 2023 年在全國各地啟動的一些大型商業計劃。據估計,該產業在墨西哥的成長最快,預計 2030 年新增占地面積將達到 1.92 億平方英尺,而 2022 年為 1.36 億平方英尺。
受收入成長、低利率和新居住者湧入的推動,加拿大預計將引領北美住宅產業的成長。
- 2022年,儘管住宅飆升,但北美住宅新占地面積仍成長5.03%。值得注意的是,到 2022 年初,美國房屋抵押貸款利率已從 3.2% 飆升至 7.5% 左右。預計 2023 年這一飆升趨勢將持續,新建占地面積將成長 3.45%。據估計,到 2023 年 5 月,美國將建造 163 萬套住宅,較 2022 年 4 月以來建造的 180 萬套大幅成長。
- 2020年,該地區的住宅產業遭遇挫折,新建占地面積減少了9,000萬平方英尺,這主要是由於新冠疫情的不利影響。這些干擾包括關閉、流動性限制和新建築需求減少。例如,2020 年加拿大新建住宅中多用戶住宅數量急劇下降了 51.9%。然而,隨著2021年經濟從疫情的影響中復甦,該產業也出現復甦,新增占地面積增加了2.89億平方英尺。其中,美國和加拿大新建住宅占地面積分別成長14.5%和19.7%。
- 就建築面積而言,該地區新建占地面積預計在 2023 年至 2030 年期間的複合年成長率為 3.67%。由於收入增加、利率較低以及新居住者(主要是千禧世代和 Z 世代)的湧入,組建家庭並尋求擁有住房,預計加拿大將引領這一成長。
北美乾混砂漿產業概況
北美乾混砂漿市場分散,前五大公司佔11.20%的市佔率。該市場的主要企業包括 CEMEX、SAB de CV、MAPEI SpA、MBCC Group、Saint-Gobain、Sika AG 等。
其他福利
- Excel 格式的市場預測 (ME) 表
- 3個月的分析師支持
目錄
第1章執行摘要和主要發現
第2章 報告要約
第3章 引言
- 研究假設和市場定義
- 研究範圍
- 調查方法
第4章 產業主要趨勢
- 最終用途細分趨勢
- 商業的
- 工業/設施
- 基礎設施
- 住宅
- 重大基礎設施計劃(目前和已宣布)
- 法律規範
- 價值鍊和通路分析
第5章市場區隔
- 最終用途部分
- 商業的
- 工業/設施
- 基礎設施
- 住宅
- 應用
- 混凝土保護與維修
- 水泥漿
- 絕緣和飾面系統
- 石膏
- 使成為
- 磁磚膠
- 防水漿料
- 其他
- 國家
- 加拿大
- 墨西哥
- 美國
第6章競爭格局
- 關鍵策略趨勢
- 市場佔有率分析
- 商業狀況
- 公司簡介
- Ardex Group
- Cementos Moctezuma
- CEMEX, SAB de CV
- CRH
- FORTALEZA MATERIALES, SAB DE CV
- LATICRETE International, Inc.
- MAPEI SpA
- MBCC Group
- Saint-Gobain
- Sika AG
第7章:CEO面臨的關鍵策略問題
第 8 章 附錄
- 世界概況
- 概述
- 五力分析框架(產業吸引力分析)
- 全球價值鏈分析
- 市場動態(DRO)
- 資訊來源及延伸閱讀
- 圖片列表
- 關鍵見解
- 數據包
- 詞彙表
簡介目錄
Product Code: 93228
The North America Dry Mix Mortar Market size is estimated at 78.86 million Tons in 2024, and is expected to reach 106.76 million Tons by 2030, growing at a CAGR of 5.18% during the forecast period (2024-2030).
Upcoming manufacturing facilities in the US industrial construction sector are expected to drive the demand for dry-mix mortar
- Dry-mix mortar plays a pivotal role in both residential and commercial building projects. It finds extensive use in applications like stucco, grouts, tile adhesives, and joint fillers. In 2022, North America held a significant share of approximately 23% of the global dry-mix mortar market. In 2023, the market was projected to witness a growth of 3.5 million tons, driven by the initiatives of the regional governments aimed at bolstering the construction sector.
- In 2022, the residential segment emerged as the dominant force in the dry-mix mortar market, accounting for a substantial 43.5 million tons. The trend was set to continue in 2023, with factors such as favorable mortgage rates and government-backed affordable housing schemes fueling demand for new residential units. Notably, the forecast for 2023 indicated a projected increase of 132 million square feet in residential floor area, driving a 3.94% growth in the volume of dry-mix mortar used in residential construction.
- Among various construction segments, the industrial sector is poised for the highest growth rate, with a projected CAGR of 7.51% in volume during the forecast period. The United States, in particular, is expected to witness a surge in demand driven by a wave of manufacturing facility construction. This uptick can be attributed to government initiatives like the Infrastructure Investment and Jobs Act (IIJA), Inflation Reduction Act (IRA), and CHIPS Act, which offer tax incentives and direct funding for both private and public construction endeavors.
Mexico's fastest-growing residential and commercial construction sectors are predicted to bolster the demand for dry-mix mortar in North America
- Dry-mix mortar comprises a special blend of Portland cement, well-graded mortar sand, and selected admixtures. It is widely used in grouts, plasters, renders, etc. In 2022, the North American dry-mix mortar market grew by 5.95% in volume compared to 2021, with countries like Mexico and the United States recording growth rates of 20.7% and 4.06%, respectively. In 2023, the North American dry-mix mortar market was estimated to grow by 4.95% in value compared to 2022, owing to large-scale construction projects spread across the residential, commercial, infrastructure, and industrial sectors.
- In 2022, the United States dominated the dry-mix mortar landscape, accounting for a sizable 53.4 million tons. Bolstering this growth, the US construction sector attracted investments totaling USD 1792.9 billion, a 10.2% surge from 2021, with a focus on residential, civil engineering, and non-residential projects. This surge in construction fueled a 4.06% uptick in the US dry-mix mortar market in 2022, and the sector was poised to expand by 5.19% in volume in 2023.
- With a projected CAGR of 6.84% in volume, the Mexican dry-mix mortar market is expected to outpace its North American counterparts. The country's push for affordable housing, supported by programs from the World Bank Group, is expected to drive a surge in residential construction. Additionally, as supply chain dynamics shift due to factors like the United States-Mexico-Canada Agreement (USMCA) and heightened tensions with China, Mexico is witnessing an uptick in warehouse and storage facility construction, further bolstering its dry-mix mortar demand.
North America Dry Mix Mortar Market Trends
Upcoming commercial construction in leading economies, such as the United States, may propel the growth of commercial construction
- In North America, the new floor area construction in the commercial sector was 4% higher in 2022 compared to 2021, primarily due to Canada and Mexico, which recorded growth rates of about 7% and 24%, respectively, during the same period. The new floor area construction of the sector was estimated to increase by around 6% in 2023 compared to 2022 due to the growth in demand for commercial spaces as the work-from-home trend declined and businesses expanded across the region.
- The sector witnessed noticeable losses during 2020 and 2021 because of the COVID-19 pandemic and its impact, such as disruptions in supply chains and economic uncertainty. As a result, the new floor area constructions in 2020 and 2021 declined by 12.96% and 8.39% compared to their respective previous years. The sector was most affected in Canada in 2020, such that the new floor area construction declined by 25.05% over the previous year.
- The commercial sector's new floor area construction is expected to register a CAGR of 4% in terms of volume during the forecast period (2023-2030) due to upcoming commercial construction activities, primarily in leading economies such as the United States. For instance, 103rd Street and Antioch Road mixed-use redevelopment, Elliot and Sossaman Road data center, Monroe Block mixed-use complex, and Woodside Square redevelopment were some large commercial projects that were expected to commence in the country in 2023. The sector is estimated to witness the most growth in Mexico, with the new floor area construction estimated to reach 192 million sq. ft by 2030 compared to 136 million sq. ft in 2022.
Canada is expected to lead the residential sector's growth in North America, driven by rising incomes, low interest rates, and an influx of new residents
- In 2022, the residential sector in North America saw a 5.03% growth in new floor area construction despite soaring housing prices. Notably, mortgage rates in the United States surged from 3.2% to approximately 7.5% by early 2022. This surge was expected to persist in 2023, with new floor area construction rising by 3.45%. By May 2023, the United States was estimated to hit 1.63 million new home constructions, marking a significant surge from 1.8 million units since April 2022.
- In 2020, the region's residential sector faced a setback, witnessing a 90-million sq. ft drop in new floor area construction, primarily due to the negative impact of the COVID-19 pandemic. These disruptions included lockdowns, liquidity constraints, and a dampened demand for new buildings. For instance, in 2020, new residential construction in Canada saw a steep 51.9% decline in multi-family homebuilding. However, in 2021, with the economies recovering from the impact of the pandemic, the sector also rebounded, with a notable 289 million sq. ft increase in new floor area construction. Specifically, the United States and Canada saw volume growths of 14.5% and 19.7%, respectively, in new residential construction.
- The region's new floor area construction is projected to witness a CAGR of 3.67% in terms of volume from 2023 to 2030. Canada is expected to lead this growth, driven by rising incomes, low interest rates, and an influx of new residents, particularly millennials and Gen Z, who are forming their own households and seeking homeownership.
North America Dry Mix Mortar Industry Overview
The North America Dry Mix Mortar Market is fragmented, with the top five companies occupying 11.20%. The major players in this market are CEMEX, S.A.B. de C.V., MAPEI S.p.A., MBCC Group, Saint-Gobain and Sika AG (sorted alphabetically).
Additional Benefits:
- The market estimate (ME) sheet in Excel format
- 3 months of analyst support
TABLE OF CONTENTS
1 EXECUTIVE SUMMARY & KEY FINDINGS
2 REPORT OFFERS
3 INTRODUCTION
- 3.1 Study Assumptions & Market Definition
- 3.2 Scope of the Study
- 3.3 Research Methodology
4 KEY INDUSTRY TRENDS
- 4.1 End Use Sector Trends
- 4.1.1 Commercial
- 4.1.2 Industrial and Institutional
- 4.1.3 Infrastructure
- 4.1.4 Residential
- 4.2 Major Infrastructure Projects (current And Announced)
- 4.3 Regulatory Framework
- 4.4 Value Chain & Distribution Channel Analysis
5 MARKET SEGMENTATION (includes market size, forecasts up to 2030 and analysis of growth prospects.)
- 5.1 End Use Sector
- 5.1.1 Commercial
- 5.1.2 Industrial and Institutional
- 5.1.3 Infrastructure
- 5.1.4 Residential
- 5.2 Application
- 5.2.1 Concrete Protection and Renovation
- 5.2.2 Grouts
- 5.2.3 Insulation and Finishing Systems
- 5.2.4 Plaster
- 5.2.5 Render
- 5.2.6 Tile Adhesive
- 5.2.7 Water Proofing Slurries
- 5.2.8 Other Applications
- 5.3 Country
- 5.3.1 Canada
- 5.3.2 Mexico
- 5.3.3 United States
6 COMPETITIVE LANDSCAPE
- 6.1 Key Strategic Moves
- 6.2 Market Share Analysis
- 6.3 Company Landscape
- 6.4 Company Profiles
- 6.4.1 Ardex Group
- 6.4.2 Cementos Moctezuma
- 6.4.3 CEMEX, S.A.B. de C.V.
- 6.4.4 CRH
- 6.4.5 FORTALEZA MATERIALES, S.A.B. DE C.V
- 6.4.6 LATICRETE International, Inc.
- 6.4.7 MAPEI S.p.A.
- 6.4.8 MBCC Group
- 6.4.9 Saint-Gobain
- 6.4.10 Sika AG
7 KEY STRATEGIC QUESTIONS FOR CONCRETE, MORTARS AND CONSTRUCTION CHEMICALS CEOS
8 APPENDIX
- 8.1 Global Overview
- 8.1.1 Overview
- 8.1.2 Porter's Five Forces Framework (Industry Attractiveness Analysis)
- 8.1.3 Global Value Chain Analysis
- 8.1.4 Market Dynamics (DROs)
- 8.2 Sources & References
- 8.3 List of Tables & Figures
- 8.4 Primary Insights
- 8.5 Data Pack
- 8.6 Glossary of Terms
02-2729-4219
+886-2-2729-4219
 乾混砂漿:市場佔有率分析、產業趨勢與統計、成長預測(2026-2031)東協乾混砂漿:市佔率分析、產業趨勢與統計、成長預測(2026-2031)歐洲乾粉砂漿:市場佔有率分析、產業趨勢與統計、成長預測(2026-2031)
 2026年全球乾混砂漿添加劑和化學品市場報告
 塔式乾粉砂漿攪拌站市場按產品類型、攪拌能力、應用、最終用途和分銷管道分類-2026-2032年全球預測自流平砂漿添加劑市場按類型、形態、應用、終端用戶產業和分銷管道分類,全球預測,2026-2032年預拌建築砂漿市場(依產品類型、形態、包裝類型、應用、最終用途及通路分類)-2026-2032年全球預測
 乾混砂漿添加劑和化學品市場規模、佔有率和成長分析(按添加劑類型、化學品類型、應用、最終用戶和地區分類)—2026-2033年產業預測
 乾混砂漿市場規模、佔有率和成長分析(按產品類型、粘合劑類型、添加劑、最終用戶、技術、應用和地區分類)—產業預測(2026-2033 年)
 全球乾混砂漿市場:依產品種類、塑化劑種類、應用、黏結劑系統及地區劃分(至2032年)
▼