


 |
市場調查報告書
商品編碼
1693686
亞太地區乾混砂漿:市場佔有率分析、產業趨勢與統計、成長預測(2025-2030 年)Asia-Pacific Dry Mix Mortar - Market Share Analysis, Industry Trends & Statistics, Growth Forecasts (2025 - 2030) |
||||||
價格
※ 本網頁內容可能與最新版本有所差異。詳細情況請與我們聯繫。
簡介目錄
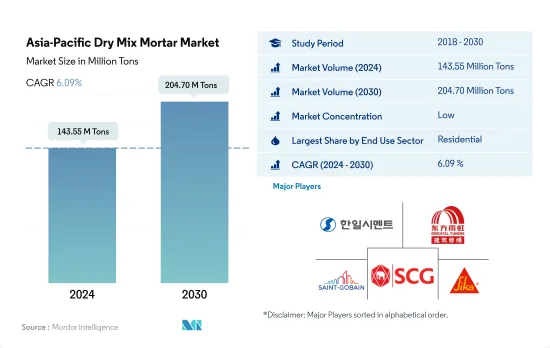
預計 2024 年亞太乾混砂漿市場規模為 1.4355 億噸,到 2030 年將達到 2.047 億噸,預測期內(2024-2030 年)的複合年成長率為 6.09%。
住宅需求成長可能推動乾混砂漿的成長
- 到2022年,亞太地區將主導全球乾混砂漿市場,佔40.73%的市場。 2023年,受商業和住宅建築領域需求成長的推動,該地區乾混砂漿消費量增加了4.07%。
- 2022年,亞太地區住宅領域成為乾混砂漿的主要消費領域,佔60.34%的市佔率。都市化加快、政府舉措以及國內外投資刺激了該地區的住宅需求。例如,印尼政府的目標是到2025年建造100萬套住宅,而該國的住宅總需求預計將達到3,000萬套。因此,預計住宅領域對乾混砂漿的需求將從 2023 年的 8,150 萬噸激增至 2030 年的 1.197 億噸。
- 預計亞太地區商業領域的乾混砂漿消費量量成長率最高,預測期內複合年成長率為 7.64%。預計購物中心、辦公空間和零售中心的成長將導致 2025 年商業占地面積與前一年同期比較增加 1.78 億平方英尺。例如,預計到 2026 年,印度前七大城市的甲級辦公室市場將擴大到 10 億平方英尺,到 2030 年將進一步擴大到 12 億平方英尺。因此,預計到 2030 年,商業領域對乾混砂漿的需求將比 2023 年增加 1,395 萬噸。
由於政府加大對建築業的投資,亞太地區對乾混砂漿的需求旺盛
- 乾混砂漿由精確比例的水泥、沙子、礦物和功能添加劑製成,可用於混凝土保護、維修、抹灰、抹灰和防水。 2022 年澳洲乾混砂漿市場銷售量與 2021 年相比大幅成長 17.32%。 2023 年,受住宅和基礎建設強勁投資的推動,亞太地區銷量較去年與前一年同期比較成長 4.07%。
- 2022 年,中國將在亞太乾混砂漿市場佔據主要佔有率。儘管政府實施封鎖,但中國基礎設施產業的規模在 2021 年至 2022 年期間仍成長了 4.29%。這一成長得益於交通基礎設施支出的顯著增加,從 2021 年的 1,576 億美元增加到 2022 年的 1,656 億美元。此外,中國住宅建築業經歷了重大改革和政策變化,重新點燃了消費者對購屋的興趣。隨著持續的投入和努力,中國市場預計2023年將實現3.83%的銷售成長。
- 在預測期內,印尼乾混砂漿市場將以 6.74% 的複合年成長率最快。根據《首都建設法案》,印尼已啟動一項耗資 320 億美元的計劃,計劃在 2045 年將首都從雅加達遷至婆羅洲。這項雄心勃勃的計劃包括多用戶住宅、製造單位和基礎設施,這意味著乾混砂漿的需求將激增。
亞太乾混砂漿市場趨勢
印度及其他地區零售和辦公空間的成長推動了亞太商業建築業的發展
- 2022年亞太地區新增零售占地面積與前一年同期比較3.23%。造成這項挫折的因素包括監管壓力、通貨膨脹上升和抵押房屋抵押貸款利率飆升等。預計到 2023 年,該地區將復甦,新增商業占地面積約 1.46 億平方英尺。激增的主要原因是外國直接投資(FDI)增加,刺激了對新辦公室、倉庫、零售店和其他設施的需求。其中,預計2023年越南建築業將吸引7,144萬美元的外國直接投資。
- 2020 年,亞太地區新零售占地面積遭遇重大挫折,與 2019 年相比下降了 21.92%。下降的主要原因是政府大規模封鎖擾亂了計劃工作,並嚴重影響了供應鏈、設施和勞動力。然而,隨著限制的放寬,該地區出現了顯著的復甦,2021 年新的商業占地面積躍升 20.98%,達到約 5.26 億平方英尺的占地面積。
- 預計亞太地區新商業占地面積將大幅成長,預計 2030 年將比 2023 年增加 14.1 億平方英尺。這一成長是由對購物中心、辦公空間和零售店不斷成長的需求所推動的。亞太地區已成為全球零售強國,貢獻了全球零售成長的近四分之三。例如,印度前七大城市的甲級辦公室市場到 2026 年可能會成長到 10 億平方英尺,到 2030 年可能會成長到 12 億平方英尺。整體而言,預測期內亞太地區新商業占地面積預計複合年成長率為 5.16%。
印度的經濟適用住宅將會增加,到2030年可能達到2,500萬套,該地區的住宅建設也將擴大。
- 2022年亞太地區住宅占地面積較去年與前一年同期比較下降約5.39%。在新冠疫情期間建築活動激增之後,該行業正逐漸恢復正常,而此次建築活動數量出現下降。該地區住宅產業的發展受到人口成長、富裕程度提高和都市化快速發展的推動。預計 2023 年該地區新住宅占地面積將比 2022 年增加 4.1 億平方英尺。
- 2020年,亞太地區新建住宅占地面積較2019年下降約5.06%。這主要是由於政府封鎖、供應鏈中斷、勞動力短缺、建築生產力放緩以及外國投資低迷。然而,隨著限制措施的放寬,該地區出現了強勁復甦,由於新房屋建設增加,2021 年新住宅住宅占地面積激增約 14 億平方英尺。例如,僅在 2021 年,印度住宅房地產市場將在前七大城市推出約 163,000 套住宅。
- 預計預測期內亞太地區住宅新建建築占地面積的複合年成長率將達到 3.98%。這一成長是由於住宅需求、投資增加和政府的優惠政策所致。重點建造更多經濟適用住宅預計將振興該地區的住宅建築業並有助於其復甦。到 2030 年,預計印度將有超過 40% 的人口居住在都市區,這將需要額外 2,500 萬套經濟適用住宅。預計需求激增將推動印度住宅房地產市場到 2030 年達到 150 萬套。
亞太乾混砂漿產業概況
亞太乾混砂漿市場較為分散,前五大公司佔12.67%的市佔率。該市場的主要企業有:韓一控股、東方雨虹、聖戈班、SCG和西卡股份公司(按字母順序排列)。
其他福利
- Excel 格式的市場預測 (ME) 表
- 3個月的分析師支持
目錄
第1章執行摘要和主要發現
第2章 報告要約
第3章 引言
- 研究假設和市場定義
- 研究範圍
- 調查方法
第4章 產業主要趨勢
- 終端使用領域的趨勢
- 商業
- 工業/設施
- 基礎設施
- 住宅
- 重大基礎設施計劃(目前和已宣布)
- 法律規範
- 價值鍊和通路分析
第5章市場區隔
- 最終用途領域
- 商業
- 工業/設施
- 基礎設施
- 住宅
- 應用
- 混凝土保護與維修
- 水泥漿
- 絕緣和飾面系統
- 石膏
- 使成為
- 磁磚膠
- 防水漿料
- 其他用途
- 國家
- 澳洲
- 中國
- 印度
- 印尼
- 日本
- 馬來西亞
- 韓國
- 泰國
- 越南
- 其他亞太地區
第6章 競爭格局
- 關鍵策略趨勢
- 市場佔有率分析
- 商業狀況
- 公司簡介
- Asia Cement Co., Ltd.
- BBMG Corporation
- HANIL HOLDINGS CO.,LTD.
- MBCC Group
- Oriental Yuhong
- Saint-Gobain
- SAMPYO GROUP
- SCG
- Sika AG
- UltraTech Cement Ltd.
第7章:CEO面臨的關鍵策略問題
第 8 章 附錄
- 世界概況
- 概述
- 五力分析框架(產業吸引力分析)
- 全球價值鏈分析
- 市場動態(DRO)
- 資訊來源及延伸閱讀
- 圖片列表
- 關鍵見解
- 數據包
- 詞彙表
簡介目錄
Product Code: 93365
The Asia-Pacific Dry Mix Mortar Market size is estimated at 143.55 million Tons in 2024, and is expected to reach 204.70 million Tons by 2030, growing at a CAGR of 6.09% during the forecast period (2024-2030).
Rising demand for housing units is likely to drive the dry mix mortar growth
- By 2022, Asia-Pacific dominated the global dry mix mortar market, accounting for 40.73% of the total share. In 2023, the region's dry mix mortar consumption grew by 4.07% in volume, driven by rising demand from both commercial and residential construction sectors.
- In 2022, the residential sector in Asia-Pacific emerged as the leading consumer of dry mix mortar, comprising 60.34% of the market. Factors such as increasing urbanization, government initiatives, and investments, both domestic and foreign, fueled the region's housing needs. For example, the Government of Indonesia (GOI) aimed to build 1 million housing units by 2025, with the country's total housing demand projected to hit 30 million units. Consequently, the demand for dry mix mortar in the residential sector was forecast to surge from 81.5 million tons in 2023 to 119.7 million tons in 2030.
- The commercial sector in Asia-Pacific was poised to witness the highest growth rate in dry mix mortar consumption, with a CAGR of 7.64% during the forecast period. Anticipated growth in shopping malls, office spaces, and retail centers led to a rise of 178 million sq. ft in commercial floor area in 2025 compared to the previous year. For instance, India's Grade A office market in its top seven cities was projected to expand to 1 billion square feet by 2026 and further to 1.2 billion square feet by 2030. Consequently, the demand for dry mix mortar in the commercial sector was estimated to increase by 13.95 million tons by 2030 compared to 2023.
High demand for dry-mix mortar forecast in Asia-pacific due to rising government investments in the construction sector
- Dry-mix mortar, comprising cement, sand, minerals, and functional additives in precise ratios, finds applications in concrete protection, renovation, rendering, plastering, and waterproofing. Australia's dry-mix mortar market witnessed a significant 17.32% volume growth in 2022 compared to 2021. In the year 2023, Asia-Pacific, driven by robust investments in residential and infrastructure construction, experienced a 4.07% volume growth over the previous year.
- In the year 2022, China held a substantial share of the Asia-Pacific dry-mix mortar market. Despite government-imposed lockdowns, China's infrastructure sector witnessed a 4.29% volume growth between 2021 and 2022. This growth was fueled by a notable increase in transport infrastructure spending, rising from USD 157.6 billion in 2021 to USD 165.6 billion in 2022. Additionally, the residential construction sector in China underwent significant reforms and policy changes, rekindling consumer interest in property purchases. With continued investments and initiatives, the Chinese market experienced a 3.83% volume growth in 2023.
- Indonesia's dry-mix mortar market is set to witness the fastest CAGR of 6.74% in volume during the forecast period. Under the "Capital City Bill," Indonesia embarked on a USD 32 billion project to relocate its capital from Jakarta to Borneo Island by the year 2045. This ambitious endeavor encompasses housing complexes, manufacturing units, and infrastructure, signaling a surge in dry-mix mortar demand.
Asia-Pacific Dry Mix Mortar Market Trends
Rising retail and office spaces in countries such as India to boost the Asia-Pacific commercial construction sector
- In 2022, Asia-Pacific witnessed a 3.23% decline in its commercial new floor area compared to the previous year. This setback was attributed to factors such as regulatory pressures, higher inflation, and a surge in mortgage rates. In 2023, the region rebounded, with commercial construction new floor area increasing by approximately 146 million sq. ft. This surge was primarily driven by a rise in foreign direct investment (FDI), which spurred the demand for new offices, warehouses, retail outlets, and other facilities. Notably, the Vietnamese construction sector attracted an FDI capital of USD 71.44 million in 2023.
- In 2020, the Asia-Pacific region experienced a significant setback in commercial new floor area, with a volume decline of 21.92% compared to 2019. This decline was primarily due to widespread government lockdowns, which disrupted project work and severely impacted supply chains, equipment, and labor. However, as restrictions eased, the region witnessed a remarkable rebound, with its commercial new floor area surging by 20.98% in 2021, reaching a volume of approximately 526 million sq. ft.
- Asia-Pacific's commercial new floor area is projected to witness substantial growth, with an estimated increase of 1.41 billion sq. ft by 2030 compared to 2023. This surge is fueled by a rising demand for shopping malls, office spaces, retail outlets, and more. The Asia-Pacific region is emerging as a global retail powerhouse, contributing to nearly three-quarters of the worldwide retail growth. For instance, the Indian Grade A office market in its top seven cities may to expand to 1 billion sq. ft by 2026 and further to 1.2 billion sq. ft. by 2030. Overall, the commercial new floor area in Asia-Pacific is projected to witness a volume CAGR of 5.16% during the forecast period.
Rising affordable housing units, such as India's likely to reach 25 million by 2030, to augment the residential constructions in the region
- In 2022, the residential new floor area in the Asia-Pacific region saw a volume decline of approximately 5.39% from the previous year. This dip was a result of the sector normalizing after a surge in building activity during the COVID-19 pandemic. The region's residential sector is driven by a growing population, increasing wealth, and rapid urbanization. The residential new floor area in the region was expected to rise by 410 million sq. ft in 2023 compared to 2022.
- In 2020, the residential new floor area in Asia-Pacific declined in volume by around 5.06% compared to 2019. This was primarily due to government-imposed lockdowns, disruptions in the supply chain, labor shortages, reduced construction productivity, and low foreign investments. However, as restrictions eased, the region saw a significant rebound, with the residential new floor area surging by about 1.4 billion sq. ft in 2021, driven by the addition of new residential housing units. For instance, in 2021 alone, the Indian residential real estate market introduced approximately 163 thousand new residential units across its top seven cities.
- The residential new floor area in the Asia-Pacific region is projected to witness a CAGR of 3.98% during the forecast period. This growth can be attributed to the demand for housing, increased investments, and favorable government policies. The focus on constructing more affordable housing units is expected to rejuvenate the residential construction sector in the region, aiding its recovery. By 2030, it is estimated that over 40% of India's population will reside in urban areas, leading to a demand for an additional 25 million affordable housing units. This surge in demand is expected to push the Indian residential real estate market to reach 1.5 million units by 2030.
Asia-Pacific Dry Mix Mortar Industry Overview
The Asia-Pacific Dry Mix Mortar Market is fragmented, with the top five companies occupying 12.67%. The major players in this market are HANIL HOLDINGS CO.,LTD., Oriental Yuhong, Saint-Gobain, SCG and Sika AG (sorted alphabetically).
Additional Benefits:
- The market estimate (ME) sheet in Excel format
- 3 months of analyst support
TABLE OF CONTENTS
1 EXECUTIVE SUMMARY & KEY FINDINGS
2 REPORT OFFERS
3 INTRODUCTION
- 3.1 Study Assumptions & Market Definition
- 3.2 Scope of the Study
- 3.3 Research Methodology
4 KEY INDUSTRY TRENDS
- 4.1 End Use Sector Trends
- 4.1.1 Commercial
- 4.1.2 Industrial and Institutional
- 4.1.3 Infrastructure
- 4.1.4 Residential
- 4.2 Major Infrastructure Projects (current And Announced)
- 4.3 Regulatory Framework
- 4.4 Value Chain & Distribution Channel Analysis
5 MARKET SEGMENTATION (includes market size, forecasts up to 2030 and analysis of growth prospects.)
- 5.1 End Use Sector
- 5.1.1 Commercial
- 5.1.2 Industrial and Institutional
- 5.1.3 Infrastructure
- 5.1.4 Residential
- 5.2 Application
- 5.2.1 Concrete Protection and Renovation
- 5.2.2 Grouts
- 5.2.3 Insulation and Finishing Systems
- 5.2.4 Plaster
- 5.2.5 Render
- 5.2.6 Tile Adhesive
- 5.2.7 Water Proofing Slurries
- 5.2.8 Other Applications
- 5.3 Country
- 5.3.1 Australia
- 5.3.2 China
- 5.3.3 India
- 5.3.4 Indonesia
- 5.3.5 Japan
- 5.3.6 Malaysia
- 5.3.7 South Korea
- 5.3.8 Thailand
- 5.3.9 Vietnam
- 5.3.10 Rest of Asia-Pacific
6 COMPETITIVE LANDSCAPE
- 6.1 Key Strategic Moves
- 6.2 Market Share Analysis
- 6.3 Company Landscape
- 6.4 Company Profiles
- 6.4.1 Asia Cement Co., Ltd.
- 6.4.2 BBMG Corporation
- 6.4.3 HANIL HOLDINGS CO.,LTD.
- 6.4.4 MBCC Group
- 6.4.5 Oriental Yuhong
- 6.4.6 Saint-Gobain
- 6.4.7 SAMPYO GROUP
- 6.4.8 SCG
- 6.4.9 Sika AG
- 6.4.10 UltraTech Cement Ltd.
7 KEY STRATEGIC QUESTIONS FOR CONCRETE, MORTARS AND CONSTRUCTION CHEMICALS CEOS
8 APPENDIX
- 8.1 Global Overview
- 8.1.1 Overview
- 8.1.2 Porter's Five Forces Framework (Industry Attractiveness Analysis)
- 8.1.3 Global Value Chain Analysis
- 8.1.4 Market Dynamics (DROs)
- 8.2 Sources & References
- 8.3 List of Tables & Figures
- 8.4 Primary Insights
- 8.5 Data Pack
- 8.6 Glossary of Terms
02-2729-4219
+886-2-2729-4219
 全球乾混砂漿市場:依產品種類、塑化劑種類、應用、黏結劑系統及地區劃分(至2032年)
 乾混砂漿市場按類型、應用、最終用途、包裝、通路和計劃類型分類-2025年至2032年全球預測乾混砂漿添加劑和化學品市場(按砂漿類型、添加劑類型、最終用途、形態和應用方法分類)—2025-2032年全球預測
 2025年乾混砂漿添加劑和化學品全球市場報告2025年全球工廠批量乾砂漿市場報告2025年全球乾混砂漿市場報告
 乾混砂漿添加劑和化學品市場規模、佔有率、成長分析(按添加劑類型、化學品類型、應用、最終用戶和地區)- 產業預測,2025 年至 2032 年
 乾混砂漿添加劑和化學品:市場佔有率分析、行業趨勢和統計、成長預測(2025-2030 年)乾混砂漿:市場佔有率分析、產業趨勢與統計、成長預測(2025-2030)北美乾混砂漿:市場佔有率分析、行業趨勢和成長預測(2025-2030 年)
▼