


 |
市場調查報告書
商品編碼
1693616
北美電動公車:市場佔有率分析、行業趨勢和成長預測(2025-2030 年)North America Electric Bus - Market Share Analysis, Industry Trends & Statistics, Growth Forecasts (2025 - 2030) |
||||||
價格
※ 本網頁內容可能與最新版本有所差異。詳細情況請與我們聯繫。
簡介目錄
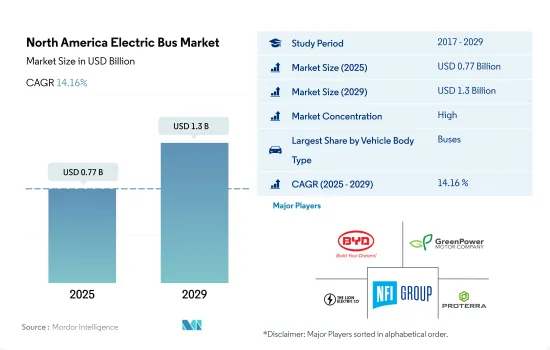
北美電動公車市場規模預計在 2025 年為 7.7 億美元,預計到 2029 年將達到 13 億美元,預測期內(2025-2029 年)的複合年成長率為 14.16%。
環境問題和減少碳排放的需要促使政府和交通部門採用更清潔、更永續的交通方式。
- 北美對電動公車的需求正在大幅成長。美國是電動公車銷量最高的國家之一,其次是加拿大和墨西哥。人口成長、交通量增加以及公共運輸使用優先順序的改變等因素促進了該地區電動公車的成長。
- 在新冠疫情期間,電動公車市場遭遇挫折,導致交通運輸業陷入停滯。然而,隨著該地區擺脫疫情,公共運輸需求顯著增加,這對電動公車市場產生了積極影響。因此,2022 年北美電動公車銷量與 2021 年相比有所增加。
- 到2027年,北美電動公車市場規模預計將超過8.5億美元。美國和加拿大政府都在製定計劃,在全部區域建立強大的充電基礎設施。 2021 年 6 月,美國運輸部下屬的聯邦運輸管理局 (FTA) 撥款約 1.82 億美元。預計這些資金將惠及46個州的約49個電動公車計劃。透過 Low-No 計劃,FTA 旨在鼓勵採用環保技術和燃料,並幫助公車採購電動和氫動力公車。這些舉措將進一步推動北美電動公車市場的成長。
北美電動巴士市場趨勢
由於政府支持和對環境問題的日益關注,北美對電動車的需求不斷增加
- 近年來,俄羅斯共產黨經歷了顯著的起伏。從 2017 年的 2.082 億美元穩步上升至 2019 年的高峰。然而,由於新冠疫情帶來的經濟挑戰,2020 年這一數字下降至 1.939 億美元。值得注意的是,該市場預計將在 2022 年強勁復甦,達到 2.698 億美元。復甦凸顯了俄羅斯汽車產業的韌性以及獎勵策略的潛在影響。
- 政府的激勵和補貼對客戶(尤其是物流和電子商務公司)採用電動商用車具有強大的吸引力。其中一個例子是加拿大和北美,政府宣布將於 2022 年 4 月為輕型和中型電動車提供 5,000 美元的聯邦退稅。預計這些努力將推動2024年至2030年間北美對電動商用車的需求大幅成長。
- 電動車部署計劃、有吸引力的稅收優惠和外國投資津貼等政府措施將推動北美國家的電動車市場發展。引人注目的是,2022 年 3 月,福斯承諾斥資 70 億美元在北美建立電動車製造工廠。至2030年,福斯汽車計畫為美國、墨西哥和加拿大的客戶推出25款新型電動車型。因此,預計 2024 年至 2030 年間北美對電動車的需求將顯著成長。
北美電動巴士產業概況
北美電動公車市場格局較為集中,前五大公司佔了81.84%的市場。該市場的主要企業包括比亞迪汽車、GreenPower Motor Company Inc.、Lion Electric Company、NFI Group Inc.、Proterra INC. 等。
其他福利
- Excel 格式的市場預測 (ME) 表
- 3個月的分析師支持
目錄
第1章執行摘要和主要發現
第2章 報告要約
第3章 引言
- 研究假設和市場定義
- 研究範圍
- 調查方法
第4章 產業主要趨勢
- 人口
- 人均GDP
- 消費者汽車支出(cvp)
- 通貨膨脹率
- 汽車貸款利率
- 共乘
- 電氣化的影響
- 電動車充電站
- 電池組價格
- 新款 Xev 車型發布
- 燃油價格
- OEM生產統計
- 法律規範
- 價值鍊和通路分析
第5章市場區隔
- 燃料類別
- BEV
- FCEV
- HEV
- 國家
- 加拿大
- 墨西哥
- 美國
第6章 競爭格局
- 關鍵策略趨勢
- 市場佔有率分析
- 商業狀況
- 公司簡介
- Blue Bird Corporation
- BYD Auto Co. Ltd.
- CAF Group(Solaris Bus & Coach)
- Daimler Truck Holding AG
- GILLIG LLC
- GreenPower Motor Company Inc.
- Lion Electric Company
- NFI Group Inc.
- Proterra INC.
- Volvo Group
- Xiamen King Long Motor Group Co. Ltd.
第7章 CEO 的關鍵策略問題
第 8 章 附錄
- 世界概況
- 概述
- 五力分析框架
- 全球價值鏈分析
- 市場動態(DRO)
- 資訊來源及延伸閱讀
- 圖片列表
- 關鍵見解
- 數據包
- 詞彙表
簡介目錄
Product Code: 93000
The North America Electric Bus Market size is estimated at 0.77 billion USD in 2025, and is expected to reach 1.3 billion USD by 2029, growing at a CAGR of 14.16% during the forecast period (2025-2029).
Environmental concerns and the need to reduce carbon emissions have pushed governments and transportation authorities to adopt cleaner and more sustainable modes of transportation
- The demand for electric buses in North America is growing significantly. The United States is one of the top countries with the highest sales of electric buses, followed by Canada and Mexico. Factors such as expanding populations, rising traffic, and a change in priorities for using public transit are contributing to the growth of electric buses in the region.
- The electric bus market faced a setback during the COVID-19 pandemic, which brought the transportation sector to a standstill. However, as the region emerged from the pandemic, there was a notable uptick in public transportation demand, positively impacting the electric bus market. Consequently, North America saw a rise in electric bus sales in 2022 compared to 2021.
- By 2027, the market value of electric buses in North America is projected to exceed USD 850 million. Both the United States and Canadian governments are devising plans to establish robust charging infrastructure across the region. In June 2021, the Federal Transit Administration (FTA), a division of the US Department of Transportation, awarded approximately USD 182 million. These funds are expected to benefit around 49 electric bus projects spanning 46 states. Through its Low-No Program, the FTA aims to facilitate the adoption of green technologies and fuels, assisting transportation organizations in procuring electric and hydrogen buses. These initiatives are poised to further propel the growth of the North American electric bus market in the future.
North America Electric Bus Market Trends
Growing demand for electric vehicles in North America driven by government support and growing environmental concerns
- The CVP in Russia has experienced significant fluctuations in recent years. It climbed steadily from USD 208.2 million in 2017, peaking in 2019. However, it dipped to USD 193.9 million in 2020, largely due to the economic challenges brought on by the COVID-19 pandemic. Notably, the market rebounded sharply in 2022, reaching USD 269.8 million. This resurgence highlights both the resilience of the Russian automotive sector and the potential impact of economic stimulus measures and heightened consumer demand.
- Government incentives and subsidies are proving to be a strong draw for customers, particularly logistics and e-commerce firms, in their adoption of electric commercial vehicles. A case in point is Canada and North America, where, in April 2022, the government unveiled federal rebates of USD 5000 for electric light- and medium-duty vehicles. These initiatives are expected to significantly bolster the demand for electric commercial vehicles in North America from 2024 to 2030.
- Government initiatives, including plans for EV deployment, attractive incentives, and foreign investment allowances, are set to propel the electric vehicle market across North American nations. In a notable move, in March 2022, Volkswagen committed a staggering USD 7 billion to establish an electric car manufacturing facility in North America. By 2030, the automaker plans to roll out 25 new EV models, catering to customers in the US, Mexico, and Canada. As a result, the demand for electric vehicles is projected to witness a notable surge across various North American countries from 2024 to 2030.
North America Electric Bus Industry Overview
The North America Electric Bus Market is fairly consolidated, with the top five companies occupying 81.84%. The major players in this market are BYD Auto Co. Ltd., GreenPower Motor Company Inc., Lion Electric Company, NFI Group Inc. and Proterra INC. (sorted alphabetically).
Additional Benefits:
- The market estimate (ME) sheet in Excel format
- 3 months of analyst support
TABLE OF CONTENTS
1 EXECUTIVE SUMMARY & KEY FINDINGS
2 REPORT OFFERS
3 INTRODUCTION
- 3.1 Study Assumptions & Market Definition
- 3.2 Scope of the Study
- 3.3 Research Methodology
4 KEY INDUSTRY TRENDS
- 4.1 Population
- 4.2 GDP Per Capita
- 4.3 Consumer Spending For Vehicle Purchase (cvp)
- 4.4 Inflation
- 4.5 Interest Rate For Auto Loans
- 4.6 Shared Rides
- 4.7 Impact Of Electrification
- 4.8 EV Charging Station
- 4.9 Battery Pack Price
- 4.10 New Xev Models Announced
- 4.11 Fuel Price
- 4.12 Oem-wise Production Statistics
- 4.13 Regulatory Framework
- 4.14 Value Chain & Distribution Channel Analysis
5 MARKET SEGMENTATION (includes market size in Value in USD and Volume, Forecasts up to 2029 and analysis of growth prospects)
- 5.1 Fuel Category
- 5.1.1 BEV
- 5.1.2 FCEV
- 5.1.3 HEV
- 5.2 Country
- 5.2.1 Canada
- 5.2.2 Mexico
- 5.2.3 US
6 COMPETITIVE LANDSCAPE
- 6.1 Key Strategic Moves
- 6.2 Market Share Analysis
- 6.3 Company Landscape
- 6.4 Company Profiles
- 6.4.1 Blue Bird Corporation
- 6.4.2 BYD Auto Co. Ltd.
- 6.4.3 CAF Group (Solaris Bus & Coach)
- 6.4.4 Daimler Truck Holding AG
- 6.4.5 GILLIG LLC
- 6.4.6 GreenPower Motor Company Inc.
- 6.4.7 Lion Electric Company
- 6.4.8 NFI Group Inc.
- 6.4.9 Proterra INC.
- 6.4.10 Volvo Group
- 6.4.11 Xiamen King Long Motor Group Co. Ltd.
7 KEY STRATEGIC QUESTIONS FOR VEHICLES CEOS
8 APPENDIX
- 8.1 Global Overview
- 8.1.1 Overview
- 8.1.2 Porter's Five Forces Framework
- 8.1.3 Global Value Chain Analysis
- 8.1.4 Market Dynamics (DROs)
- 8.2 Sources & References
- 8.3 List of Tables & Figures
- 8.4 Primary Insights
- 8.5 Data Pack
- 8.6 Glossary of Terms
02-2729-4219
+886-2-2729-4219
 電動公車市場(按推進類型、底盤類型、應用、載客量、行駛里程和最終用戶分類)—2025-2032 年全球預測電動小巴市場按動力類型、座位數、續航里程、電池容量、應用領域和所有權類型分類-2025-2032年全球預測電動校車市場按動力類型、車身長度、電池容量和最終用戶分類-2025-2032年全球預測
 全球電動公車市場(按公車長度、電池類型、電池容量、功率輸出、續航里程、載客量、應用、消費者、車輛總重、推進系統、零件、自主水平和地區分類)- 預測至 2032 年
 電動公車互聯基礎設施 - 第三版
 全球電動校車市場
 全球燃料電池電動公車市場研究報告 - 產業分析、規模、佔有率、成長、趨勢及 2025 年至 2033 年預測全球純電動公車市場研究報告 - 產業分析、規模、佔有率、成長、趨勢及 2025 年至 2033 年預測
 2025年全球電動公車市場報告全球電動公車市場研究報告 - 產業分析、規模、佔有率、成長、趨勢及 2025 年至 2033 年預測
▼